ATLAS-CONF-2014-035 04July2014
ATLAS NOTE
ATLAS-CONF-2014-035
July 2, 2014
Measurements of the W production cross sections in association with jets with the ATLAS detector
The ATLAS Collaboration
Abstract
This note presents the production cross section of the
Wboson in association with jets, measured in proton–proton collisions at
√s =
7 TeV with the ATLAS experiment at the Large Hadron Collider. This measurement uses a data set corresponding to an integrated luminosity of 4.6 fb
−1recorded during 2011. Cross sections are shown as a function of the jet multiplicity up to seven jets for electron and muon decay modes of the
Wboson.
Differential cross sections are measured with respect to the transverse momenta and rapid- ity of jets for events with multiplicities up to five jets. The di
fferential cross sections as a function of the sum of the transverse momenta of the jets, lepton and neutrino, of the sum of the transverse momentum of the jets, and of the angular separation and invariant mass of the two jets with the highest transverse momenta are also measured. The results have been corrected for detector e
ffects and are quoted in well-defined ranges of jet and lep- ton kinematics corresponding to the detector acceptance. The measurements are compared to next-to-leading-order perturbative QCD calculations, resummation calculations and to predictions from di
fferent Monte Carlo generators implementing next-to-leading-order and leading-order matrix elements supplemented by parton showers.
c
Copyright 2014 CERN for the benefit of the ATLAS Collaboration.
Reproduction of this article or parts of it is allowed as specified in the CC-BY-3.0 license.
1 Introduction
With the large data sample accumulated in 2011 at the Large Hadron Collider, detailed investigations of perturbative quantum chromodynamics (pQCD) and electroweak (EWK) effects are now possible over five orders of magnitude in the cross section as a function of jet multiplicity and six orders of magnitude as a function of the jet transverse momenta. For the production of a massive gauge boson accompanied by jets, jet transverse momenta up to 1 TeV are now, for the first time, accessible and allow access to a kinematic region where higher order EWK effects can become as important as those from higher-order pQCD corrections. During the last few years, advances in the theoretical frameworks for the calculation of final states containing a vector boson and jets allow cross sections to be determined at next-to-leading order (NLO) in pQCD for vector bosons with up to five jets in the final state [1]. However, although calculations of EWK e
ffects exist [2], they are not yet incorporated into the theoretical predictions of
W+ jets production.
Measurements of
W+ jets production in proton–anti-proton collisions with a centre-of-mass energy of
√s =
1.96 TeV have been reported by the CDF and D0 Collaborations [3, 4] and for
√s =
7 TeV proton–proton collisions using an integrated luminosity of 35 pb
−1by the ATLAS collaboration [5]
and 5.0 fb
−1by the CMS collaboration [6]. The study presented here is an updated measurement of
W+ jets production in proton–proton collisions at
√s =
7 TeV using an integrated luminosity of 4.6 fb
−1collected in 2011 and includes an extended kinematic reach and detailed comparisons to a number of new theoretical predictions.
The note is organised as follows. The ATLAS detector is described in Sect. 2. Section 3 provides details on the simulations used in the measurement. A description of the data set, the electron and muon selection, the selection of
W+ jets events and the background estimation is given in Sect. 4. The procedure used to correct the measurements for detector e
ffects and the combination of the electron and muon results are described in Sect. 5. The treatment of the systematic uncertainties is detailed in Sect. 6. Section 7 provides a description of the NLO pQCD predictions and corrections applied to them.
Section 8 discusses the results. Finally Sect. 9 provides conclusions.
2 ATLAS detector
The ATLAS detector [7] is a multi-purpose detector with a symmetric cylindrical geometry and nearly 4π coverage in solid angle.
1The collision point is surrounded by inner tracking devices, which in increasing radii are followed by a superconducting solenoid providing a 2 T magnetic field, a calorimeter system, and a muon spectrometer. In order of increasing radii, the inner tracker consists of silicon pixel and mi- crostrip detectors and a transition radiation tracker, and provides precision tracking for charged particles in the pseudorapidity range
|η|<2.5. The calorimeter system has liquid argon (LAr) or scintillator tiles as the active media. In the pseudorapidity region
|η| <3.2, high-granularity LAr electromagnetic (EM) sampling calorimeters are used. A scintillator tile calorimeter provides hadronic coverage for
|η|<1.7.
The endcap and forward regions, spanning 1.5
< |η| <4.9, are instrumented with LAr calorimeters for both EM and hadronic measurements. The muon spectrometer consists of three large superconducting toroids and a system of trigger chambers and precision tracking chambers which provide triggering and tracking capabilities in the ranges
|η|<2.4 and
|η|<2.7 respectively.
1ATLAS uses a right-handed coordinate system with its origin at the nominal interaction point (IP) in the centre of the detector and thez-axis along the beam pipe. Thex-axis points from the IP to the centre of the LHC ring, and they-axis points upward. Cylindrical coordinates (r,φ) are used in the transverse plane,φbeing the azimuthal angle around the beam pipe. The pseudorapidity is defined in terms of the polar angleθasη=−ln tan(θ/2).
3 Simulated event samples
Simulated event samples are used for some of the background estimates, for the correction of the signal yield for detector effects and for comparisons of the results to theoretical expectations.
W→`ν
and
Z →``(`
=e, µ, τ) events with associated jets are generated with ALPGEN v2.13 [8].The matrix-element implemented in this generator produces events with up to five additional partons in the final state and is interfaced to HERWIG v6.520 [9] for parton shower and fragmentation, with JIMMY v4.31 [10] for underlying event contributions and with PHOTOS [11] to calculate final-state QED radia- tion. ALPGEN uses the MLM matching scheme [8] to remove any double counting between the matrix element and parton shower calculations. The CTEQ61L [12] parton distribution functions (PDF) are used with the AUET2-CTEQ6L1 tune [13]. ALPGEN samples including heavy-flavour production, such as
W+bb,¯
W+cc¯ and
W+cproduction, are used in some background estimates.
W →`νsamples are also produced with ALPGEN v2.14 interfaced to PYTHIA v6.425 [14] using the PERUGIA2011C [15] tune and are used in the estimates of the uncertainties for parton-level NLO pQCD predictions, as described in Sect. 7. An additional set of
W → `νsamples with up to four additional partons is generated with SHERPA v1.4.1 [16, 17], which uses the CKKW [18] matching scheme, CT10 PDF [19] and an internal model for QED radiation based on the YFS method [20].
Top quark pair production is simulated with ALPGEN interfaced to HERWIG, using the same con- figuration as for the
Wsamples. Additional
t¯tsamples are generated with the POWHEG-Box v1.0 generator [21], interfaced to PYTHIA using the PERUGIA2011C tune and configured to use CT10 PDF.
Single top quark production is modelled with AcerMC 3.8 [22] with MRST LO* PDF [23] interfaced to PYTHIA. The diboson production processes
WW,WZ, andZZare generated with HERWIG v6.510, interfaced to JIMMY v4.3 and using MRST LO* PDF and the AUET2-LO* tune [13].
The generated samples are passed through the simulation of the ATLAS detector based on GEANT4 [24, 25] and through the trigger simulation. The simulated samples are overlaid with additional proton–proton interactions ("pile-up") generated with PYTHIA using the AMBT1 tune [26] and the distribution of the average number of interactions per bunch crossing is reweighted to agree with the corresponding data distribution before any selection. The simulated events are reconstructed and analysed with the same analysis chain as for the data. Scale factors are applied to the simulated samples to correct for any small differences from data in the efficiency of lepton triggers, reconstruction and identification efficiencies.
All samples are normalised to the inclusive cross sections calculated at higher orders in pQCD. The
Wand
Zsamples are normalised to the next-to-next-to-leading order (NNLO) pQCD inclusive predictions calculated with the FEWZ [27] program and MSTW2008 NNLO PDF [28]. The
t¯tcross section is calculated at NNLO
+NNLL as in Refs. [29–34] and the diboson cross sections are calculated at NLO using MCFM [35] with MSTW2008 PDF.
4 Data selection and event analysis
The data used in this analysis were collected during the 2011 LHC proton–proton collision run at a centre-of-mass energy of
√s=
7 TeV. After application of beam and data-quality requirements, the total integrated luminosity is 4.6 fb
−1with an uncertainty of 1.8% [36].
W → eν
candidate events are selected for analysis using a single-electron trigger, which required a transverse momentum (p
T) greater than 20 GeV for the first 1.5 fb
−1of data and a transverse momentum greater than 22 GeV for the remaining 3.1 fb
−1of data.
W → µνcandidate events are selected by requiring a single-muon trigger, where the muon has a transverse momentum greater than 18 GeV. For both the electron and muon triggers, the thresholds are low enough to ensure that leptons with
pT >25 GeV lie on the trigger e
fficiency plateau.
In both decay channels, events are required to have at least one reconstructed vertex with at least
three associated tracks, where the tracks must have a
pTgreater than 400 MeV. The vertex with the largest
Σp2Tof associated tracks is taken as the primary vertex.
4.1 Electron Reconstruction and Identification
Electrons are reconstructed from energy clusters in the calorimeter and matched to an inner detector track.
They are required to pass a set of identification criteria. This so-called “tight” selection is similar to the one defined in Ref. [37] but re-optimised for 2011 data conditions [38]. The “tight” selection includes cuts on the transverse impact parameter with respect to the primary vertex and on the number of hits in the innermost pixel layer in order to reject photon conversions. The electron must have
pT >25 GeV and
|η| <2.47 and electrons in the transition region between the barrel and endcap calorimeter (1.37
<|η| <
1.52) are rejected. Events are rejected if there is a second electron passing the same selection as above. In order to suppress background from events where a jet is mis-identified, the electron is required to be isolated. A
pT- and
η-dependent requirement on a combination of calorimeter and track isolationvariables is applied to the electron, in order to yield a constant e
fficiency across di
fferent momentum ranges and detector regions. The track-based isolation uses a cone size of
∆R≡ p(∆
φ)2+(∆
η)2 =0.4 and the calorimeter-based isolation uses a cone size of
∆R=0.2. The actual isolation requirements range between 2.5 GeV and 4.5 GeV for the calorimeter-based isolation and between 2.0 GeV and 3.0 GeV for the track-based isolation.
4.2 Muon Reconstruction and Identification
Muons are required to be reconstructed by both the inner detector and muon spectrometer systems [39]
and to have
pT >25 GeV and
|η| <2.4. Events are rejected if there is a second muon passing the same kinematic selections as above. As in the electron channel, an isolation criterion is applied to reduce the background of semileptonic heavy-flavour decays. The track-based isolation fraction, which is defined as the scalar sum of the
pTof all tracks within a cone size of
∆R=0.2 around the muon, divided by the
pTof the muon itself,
ΣptracksT /pmuonT, must be less than 10%. To further reject events from semileptonic heavy- flavour decays, the transverse impact parameter significance of the muon with respect to the primary vertex is required to satisfy
|d0/σ(d0)|
<3.0 where
d0is the muon impact parameter and
σ(d0) is the estimated per-track uncertainty on
d0.
4.3 Jet selection
Jets are reconstructed using the anti-k
talgorithm [40] with a radius parameter
R=0.4 using topological clusters [41] of energy depositions in the calorimeters as input. Jets arising from detector noise or non- collision events are rejected. To take into account the di
fferences in calorimeter response to electrons and hadrons and to correct for dead material and out-of-cone effects,
pT- and
η-dependent factors, derivedfrom a combination of simulated events and in situ methods [41], are applied to each jet to provide an average energy scale correction. The jet energies are also corrected to account for energy arising from pile-up. The jet calibration is propagated to the estimate of the missing transverse momentum.
Jets are required to have
pT >30 GeV and a rapidity of
|y| <4.4. Rapidity is defined as
12ln[(E
+ pz)/(E
− pz)], where
Edenotes the energy and
pzis the component of the momentum along the beam
direction. All jets within
∆R=0.5 of an electron or muon that passed the lepton identification require-
ments are removed. In order to reject jets from additional proton–proton interactions, the scalar
pTsum
of the tracks which are associated to the jet and are consistent with originating from the primary vertex
is required to be greater than the 75% of the
pTsum of all tracks associated to the jet. This criterion is
applied to jets within the acceptance of the tracking detectors of
|η|<2.4. The residual impact of pile-up
on the distribution of the jet observables has been checked and the simulation reproduces well the pile-up conditions.
4.4 W selection
Both
W → eνand
W →µνevents are selected by requiring cuts on the missing transverse momentum (E
missT) and the transverse mass (m
T). The latter is defined by the lepton and neutrino
pTand direction as
mT = q2p
`TpνT(1
−cos(φ
`−φν)), where the (x, y) components of the neutrino momentum are inferred from the corresponding
EmissTcomponents. The magnitude and azimuthal direction of
EmissTare measured from the vector sum of the transverse momenta of calibrated physics objects and additional low energy calorimeter deposits [42]. Events are required to have
ETmiss>25 GeV and
mT>40 GeV.
4.5 Background
In both the electron and muon channels, the background processes include
W →τνwhere the
τdecays to an electron or muon,
Z →eeor
Z →µµwhere one lepton is not identified,
Z→ττ, leptonict¯tdecays (t¯
t → bbqq0lνand
t¯t → bblνlν), single-top, diboson (WW,
WZ,ZZ) and multijet events. The multijetbackground in the electron channel has two components: one where a light-flavour jet passes the electron selection and additional energy mismeasurement in the event results in large
ETmissand another where a bottom- or charm-hadron decays to an electron. For the muon channel, the multijet background arises from semileptonic heavy flavour decays.
At small numbers of associated jets (N
jets) the dominant background arises from multijet events which constitute 11% of the event sample with one jet while at high multiplicities
t¯tevents are dominant and make up 80% of the total event sample for
Njets=7. The
t¯tbackground can be reduced by applying a veto on events with
b-jets. However, the selection of this analysis was kept as inclusive as possibleto allow for direct comparison with other vector boson measurements, i.e.
Z+ jets [39] and the ratio of
W/Z+jets [43] and to minimise theoretical uncertainties on the fiducial cross-section definition. For both the multijet and
t¯tbackgrounds, data-driven methods are used to determine both the total number of background events in the signal region as well as the shape of the background for each of the differential distributions.
The number of multijet background events is estimated by fitting, in each jet multiplicity bin, the
EmissTdistribution in the data (with all selection cuts applied except the cut on
ETmiss) to a sum of two templates: one for the multijet background and another which includes signal and all other backgrounds.
In both the muon and electron channels, the shape for the first template is obtained from data while the second template is from simulation. To select a data sample enriched in multijet events in the electron channel, dedicated electron triggers with loose identification criteria and additional triggers requiring both electrons and jets are used. The multijet template is built from events for which the “tight” require- ments of the nominal electron selection fail in order to suppress signal contamination. Electrons are also required to be non-isolated in the calorimeter, i.e. they are required to have an energy deposition in the calorimeter in a cone of
∆R=0.3 centred on the electron direction larger than 20% of the total transverse energy of the electron. In the muon channel, the multijet template is also obtained from data, by selecting events where the scalar sum
pTof all tracks within a cone size
∆R =0.2 around the muon is between 10% and 50% of the muon
pT.
In both channels, the sample used to extract the template for the multijet background is statistically
independent from the signal sample. In the electron channel only, the samples are selected in two distinct
data periods to account for di
fferences in the amount of pile-up between the triggers used to select the
template and the triggers used for the signal region. These two data-period samples are fitted separately
and then combined into an overall multijet estimate. The fit is performed for each jet multiplicity up to
five-jet events. Due to limited statistics in the multijet template for six- and seven-jet events, the number of multijet events is determined by performing a single fit for events with five or more jets.
At high multiplicities, the background from
t¯tevents is larger than the signal itself. Although
t¯tsim- ulations can be used to estimate this background, a data-driven approach is used in order to reduce the systematic uncertainties. Similar to the multijet background determination, the number of
t¯tevents is estimated by fitting a discriminant distribution in the data to the sum of three templates: the
t¯ttemplate, the multijet template and one which includes the signal and all remaining backgrounds. The discrimi- nant variable chosen is the transformed aplanarity, defined as
e−8∗Awhere A, the aplanarity, is 1.5 times the smallest eigenvalue of the normalised momentum tensor as defined in Ref. [44]. By definition, an isotropic event will have an aplanarity of one half, whereas a planar event will have a value of zero. As
t¯tevents are more isotropic than the
Wsignal, the transformed aplanarity was found to yield good separa- tion between the signal and background with small systematic uncertainties on the background estimate.
For the aplanarity calculation, the lepton and all jets passing the selection are used in the momentum tensor. The multijet template is as described above and the
Wsignal template is taken from simulations.
The
t¯ttemplate is derived from a control region in data by requiring at least one
b-tagged jet in the event.A multivariant
b-tagging algorithm was used at a working point with a 70%b-tagging efficiency [45].With this selection, the
t¯tcontrol region has a purity of 60% in events with three jets and 97% in events with six jets. Non-t¯
tevents passing the selection, such as
W+light jets,
W+b,W+cand
b-tagged multi-jet events are subtracted from the
t¯tcontrol region using simulations or in the case of the multijet events using the fit to
ETmissas described above but with the
b-tagged sample. Sinceb-tagging is only availablefor jets within
|η| <2.4 where information from the tracking detectors exists, the
b-tagging selectionbiases some of the kinematic distributions, most notably the jet rapidity distribution. To account for this,
t¯tsimulations are used to correct for any residual bias, where the correction is up to 30%. The fits to the transformed aplanarity distribution are done in each exclusive jet multiplicity from three to six jets. In the fit, the normalisation of the multijet background is obtained from the
ETmissfit above. The estimated number of
t¯tevents are consistent with the predictions from
t¯tsimulations for all distributions and the uncertainties from the data-driven method are smaller than those from the simulations. As the
t¯ttemplate is a sub-sample of the signal data sample, there is a statistical correlation to the signal sample. This is estimated using pseudo-data sets derived via Poisson variations of the signal and
t¯tsimulated samples and is found to be 15% at
Njets=3 and 45% at
Njets=6. The fit uncertainties are corrected to account for this correlation. For lower multiplicities of
Njets≤2, where the fraction of
t¯tis less than 5%, simulations are used for the background estimate.
The remaining backgrounds are estimated with simulated event samples. These background samples are normalised to the integrated luminosity of the data using the cross sections as detailed in Sect. 3.
4.6 Reconstruction Level Results
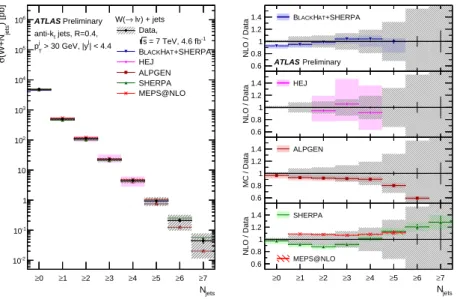
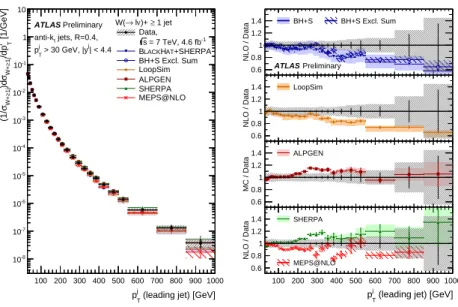
The measured and expected distributions of the jet observables have been compared at the reconstruction level, separately in the electron and muon channels. Some example distributions, namely the inclusive jet multiplicity, the
pTand rapidity of the highest-
pT(leading) jet and the scalar sum
pTof the lepton,
EmissTand all jets (H
T) are shown in Figs. 1-4. The data are consistent with the predictions from the ALPGEN and SHERPA generators. The numbers of selected events including the estimated backgrounds are summarised in Table 1 for both the electron and muon channels.
5 Corrections for detector e ff ects and combination of channels
The yield of signal events is determined by first subtracting the estimated background contributions from
the data event counts. In each channel the data distributions are then corrected for detector effects to
Njets
0 1 2 3 4 5 6 7 8
Events
10 102
103
104
105
106
107
108
109
1010 Data, s = 7 TeV, 4.6 fb-1
(ALPGEN) ν
→ e W
t t Other
→ ee Z Multijets
(SHERPA) ν
→ e W Pred sys
⊗stat Pred sys
Preliminary ATLAS
Njets
0 1 2 3 4 5 6 7 8
Pred / Data 0.5 1 1.5
Njets
0 1 2 3 4 5 6 7 8
Events
10 102
103
104
105
106
107
108
109
1010 Data, s = 7 TeV, 4.6 fb-1
(ALPGEN) ν µ
→ W
t t Other
µ µ
→ Z Multijets
(SHERPA) ν µ
→ W Pred sys
⊗stat Pred sys
Preliminary ATLAS
Njets
0 1 2 3 4 5 6 7 8
Pred / Data 0.5 1 1.5
Figure 1: Distribution of events passing the
W+ jets selection as a function of the inclusive jet multiplicity for the electron (left) and muon (right) channels. On the data points, the statistical uncertainties are shown by the vertical bars and systematic uncertainties, described in Sect. 6, are shown by the hashed bands.
The lower figure shows ratios of the total predictions with either ALPGEN or SHERPA to the data.
The systematic uncertainties are shown by the yellow band and the combined statistical and systematic uncertainties are shown by the green band.
(leading jet) [GeV]
j
pT
100 200 300 400 500 600 700 800 900 1000
Events / GeV
10-3
10-2
10-1
1 10 102
103
104
105
106
107 Data, s = 7 TeV, 4.6 fb-1
(ALPGEN) ν
→ e W
t t Other
→ ee Z Multijets
(SHERPA) ν
→ e W Pred sys
⊗stat Pred sys
Preliminary ATLAS
(leading jet) [GeV]
j
pT
100 200 300 400 500 600 700 800 900 1000 Pred / Data 0.5
1 1.5
(leading jet) [GeV]
j
pT
100 200 300 400 500 600 700 800 900 1000
Events / GeV
10-3
10-2
10-1
1 10 102
103
104
105
106
107 Data, s = 7 TeV, 4.6 fb-1
(ALPGEN) ν µ
→ W
t t Other
µ µ
→ Z Multijets
(SHERPA) ν µ
→ W Pred sys
⊗stat Pred sys
Preliminary ATLAS
(leading jet) [GeV]
j
pT
100 200 300 400 500 600 700 800 900 1000 Pred / Data 0.5
1 1.5
Figure 2: Distribution of events passing the
W+ jets selection as a function of the leading jet
pTfor the electron (left) and muon (right) channels. On the data points, the statistical uncertainties are shown by the vertical bars and systematic uncertainties, described in Sect. 6, are shown by the hashed bands.
The lower figure shows ratios of the total predictions with either ALPGEN or SHERPA to the data.
The systematic uncertainties are shown by the yellow band and the combined statistical and systematic
uncertainties are shown by the green band.
| (leading jet)
|yj
0 0.5 1 1.5 2 2.5 3 3.5 4
|j Events / unit |y
104
105
106
107
108
= 7 TeV, 4.6 fb-1 s
Data, (ALPGEN) ν
→ e W
t t Other
→ ee Z Multijets
(SHERPA) ν
→ e W Pred sys
⊗stat Pred sys
Preliminary ATLAS
| (leading jet)
|yj
0 0.5 1 1.5 2 2.5 3 3.5 4
Pred / Data 0.5 1 1.5
| (leading jet)
|yj
0 0.5 1 1.5 2 2.5 3 3.5 4
|j Events / unit |y
104
105
106
107
108
= 7 TeV, 4.6 fb-1 s
Data, (ALPGEN) ν µ
→ W
t t Other
µ µ
→ Z Multijets
(SHERPA) ν µ
→ W Pred sys
⊗stat Pred sys
Preliminary ATLAS
| (leading jet)
|yj
0 0.5 1 1.5 2 2.5 3 3.5 4
Pred / Data 0.5 1 1.5
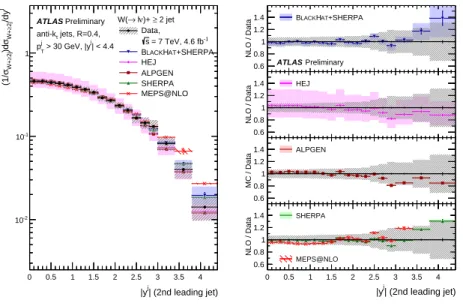
Figure 3: Distribution of events passing the
W+ jets selection as a function of the leading jet rapidity for the electron (left) and muon (right) channels. On the data points, the statistical uncertainties are shown by the vertical bars and systematic uncertainties, described in Sect. 6, are shown by the hashed bands.
The lower figure shows ratios of the total predictions with either ALPGEN or SHERPA to the data.
The systematic uncertainties are shown by the yellow band and the combined statistical and systematic uncertainties are shown by the green band.
[GeV]
HT
200 400 600 800 1000 1200 1400 1600 1800 2000
Events / GeV
10-2
10-1
1 10 102
103
104
105
106
107 Data, s = 7 TeV, 4.6 fb-1
(ALPGEN) ν
→ e W
t t Other
→ ee Z Multijets
(SHERPA) ν
→ e W Pred sys
⊗stat Pred sys
Preliminary ATLAS
[GeV]
HT
200 400 600 800 1000 1200 1400 1600 1800 2000 Pred / Data 0.5
1 1.5
[GeV]
HT
200 400 600 800 1000 1200 1400 1600 1800 2000
Events / GeV
10-2
10-1
1 10 102
103
104
105
106
107 Data, s = 7 TeV, 4.6 fb-1
(ALPGEN) ν µ
→ W
t t Other
µ µ
→ Z Multijets
(SHERPA) ν µ
→ W Pred sys
⊗stat Pred sys
Preliminary ATLAS
[GeV]
HT
200 400 600 800 1000 1200 1400 1600 1800 2000 Pred / Data 0.5
1 1.5
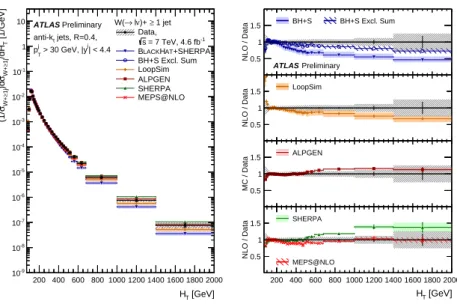
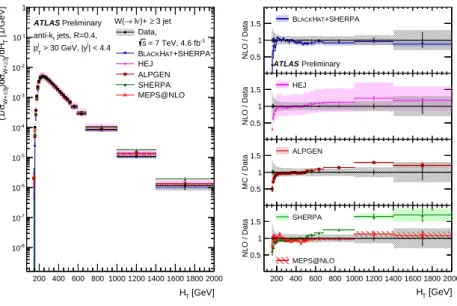
Figure 4: Distribution of events passing the
W+ jets selection as a function of the the scalar sum of all
identified objects in the final state,
HTfor the electron (left) and muon (right) channels. On the data
points, the statistical uncertainties are shown by the vertical bars and systematic uncertainties, described
in Sect. 6, are shown by the hashed bands. The lower figure shows ratios of the total predictions with
either ALPGEN or SHERPA to the data. The systematic uncertainties are shown by the yellow band and
the combined statistical and systematic uncertainties are shown by the green band.
N
jet 0 1 2 3 4 5 6 7
W→eνW→eν
94% 78% 74% 59% 37% 24% 14% 11%
Multijet 4% 11% 12% 11% 7% 6% 5% 4%
t¯t <
1%
<1% 3% 18% 46% 63% 77% 81%
Single top
<1%
<1% 1% 2% 2% 2% 1% 1%
W→τν, diboson
2% 3% 3% 3% 2% 1% 1% 1%
Z→ee <
1% 8% 7% 7% 5% 4% 3% 3%
Total Predicted 11 100 000 1 510 000 352 000 88 300 27 700 8420 2510 567
±
640 000
±99 000
±23 000
±5600
±1400
±430
±200
±61 Data Observed 10 878 398 1 548 000 361 957 91 212 28 076 8514 2358 618
W →µν
W →µν
93% 82% 79% 63% 40% 26% 17% 11%
Multijet 2% 11% 10% 10% 7% 5% 4% 3%
t¯t <
1%
<1% 3% 20% 47% 65% 76% 84%
Single top
<1%
<1% 1% 2% 2% 2% 1% 1%
W→τν, diboson
2% 3% 3% 3% 2% 1% 1%
<1%Z →µµ
3% 4% 3% 3% 2% 1% 1% 1%
Total Predicted 13 300 000 1 700 000 383 000 95 400 29 600 8860 2370 622
±
770 000
±100 000
±24 000
±5700
±1300
±420
±180
±66 Data Observed 13 414 400 1 758 239 403 146 99 749 30 400 9325 2637 663 Table 1: The approximate size of the signal and backgrounds, expressed as a fraction of the total number of predicted events. They are derived from either data-driven estimates or simulations for exclusive jet multiplicities for the
W → eνselection (upper table) and for the
W → µνselection (lower table). The total numbers of predicted and observed events are also shown.
the fiducial phase space, defined in Table 2. In this definition, the lepton kinematics in the simulation at particle level is based on final-state leptons from the boson decay including the contributions from the photons radiated by the decay lepton within a cone of
∆R =0.1 around its direction (“dressed”
leptons). The
EmissTis determined from the neutrino from the decay of the
Wboson. Particle-level jets are defined using an anti-k
talgorithm with a radius parameter of
R =0.4,
pT >30 GeV and
|y| <4.4.
All jets within
∆R=0.5 of an electron or muon are removed. Final state particles with a lifetime longer than 30 ps, either produced directly in the proton–proton collision or from the decay of particles with shorter lifetimes, are included in the particle-level jet reconstruction. Neutrinos, electrons, and muons from decays of the
Wboson as well as any photon included in the dressed lepton are not used for the jet finding.
The correction procedure is based on samples of simulated events and corrects for jet and
Wselection
efficiencies and resolution effects. The correction is implemented using an iterative Bayesian method
of unfolding [46]. Simulated events are used to generate for each distribution a response matrix to
account for bin-to-bin migration e
ffects between the reconstructed and particle-level distributions. The
particle-level prediction from ALPGEN is used as initial prior to determine a first estimation of the
unfolded data distribution. For each further iteration the estimator for the unfolded distribution from the
previous iteration is used as a new input prior. The bin sizes in each distribution are chosen to be a few
Electron Channel Muon Channel Combined
Lepton
pT pT >25 GeV
pT>25 GeV
pT>25 GeV
Lepton rapidity
|η|<2.47 (excluding 1.37
<|η|<1.52)
|η|<2.4
|η|<2.5
W→`νcriteria
Z
veto exactly one lepton
Missing transverse momentum
EmissT >25 GeV
Transverse mass
mT>40 GeV
Jet criteria
Jet
pT pT>30 GeV
Jet rapidity
|y|<4.4
Jet isolation
∆R(`,jet)
>0.5 (jet is removed)
Table 2: Kinematic criteria defining the fiducial phase space at particle level for the
W→eνand
W→µνchannels as well as the combination. The
W → `νand jet criteria are applied to the electron and muon channels as well as the combination.
times larger than the resolution of the corresponding variable. The ALPGEN
W+ jets samples provide a satisfactory description of distributions in data and are employed to perform the correction procedure.
The number of iterations was optimised to find a balance between too many iterations, causing high statistical uncertainties associated with the unfolded spectra, and too few iterations, which increases the dependency on the Monte Carlo prior. The optimal number of iterations is typically between one and three, depending on the observable. Since the di
fferences in the unfolded results are negligible over this range of iterations, two iterations have been consistently used for unfolding each observable.
The unfolded cross sections measured in the electron and muon channels are then extrapolated to a common phase-space region, defined as a lepton with
pT >25 GeV and
|η| <2.5 and summarised in Table 2. The extrapolations to the common phase-space are performed using bin-by-bin correction factors, derived from ALPGEN
W+ jets simulated samples described in Sect. 3 but reweighted to the CT10 PDF set, which is an NLO PDF set. The correction factors are approximately 0.93 and 0.96 for the electron and muon channel respectively. The extrapolated cross sections measured in the electron and muon channels are in agreement for all observables considered.
The measured
Wproduction di
fferential cross sections in association with jets in the electron and muon channels are combined by averaging using a statistical method that accounts for correlations be- tween the sources of systematic uncertainties affecting each channel. Correlations between bins for a given channel are also accounted for. The method of combination used is an averaging procedure de- scribed in Refs. [47, 48]. Each distribution is combined separately by minimising a
χ2function. After correction for detector effects, data are compared with predicted cross-sections multiplied by the branch- ing ratio, Br(W
→`ν), where`=e, µ.The uncertainties on the modelling in the unfolding procedure, the luminosity, the background con-
tributions estimated from simulations and all the systematic uncertainties of the data-driven
t¯testimation
have been treated as correlated among bins and between channels. The lepton systematic uncertainties
and the systematic uncertainties on multijet backgrounds are assumed to be correlated between bins of
a given distribution, but independent between the two lepton channel measurements. The statistical un-
certainties of the data, the statistical uncertainty from the simulations used in the unfolding procedure,
and the statistical uncertainty from the
t¯tfit are treated as uncorrelated among bins and channels. For
technical reasons, the jet energy resolution uncertainty is taken within the combination procedure to be
(W
→eν)Incl.
Njets≥1
Njets≥2
Njets≥3
Njets≥4
Njets≥5
Njets≥6
Njets≥7
Electron 1.1 % 1.3 % 1.3 % 1.2 % 1.2 % 1.3 % 2.7 % 3.4 %
Jets 0.3 % 9 % 11 % 15 % 20 % 29 % 42 % 45 %
t¯t
backgrounds
<0.1% 0.2 % 1.0 % 4.8 % 13 % 39 % 100 % 90 %
Multijet backgrounds 0.5 % 1.5 % 2.1 % 2.1 % 5 % 15 % 25 % 25 %
EmissT
0.2 % 1.7 % 1.2 % 1.2 % 1.0 % 0.7 % 1.7 % 2.6 %
Unfolding 0.2 % 1.7 % 0.9 % 1.1 % 1.2 % 0.9 % 5 % 22 %
Luminosity 1.9 % 2.1 % 2.1 % 2.2 % 2.3 % 2.5 % 2.6 % 2.2 %
Total Syst. 2.3 % 10 % 12 % 16 % 25 % 50 % 110 % 110 %
(W
→µν)Muon 1.5 % 1.7 % 1.7 % 1.4 % 1.5 % 2.1 % 3.7 % 4.4 %
Jets 0.1 % 8 % 9 % 13 % 16 % 20 % 29 % 60 %
t¯t
backgrounds
<0.1 % 0.2 % 0.9 % 4.1 % 11 % 26 % 47 % 60 %
Multijet backgrounds 0.1 % 0.5 % 0.8 % 1.4 % 2.2 % 4.2 % 4.6 % 9 %
EmissT
0.3 % 1.0 % 0.9 % 1.0 % 1.0 % 0.6 % 0.9 % 1.1 %
Unfolding 0.2 % 1.7 % 0.9 % 1.0 % 1.2 % 1.3 % 2.6 % 11 %
Luminosity 1.9 % 2.0 % 2.0 % 2.1 % 2.1 % 2.1 % 2.0 % 2.0 %
Total Syst. 2.5 % 8 % 10 % 14 % 20 % 34 % 60 % 80 %
Table 3: Systematic uncertainties on the measured
W+ jets cross section in the electron and muon chan- nels as a function of the inclusive jet multiplicity in percent. The dominant jet uncertainty comes from the jet energy scale, the dominant electron uncertainties comes from the electron energy scale and iden- tification and the dominant muon uncertainty comes from the trigger.
uncorrelated among bins and channels. This choice has no significant impact on the overall uncertainties for the combination. Finally the uncertainties from the jet energy scale are treated as fully correlated between all bins and do not enter the combination procedure. The jet energy scale uncertainty on the combined result is taken as the weighted average of the corresponding uncertainties on the electron and muon measurements.
6 Systematic uncertainties
The dominant sources of systematic uncertainties in the cross-section measurements for both electron and muon channels are the uncertainties in the jet energy scale (JES) and at high jet multiplicities the uncertainties on the
t¯tbackground estimates.
Uncertainties in the JES are determined from a combination of methods based on simulations and in situ techniques [41] and are propagated through the analysis using 14 independent components, which are fully correlated in jet
pT. These components account for uncertainties on the di
fferent in situ mea- surements which form the jet calibration, on the jet flavour and on the impact of pile-up and close-by jets. The JES uncertainty varies as a function of jet
pTand
ηand is less than 2.5% in the central regions for jets with a
pTbetween 60 and 800 GeV. To estimate the impact of the JES uncertainty, jet energies in the simulated events are coherently shifted by the JES uncertainty and the
EmissTvector is recomputed.
The full analysis, including re-evaluation of the data-driven background estimates, is repeated with these
variations and the cross sections are recomputed; the change in the cross section is taken as the system-
atic uncertainty. This method of propagating the uncertainties is also used for most other uncertainties
described below. The impact of the JES uncertainties on the cross section for both channels ranges from
9% for
Njets ≥1 to 30% for
Njets ≥5. The uncertainty on the cross section due to the JES for the electron channel is larger because of changes in the
Z →eebackground which are also a
ffected by this uncertainty.
The uncertainty on the jet energy resolution (JER), derived from a comparison of the resolution obtained in data and in simulated dijet events, is propagated into the final cross section by smearing the energies of the simulated jets [49]. This uncertainty, which is approximately 10% of the jet energy resolution, results in a 5–20% uncertainty on the cross sections, increasing with the jet multiplicity.
The uncertainty on the electron and muon selections includes uncertainties on the electron energy or muon momentum scale and resolution, as well as uncertainties on the scale factors applied to the simu- lations in order to reproduce the electron or muon trigger, reconstruction and identification efficiencies measured in the data. While the energy or momentum scale corrections of the leptons have been ob- tained from a comparison of the
Zboson invariant mass distribution between data and simulations, the uncertainties on the scale factors have been derived from a comparison of tag-and-probe results in data and simulations [37, 50]. The overall uncertainty on the cross section is approximately 1–2%.
Due to energy clusters in the calorimeters which are not associated to a jet or electron, such as those coming from the underlying event, a residual uncertainty on the
EmissTis estimated by scaling the energies of these clusters [42]. The resulting uncertainty on the cross section is less than 2%.
An additional source of uncertainty is the potential bias in the control-sample selection from which multijet templates are extracted. The size of the effect is determined by varying the individual isolation requirements and in the electron channel varying the identification definition, both of which a
ffect the shape of the kinematic distributions of the control sample. To account for shape di
fferences in the low
EmissTregion, the nominal fit range for the multijet background is varied. The signal template is alterna- tively modelled by SHERPA instead of ALPGEN. In addition for the signal template the uncertainty in the NNLO
W/Zproduction cross sections is taken as 5% [51]. The statistical uncertainty on the template normalisation factor from the fit is also included. The resulting uncertainty on the cross section is 1–25%
dominated by uncertainties in the template shape.
The dominant uncertainty on the estimate of
t¯tbackground is the statistical uncertainty from the data- driven estimate, which is 6–15% on the number of
t¯tevents. To estimate the effect due to the subtraction of
W+heavy flavour contamination in the
t¯ttemplate, the
W+ccross section and the combined
W+cc¯ and
W+bb¯ cross sections are varied by factors of 1.3 and 0.9 respectively. These factors are obtained from fits to the data in two control regions, defined as one or two jets and at least one
b-tagged jet, where W+heavy flavour events dominate. This uncertainty, which is 3% of the number oft¯tevents for
Njets≥3, is largest at lower jet multiplicities, where the contribution from
W+heavy flavour is most significant.
Other small uncertainties include uncertainties on the
b-tagging efficiencies and uncertainties on the biason the
t¯tdistributions when applying
b-tagging. The total uncertainty on the cross section for Njets ≥4 due to the estimate of the
t¯tbackground is roughly 10%. For
Njets ≤2, where simulations are used to estimate the
t¯tbackground, the uncertainty on the
t¯tcross section is taken to be 6% as described in Ref. [52].
An uncertainty on the integrated luminosity of 1.8% [36] is applied to the signal normalisation as well as to all backgrounds which are estimated using simulations.
The uncertainty on the unfolding from the limited number of events in the simulations is estimated
using pseudo-data tests. The systematic uncertainties on the unfolding due to modelling in the simula-
tions are estimated by using an alternative set of ALPGEN samples with different parameter values; the
MLM matching procedure [53] used to remove the double counting between partons generated from the
matrix element calculation and partons from the parton shower uses a matching cone of size
R =0.4
for matrix element partons of
pT >20 GeV. To determine how the arbitrary choice of this cone size and
the matching
pTscale impacts the unfolded results, samples where these parameters are varied are used
in the unfolding procedure. In addition, to account for the impact of changing the amount of radiation
emitted from hard partons, Monte Carlo samples are generated with the renormalisation and factorisation scales set to half and twice their nominal value of
q
m2W+ pT2W
. The overall uncertainty on the unfolding procedure ranges between 0.2% and 1.7% over all jet multiplicities.
The systematic uncertainties on the cross section measurement after unfolding are summarised in Table 3 for both the electron and muon channels and all jet multiplicities. The resulting systematic uncertainties are symmetrised by taking the average value of the up and down variations.
7 Theoretical Predictions
Program Max. number of partons at Parton/Particle Distributions
approx. NNLO NLO LO level shown
(α
Nsjets+2) (α
Nsjets+1) (α
Nsjets)
LoopSim 1 2 3 parton level Leading jet
pTand
HTwith corrections for
W+
≥1 jet
BlackHat+SHERPA – 5 6 parton level All
with corrections
B
lackH
at+SHERPA 1 2 3 parton level Leading jet
pTand
HTexclusive sums with corrections for
W+
≥1 jet
HEJ all orders, resummation parton level All
for
W+
≥2, 3, 4 jets
MEPS@NLO – 2 4 particle level All
ALPGEN – – 5 particle level All
SHERPA – – 4 particle level All
Table 4: Summary of theoretical predictions, including the maximum number of partons at each order in
αs, whether or not the results are shown at parton or particle level and the distributions for which they are shown.
The measured cross sections for
W+ jets production are compared to a number of theoretical predic- tions at both LO and NLO in perturbative QCD, which are summarized in Table 4. The theory predictions have been computed in the same phase space in which the measurement has been performed, defined in Sect. 5.
The leading-order predictions shown here include ALPGEN, which is interfaced to HERWIG for
showering, SHERPA which implements its own parton showering model and HEJ [54], which provides
parton-level predictions for
W+
≥2 jets. ALPGEN and SHERPA use leading-order matrix element
information for predictions of
W +jets production and use the MLM [8] and CKKW [18] matching
schemes, respectively, in order to remove any double counting between the matrix element and parton
shower calculations. ALPGEN provides predictions with up to five additional partons from the matrix
element in the final state while SHERPA includes up to four partons. HEJ is a perturbative calculation
which gives an approximation to the hard-scattering matrix element for jet multiplicities of two or greater
and to all orders in
αs. The approximation becomes exact in the limit of large rapidity separation between
partons, also known as the high energy limit. The resulting formalism is incorporated in a fully-exclusive
Monte Carlo event generator, from which the predictions shown in this paper have been derived. The HEJ results are presented only at the parton level, as the relevant hadronisation corrections are not available.
NLO predictions at parton level are obtained from BlackHat+SHERPA, for inclusive
W+
≥ njets production, where
nranges from zero to five jets. The B
lackH
atprogram provides the virtual matrix element corrections while SHERPA calculates the tree-level diagrams and provides the phase space in- tegration. The BlackHat+SHERPA matrix elements are also used in the exclusive sums approach [55], in which NLO information from different jet multiplicities, in this case from
W +nand
W+
≥ n+ 1 jets
2, are utilised. Although not strictly rigorous
3, this approach allows for additional contributions to
W+
≥ njets cross sections from higher multiplicity final states than is possible with a normal inclusive prediction. Such contributions can be important when new sub-processes at higher jet multiplicities result in substantial contributions to the cross section. In practice, these contributions are most important for predictions involving
W+ ≥1 jets. By including such contributions, a better agreement between theory and data, as well as smaller theoretical uncertainties are obtained for several kinematic distributions [5].
NLO predictions at the particle level are obtained from MEPS@NLO [16, 17] which utilises the virtual matrix elements for
W+1 jet and
W+2 jets production determined from B
lackH
at, merged with leading-order matrix-element information from
Wwith up to four jets. Each final state is then matched to a parton shower and hadronised using SHERPA. MEPS@NLO represents a rigorous method to com- bine NLO
+LO matrix element information from a number of di
fferent jet multiplicities to produce a completely exclusive final state.
Although an NNLO calculation for the production of
W+ ≥1 jets is not yet available, the LoopSim technique [59] allows the merging of NLO samples of di
fferent jet multiplicities in order to obtain ap- proximate NNLO predictions. The LoopSim method makes use of existing virtual matrix elements in the merged samples (here the
W+1 jet and
W+2 jets virtual matrix elements from MCFM), and where not present, determines exactly the singular terms of the loop diagrams, which, by construction, match precisely the corresponding singular terms of the real diagrams with one extra parton. The approximate NNLO cross section di
ffers from the complete NNLO cross section only by the constant, i.e. non- logarithmic, NNLO terms. The method is expected to provide predictions close to true NNLO results when the cross sections are dominated by large contributions associated with new scattering topologies.
All predictions use CT10 PDF [19], except for ALPGEN, which uses CTEQ61L PDF. The PDF uncertainty is calculated using the error PDF information determined from the CT10 eigenvectors. As the error PDF for CT10 correspond to a 90% confidence level, the resulting uncertainty is scaled down by a factor of 1.645 in order to obtain a one-sigma uncertainty. The uncertainty due to the value of
αs(m
Z) is determined by varying the value of
αs(m
Z) by
±0.0012 around the central value of 0.118 [60].The sensitivity of the theory predictions to higher-order corrections is determined by independently varying the renormalisation and factorisation scales by a factor of two around the central value of
HT/2,making sure that the renormalisation and factorisation scales do not di
ffer from each other by more than a factor of two.
In the following comparisons, the B
lackH
at+SHERPA and exclusive sums predictions have uncer-tainty bands determined by varying the renormalisation and factorisation scales, added in quadrature with the 68% confidence level uncertainties of the CT10 PDF error set, the
αs(m
Z) uncertainty and the uncer- tainties from the non-perturbative corrections described below. At low transverse momenta, the PDF+
αsuncertainties and the scale uncertainties are of the same size, with the scale uncertainties increasing in importance as the transverse momentum of the observable increases. The LoopSim predictions have
2An inclusive NLO prediction forW+≥1 jet production explicitly includes (leading-order) corrections fromW+≥2 jets, and implicitly, through DGLAP evolution [56–58], the effects of additional (collinear) gluon radiation. So in this sense, the calculation includes the effects of additional jets beyond the two included explicitly from the matrix element information.
3For example, only the term of orderαsin the strong coupling expansion of the Sudakov form factor expression is used.
For a formalism such as MEPS@NLO, as introduced later in the text, the full Sudakov suppression for all jet multiplicities is present.