ATLAS-CONF-2013-013 06/03/2013
ATLAS NOTE
ATLAS-CONF-2013-013
March 6, 2013
Measurements of the properties of the Higgs-like boson in the four lepton decay channel with the ATLAS detector
using 25 fb
−1of proton-proton collision data
The ATLAS Collaboration
Abstract
This note presents an update of the search results and property measurements of the ob- served Higgs-like boson in the decay channelH→ZZ(∗)→`+`−`0+`0−, where`, `0 =eorµ, using proton-proton collision data corresponding to integrated luminosities of 4.6 fb−1and 20.7 fb−1at √
s=7 TeV and √
s=8 TeV, respectively, recorded with the ATLAS detector at the LHC. A clear excess of events over the background is observed atmH=124.3 GeV in the combined analysis of the two datasets with a significance of 6.6 standard deviations, corre- sponding to a background fluctuation probability of 2.7×10⁻¹¹. The mass of the Higgs-like boson is measured to be mH = 124.3+0.6−0.5(stat)+0.5−0.3(syst) GeV, and the signal strength (the ratio of the observed cross section to the expected SM cross section) at this mass is found to beµ = 1.7+0.5−0.4. A study of Higgs boson production mechanisms allows a first measure- ment of couplings with this channel. A spin-parity analysis is performed on the events with reconstructed four-lepton invariant mass m4` satisfying 115 GeV < m4` < 130 GeV. The Higgs-like boson is found to be compatible with the SM expectation of 0+when compared pair-wise with 0−, 1+, 1−, 2+, and 2−. The 0− and 1+ states are excluded at the 97.8%
confidence level or higher using CLSin favour of 0+.
c Copyright 2013 CERN for the benefit of the ATLAS Collaboration.
Reproduction of this article or parts of it is allowed as specified in the CC-BY-3.0 license.
1 Introduction
In the context of the Standard Model (SM) the Brout-Englert-Higgs (BEH) mechanism is the source of electroweak symmetry breaking and results in the appearance of the Higgs boson [1–3]. Recently the ATLAS and CMS experiments have reported the observation of a new particle in the search for the SM Higgs boson [4, 5], where the most sensitive channels are H → ZZ(∗) → 4`, H → γγ, and H→WW(∗) →eνµν. An important step in the confirmation of the new particle as the SM Higgs boson is the measurement of its properties. The SM makes precise predictions for the couplings of the Higgs boson to all other known particles which influence the production and decay rates of the Higgs boson.
Furthermore, the SM Higgs boson is predicted to be a scalar particle (spin 0) with even parity.
The search for the SM Higgs boson through the decayH→ZZ(∗) →4`, where`=eorµ, provides good sensitivity over a wide mass range. Four distinct final states, µ+µ−µ+µ− (4µ),µ+µ−e+e−(2µ2e), e+e−µ+µ− (2e2µ), and e+e−e+e− (4e), are selected. The 2µ2e and 2e2µmodes differ by the flavor of the lepton pair having a reconstructed invariant mass closest to the Z mass. The largest background in this search comes from continuum (Z(∗)/γ∗)(Z(∗)/γ∗) production which includes the single resonance Z → 4`, referred to as ZZ(∗) hereafter. For four-lepton masses below around 160 GeV, there are also important background contributions fromZ+jets andtt¯production, where the additional charged lepton candidates arise either from decays of hadrons withb- orc-quark content, from photon conversions or from mis-identification of jets.
The analysis presented concentrates on the properties of the new particle seen in the four-lepton final state. The self coupling of the Higgs boson is a free parameter in the SM, thus its mass is not constrained. An inclusive analysis is dominated by the production of the H → ZZ(∗) → 4`final state in the gluon-gluon fusion (ggF) mode. Searching for Higgs boson production in the vector-boson fusion (VBF) and the vector-boson associated production (VH) modes allows further exploration of the coupling structure of the new particle. The Landau-Yang theorem forbids the decay of spin-1 particles into a pair of photons [6, 7]. The spin-1 hypothesis is therefore strongly disfavoured by the observed decays of the new particle into two photons. In addition, this observation implies that the charge conjugation is even.
This analysis also probes the spin and parity (JP) using theH→ZZ(∗)→4`decay, through the observed distributions of the twoZ(∗) boson masses, one production angle and four decay angles. The JP states explored are spin 0, 1, and 2 with even and odd parity.
This note updates the results presented in Ref. [8]. It includes a re-analysis of the √
s = 7 TeV data corresponding to an integrated luminosity of 4.6 fb−1collected in 2011, combined with an analysis of
√s = 8 TeV data corresponding to an integrated luminosity of 20.7 fb−1, the full data sample collected in 2012 (increased from 13.0 fb−1 used for Ref. [8]). The analysis remains largely the same as the one described previously [8] with only a few changes introduced. The electron identification has been tightened further to improve the background rejection for the final states with a pair of electrons forming the lower massZ∗ boson, only for √
s = 8 TeV data. The mass measurement uses a constrained fit to the Z mass to improve the resolution. The lepton pairing has been changed to reduce the mis-pairing in the 4µand 4e final states. This reduces theZZ(∗) background at low mass, increases the sensitivity of the spin measurements and improves theZ-mass constraint. The minimum requirement on the mass of the secondZhas been relaxed to improve the sensitivity. A treatment for the inclusion of final state radiation (FSR) in the case of reconstructed muons has been introduced. The spin measurement has also been extended to include both spin-1 parity states, and for the spin-2 measurements the possible mixture of gluon fusion and quark-quark production mechanisms is explored. Finally, a categorisation which separates the Higgs boson candidates into ggF-like, VBF-like and VH-like is introduced.
In the following, the ATLAS detector is briefly described in Section 2, and the signal and background simulation is presented in Section 3. The analysis of the √
s =8 TeV data collected in 2012 and that of the √
s = 7 TeV data collected in 2011 is described in Section 4. After a description of the systematic
uncertainties in Section 5, Section 6 presents the result of the combined analysis of the two data sets.
Finally, the analysis of spin and parity and its results are described in Section 7.
2 The ATLAS Detector
The ATLAS detector [9] is a multi-purpose particle physics detector with forward-backward symmetric cylindrical geometry1. The inner tracking detector (ID) covers|η| < 2.5 and consists of a silicon pixel detector, a silicon micro-strip detector, and a transition radiation tracker (TRT). The ID is surrounded by a thin superconducting solenoid providing a 2 T axial magnetic field. A high-granularity lead/liquid- argon (LAr) sampling calorimeter measures the energy and the position of electromagnetic showers within |η| < 3.2. LAr sampling calorimeters are also used to measure hadronic showers in the end- cap (1.5 < |η| < 3.2) and forward (3.1 < |η| < 4.9) regions, while an iron/scintillator tile calorimeter measures hadronic showers in the central region (|η|<1.7). The muon spectrometer (MS) surrounds the calorimeters and consists of three large superconducting air-core toroid magnets, each with eight coils, a system of precision tracking chambers (|η| < 2.7), and fast trigger chambers. A three-level trigger system [10] selects events to be recorded for offline analysis.
3 Signal and Background Simulation
The H→ZZ(∗) →4`signal is modelled using the PMonte Carlo (MC) event generator [11, 12], which calculates separately the gluon fusion (ggF) and vector-boson fusion (VBF) production mecha- nisms with matrix elements up to next-to-leading order (NLO). The description of the Higgs boson trans- verse momentum (pT) spectrum in the ggF process follows the calculation of Ref. [13], which includes QCD corrections up to NLO and QCD soft-gluon re-summations up to next-to-next-to-leading logarithm (NNLL). The effects of finite quark masses are also taken into account [14]. ThepTre-weighting of the ggF process is applied at the analysis level to simulated events for the 2011 MC samples, but is included in the event generation for the 2012 MC samples. Pis interfaced to P[15, 16] for showering and hadronization, which in turn is interfaced to P [17, 18] for quantum electrodynamics (QED) radiative corrections in the final state. Pis used to simulate the production of a Higgs boson in association with aWor aZboson (VH) and with att¯pair (ttH).¯
The Higgs boson production cross sections and decay branching ratios, as well as their uncertain- ties, are taken from Refs. [19, 20]. The cross sections for the ggF process have been calculated to NLO [21–23], and next-to-next-to-leading order (NNLO) [24–26] in QCD. In addition, QCD soft-gluon re-summations calculated in the NNLL approximation are applied for the ggF process [27]. NLO elec- troweak (EW) radiative corrections are also applied [28,29]. These results are compiled in Refs. [30–32]
assuming factorisation between QCD and EW corrections. The cross sections for VBF processes are calculated with full NLO QCD and EW corrections [33–35], and approximate NNLO QCD corrections are available [36]. The cross sections for the associatedWH/ZHproduction processes are calculated at NLO [37] and at NNLO [38] in QCD, and NLO EW radiative corrections [39] are applied. The cross sections for associated Higgs boson production with att¯pair are calculated at NLO QCD [40–43].
The Higgs boson decay branching ratios [44] to the different four-lepton final states are provided by P4[45, 46], which includes the complete NLO QCD+EW corrections and interference effects between identical final-state fermions. Table 1 gives the production cross sections and branching ratios forH→ZZ(∗)→4`, which are used to normalise the signal MC, for several Higgs boson masses.
1The ATLAS experiment uses a right-handed coordinate system with its origin at the nominal interaction point. Thez-axis is along the beam pipe, thex-axis points to the centre of the LHC ring and they-axis is defined as pointing upwards. Polar coordinates (r,φ) are used in the transverse plane,φbeing the azimuthal angle around the beam pipe. The pseudo-rapidityηis defined asη=−ln[tan(θ/2)] whereθis the polar angle.
The QCD scale uncertainties formH=125 GeV [19] amount to+7−8% for the ggF process,±1% to±2%
for the VBF and associated WH/ZH production processes and +4−9% for the associated ttH¯ production process. The uncertainty on the production cross section due to uncertainties on the parton distribution function (PDF) and the strong coupling constantαs is±8% for gluon-initiated processes and±4% for quark-initiated processes, estimated by following the prescription in Ref. [47] and by using the PDF sets of CTEQ [48], MSTW [49] and NNPDF [50]. The PDF uncertainties are assumed to be 100% correlated among processes with identical initial states, regardless of these being signal or background [51].
For the heavy Higgs boson line-shape, the complex-pole-scheme (CPS) [20] has been used for cross sections for ggF and VBF processes. The corresponding line-shape uncertainty is estimated using the techniques described in Ref. [52].
Table 1: Higgs boson production cross sections for ggF, VBF (qq0→Hqq0) and associated production with a W or Z boson or a tt¯pair in pp collisions at √
s = 8 TeV and √
s = 7 TeV [19]. The quoted uncertainties correspond to the total theoretical systematic uncertainties with a linear sum of QCD scale and PDF+αs uncertainties. The production cross section for the associated production with aW orZ boson or att¯pair is negligibly small formH >300 GeV. The decay branching ratio forH→ZZ(∗)→4`, with`=eorµ, is reported in the last column [19]. Negligible cross sections are noted as “−” .
mH σ(gg→H) σ(qq0→Hqq0) σ(q¯q→WH) σ(q¯q→ZH) σ(q¯q/gg→t¯tH) BR (H→ZZ(∗)→4`)
[ GeV] [pb] [pb] [pb] [pb] [pb] [10−3]
√s=8 TeV
123 20.2±3.0 1.61±0.05 0.73±0.03 0.42±0.02 0.14±0.02 0.103
125 19.5±2.9 1.58+0.04−0.05 0.70±0.03 0.39±0.02 0.13±0.02 0.125 127 18.9±2.8 1.55±0.05 0.66+0.02−0.03 0.37±0.02 0.12+0.01−0.02 0.148 300 3.61+0.48−0.50 0.44±0.01 0.026±0.001 0.015±0.001 0.008+0.01−0.02 1.38
600 0.52+0.08−0.07 0.097±0.004 − − − 1.23
√s=7 TeV
123 15.8+2.3−2.4 1.25±0.03 0.60+0.02−0.03 0.33±0.02 0.09+0.01−0.02 0.103 125 15.3±2.3 1.22±0.03 0.57±0.02 0.32±0.02 0.09+0.01−0.02 0.125
127 14.9±2.2 1.20±0.03 0.54±0.02 0.30±0.02 0.08±0.01 0.148
300 2.62+0.36−0.37 0.34+0.02−0.01 0.020±0.001 0.012±0.001 0.005±0.01 1.38
600 0.34+0.06−0.05 0.062+0.005−0.002 − − − 1.23
The ZZ(∗) continuum background is modelled using P[53] for quark-antiquark annihilation andgg2ZZ[54] for gluon-gluon contributions, normalised to the MCFM prediction [55]. TheZZ(∗)qq0 continuum background is modelled using S[56]. The QCD scale uncertainty has a±5% effect on the expectedZZ(∗)background, and the effect due to the PDF andαsuncertainties is±4% (±8%) for quark-initiated (gluon-initiated) processes. In addition, the shape uncertainty on the four-lepton invariant mass spectrum has been assigned as discussed in Ref. [20]. T[57,58] is used for the simulation ofτ lepton decays which come from both signal and backgroundZdecays. TheZ+jets production is modelled using A [59] and is divided into two sources: Z+light jets, which includesZcc¯in the masslessc- quark approximation andZbb¯ withbb¯ from parton showers, andZbb¯ using matrix element calculations that take into account theb-quark mass. The MLM [60] matching scheme is used to remove any double counting of identical jets produced via the matrix element calculation and the parton shower, but this scheme is not implemented forb-jets. Therefore,bb¯ pairs with separation∆R=
q
(∆φ)2+(∆η)2 > 0.4 between theb-quarks are taken from the matrix-element calculation, whereas for∆R < 0.4 the parton- showerbb¯ pairs are used. In this search theZ+jets background is normalised using control samples from data. For comparison between data and simulation, the QCD NNLO FEWZ [61, 62] and MCFM cross
section calculations are used for inclusiveZboson andZbb¯ production, respectively. Thet¯tbackground is modelled using MC@NLO [63] and is normalised to the approximate NNLO cross section calculated using H[64]. The effect of the QCD scale uncertainty on the cross section is+4−9%, while the effect of PDF and αs uncertainties is ±7%. Both A and MC@NLO are interfaced to H [65] for parton shower hadronization and to J[66] for the underlying event simulation. Finally, the WZ background for some control regions is modelled using P[15, 16].
Generated events are fully simulated using the ATLAS detector simulation [67] within the G4 framework [68]. Additional ppinteractions in the same and nearby bunch crossings (pile-up) are in- cluded in the simulation. The MC samples are re-weighted to reproduce the observed distribution of the mean number of interactions per bunch crossing in the data.
For the spin and parity analysis discussed in Section 7, the JHU [69] leading-order generator is used to simulate the decay of a Higgs boson with a mass of 125 GeV. JHU allows the generation of the various spin and parity combinations whereas P can only generate the SM 0+ hypothesis.
The JHU generator is interfaced to the PMC generator for the parton showers, using the PDF set CTEQ6L1 [48] with the ATLAS underlying event tune [70,71]. The JHU simulation has been found to be in good agreement with Pin the case of 0+for the variables relevant to the spin and parity analysis.
The JHU generatedpTspectrum is slightly harder than the one for Pfor ggF production. In order to avoid a bias on the event selection efficiency from this, the JHU Higgs bosonpTspectrum is re-weighted to that of Pat the fully simulated event level for ggF production. This re-weighting is found to have no effect on the expected separation of the spin and parity states. Forqq s-channel production, which¯ is studied for the case of spin 2, no re-weighting has been done since no better prediction is currently available.
4 Signal and Background Analysis
The data are subjected to quality requirements: events recorded during periods when the relevant detector components were not operating normally are rejected. These requirements are applied independently of the lepton final state. The resulting integrated luminosity is 20.7 fb−1 for 2012 data at √
s = 8 TeV and 4.6 fb−1for 2011 data at √
s=7 TeV for all final states.
4.1 Lepton and event selection
The data considered in this analysis are selected using single-lepton or di-lepton triggers. In 2012 for the single-muon trigger the transverse momentum, pT, threshold is 24 GeV, while for the single-electron trigger the transverse energy,ET, threshold is 25 GeV. For the di-muon triggers the thresholds are either pT = 13 GeV for each muon or pT1 = 18 GeV, pT2 = 8 GeV in the case of the asymmetric di-muon trigger. For the di-electron triggers the thresholds are ET = 12 GeV for both electrons. Finally, there are two electron-muon triggers used with 12 or 24 GeVETelectron thresholds, differing in their electron identification requirements, and an 8 GeV pT muon threshold. In 2011, for the single-muon trigger the pTthreshold is 18 GeV, while for the single-electron trigger theET threshold is 20−22 GeV depending on the LHC data-taking period. For the di-muon and di-electron triggers the thresholds are pT=10 GeV for each muon, and ET = 12 GeV for each electron. Finally, there is an electron-muon trigger with an 6 GeV pT muon threshold and an 10 GeV ET electron threshold. The efficiency for events passing the offline selection to be selected by at least one of the above triggers is greater than 97% for events with muons and around 100% for four electron events.
Electron candidates consist of clusters of energy deposited in the electromagnetic calorimeter asso- ciated with ID tracks [72]. All candidate electron tracks are fitted using a Gaussian-Sum Filter [73] to account for bremsstrahlung energy losses. This improves the measured electron direction and thus the
impact parameter resolution. For the 2012 data set, the ATLAS track pattern recognition has been mod- ified to allow for bremsstrahlung energy losses and the track-to-cluster matching algorithm was revised in order to benefit from these improvements. The clusters matched to a track are required to satisfy a set of identification criteria that require the longitudinal and transverse shower profiles to be consistent with those expected for electromagnetic showers. The electron transverse momentum is computed from the cluster energy and the track direction at the interaction point. Finally, for the present analysis some of the identification criteria have become stricter than the original optimisation at the beginning of 2012.
Specifically, the electron calorimeter requirements have been further tightened in the transition region between the barrel and endcap electromagnetic calorimeters (1.37 < |η| < 1.52), and the pixel tracking requirements became stricter to improve photon conversion rejection. These tighter requirements are applied to all 2012 data. For the 2011 data set, the electron reconstruction proceeds as described above, but without the improved pattern recognition and cluster-to-track matching. The electron identification used for the 2011 data set is similar to that used in the previous ATLAS publication [74].
Muon candidates are formed by matching reconstructed ID tracks with either complete or partial tracks reconstructed in the MS [75]. If a complete track is present, the two independent momentum measurements are combined; otherwise the momentum is measured using the ID. The muon recon- struction and identification coverage is extended by using tracks reconstructed in the forward region (2.5 < |η| < 2.7) of the MS, which is outside the ID coverage. In the centre of the barrel region (|η|<0.1), which lacks MS geometrical coverage, ID tracks withpT >15 GeV are identified as muons if their calorimetric energy deposits are consistent with a minimum ionising particle. Only one muon per event is allowed which is reconstructed only in the MS or identified with the calorimeter.
This analysis searches for Higgs boson candidates by selecting two same-flavour, opposite-sign lep- ton pairs (a lepton quadruplet) in an event. The impact parameter of each lepton along the beam axis is required to be within 10 mm of the reconstructed primary vertex but this cut is not applied for muons in the forward region without an ID track. To reject cosmic rays, muons with an ID track are required to have a transverse impact parameter, defined as the impact parameter in the bending plane with respect to the primary vertex, of less than 1 mm. The primary vertex is defined as the reconstructed vertex with the highestP
p2Tof associated tracks among the reconstructed vertices with at least three associated tracks.
Each electron (muon) must satisfyET>7 GeV (pT>6 GeV) and be measured in the pseudo-rapidity range|η|< 2.47 (|η| <2.7). The highest pT lepton in the quadruplet must satisfypT >20 GeV, and the second (third) lepton in pTorder must satisfy pT > 15 GeV (pT > 10 GeV). The leptons are required to be separated from each other by∆R> 0.1 if they are of the same flavour and∆R>0.2 otherwise. Each event is required to have the triggering lepton(s) correctly matched to one or two of the selected leptons.
Multiple quadruplets within a single event are possible: for four muons or electrons there two ways to pair the masses, and for five or more leptons there are multiple ways to choose the leptons. Only quadruplets with the same-flavour and opposite-sign lepton pair closest to theZ boson mass are kept.
The pair with the mass closest to theZboson mass is referred to as the leading di-lepton and its invariant mass,m12, is required to be between 50 and 106 GeV. The remaining same-flavour, opposite-sign lepton pair is the sub-leading di-lepton and its invariant mass,m34, is required to be in the rangemmin< m34<
115 GeV, where mmin is 12 GeV form4` <140 GeV and rises linearly to 50 GeV at m4` = 190 GeV. It stays at 50 GeV for m4` > 190 GeV. TheZ boson corresponding to the leading (sub-leading) di-lepton pair is labelledZ1(Z2). The previous analyses of Refs. [4, 8] retained events where the pairing withm12 closest to theZboson mass does not have anm34passing the mass requirements but the event has another pairing with bothm12 andm34passing the requirements. The present approach reduces the mis-pairing in the 4e and 4µmodes to below 10% from around 20% previously. All possible same-flavour opposite- charge di-lepton combinations in the quadruplet must satisfym`` > 5 GeV to remove events containing J/ψ →``. If two or more quadruplets satisfy the above selection, the one with them34value closest to theZ boson mass is selected. Four different analysis sub-channels: 4e, 2e2µ, 2µ2e, 4µ, ordered by the
flavour of the leading di-lepton are defined.
The Z + jets and tt¯ background contributions are further reduced by applying impact parameter requirements as well as track- and calorimeter-based isolation requirements on the leptons. The im- pact parameter significance, defined as the impact parameter divided by its uncertainty,|d0|/σd0, for all muons (electrons) is required to be lower than 3.5 (6.5). The electron impact parameter is affected by bremsstrahlung and thus it has a broader distribution.
The normalised track isolation discriminant is defined as the sum of the transverse momenta of tracks, ΣpT, inside a cone of∆R< 0.2 around the lepton, excluding the lepton track, divided by the leptonET. The tracks considered in the sum must come from the primary vertex and be of good quality; i.e. they must have at least four hits in the pixel and silicon strip detectors (“silicon hits”), and pT > 1 GeV for muon isolation, and at least nine silicon hits, one hit in the innermost pixel layer (theb-layer), and pT > 0.4 GeV for electron isolation in 2012. For the 2011 electron track isolation, tracks are required to have at least seven silicon hits, one b-layer hit, and pT > 1 GeV. Each lepton is required to have a normalised track isolation smaller than 0.15.
The normalised 2012 calorimetric isolation for electrons is computed as the sum of the positive- energy topological clusters [76] in the electromagnetic and hadronic calorimeter with a reconstructed barycentre falling in a cone of∆R<0.2 around the candidate electron cluster, divided by the electronET. The cut value is 0.2. The cells within 0.125×0.175 inη×φaround the electron barycentre are excluded.
The algorithm for topological clusters suppresses noise by keeping only those cells with a significant energy deposit and their neighbouring cells. The ambient energy deposition in the event from pileup as well as from the underlying event is removed event-by-event by calculating the transverse energy density from low-pT jets, averaged over azimuth in twoηregions, and subtracting it from the isolation cone transverse energy. The 2011 calorimeter isolation of electrons is cell-based (electromagnetic and hadronic calorimeter) rather than topological cluster based, and the calorimeter isolation normalised to the electron ET cut is 0.3 instead of 0.2. In the case of muons, the normalised calorimetric isolation discriminant is defined as the sum of the calorimeter cells, ΣET, above > 3.4σnoise inside a cone of
∆R< 0.2 around the muon direction, divided by the muonpT. Muons are required to have a normalised calorimetric isolation less than 0.3 (0.15 in case of muons without an ID track). For both the track- and calorimeter-based isolation any contributions arising from other leptons of the quadruplet are subtracted.
The effect on the reconstructed invariant mass due to photon emission from final state radiation (FSR) is modelled by the MC. All di-muonZ1candidates with 66 GeV<m12<89 GeV are corrected for FSR by including in the invariant mass any reconstructed photon withETabove 1 GeV lying close (∆R<0.08 to 0.15 depending onETγ) to one of the muon tracks, providing the correctedm12 satisfiesm12 <106 GeV.
This recovers 70% of the FSR photons within the selected fiducial region. About 85% of the corrected events have genuine FSR photons, with the remaining misidentified photons coming from pileup and muon ionisation. The MC predicts that 4% of all H → ZZ(∗) → 4µcandidate events should have this correction applied. Detailed studies for the reconstruction of FSR photons can be found in Ref. [77].
The combined 2012 signal reconstruction and selection efficiency formH = 125 GeV is 39% for the 4µchannel, 26% for the 2e2µ/2µ2echannel and 19% for the 4echannel, which changes from 37/23/20%
in Ref. [8]. The combined 2011 signal reconstruction and selection efficiency formH=125 GeV is 39%
for the 4µchannel, 21% for the 2e2µ/2µ2echannel and 15% for the 4echannel. The efficiency gain for the 4µchannel arises from the relaxedm34selection, while there is a smaller loss due to the new pairing.
The electron channels have some additional loss in 2012 at lowETdue to the tighter identification used.
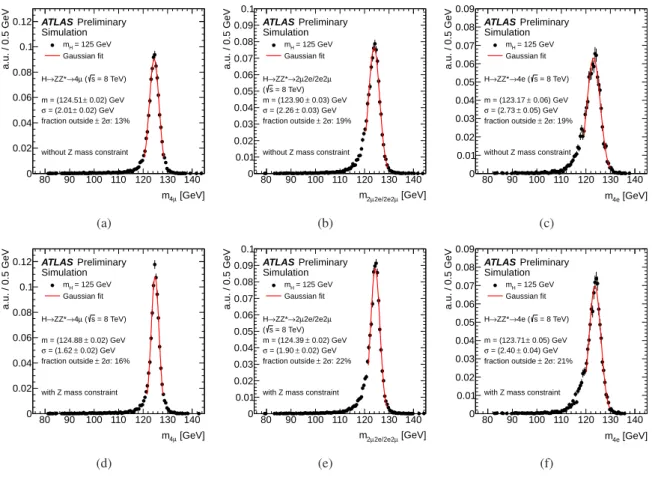
The final discriminating variable for this search is the four lepton invariant mass,m4`. The invari- ant mass resolution is improved by applying a Z-mass constraint to the leading di-lepton for m4` <
190 GeVand to both di-leptons for higher masses. TheZline-shape and the experimental uncertainty in the di-lepton mass are accounted for in theZ-mass constraint. Figure 1 presents them4` distributions before and after applying theZ-mass constraint of a simulated signal sample for each of the final states
[GeV]
µ
m4
80 90 100 110 120 130 140
a.u. / 0.5 GeV
0 0.02 0.04 0.06 0.08 0.1 0.12
= 125 GeV mH Gaussian fit ATLAS Preliminary Simulation
= 8 TeV) s µ (
→4
→ZZ*
H
0.02) GeV
± m = (124.51
0.02) GeV
± = (2.01 σ
: 13%
σ
± 2 fraction outside
without Z mass constraint
(a)
[GeV]
µ 2e/2e2 µ
m2
80 90 100 110 120 130 140
a.u. / 0.5 GeV
0 0.01 0.02 0.03 0.04 0.05 0.06 0.07 0.08 0.09 0.1
= 125 GeV mH Gaussian fit ATLAS Preliminary Simulation
µ 2e/2e2 µ
→2
→ZZ*
H = 8 TeV) s (
0.03) GeV
± m = (123.90
0.03) GeV
± = (2.26 σ
: 19%
σ
± 2 fraction outside
without Z mass constraint
(b)
[GeV]
m4e
80 90 100 110 120 130 140
a.u. / 0.5 GeV
0 0.01 0.02 0.03 0.04 0.05 0.06 0.07 0.08 0.09
= 125 GeV mH Gaussian fit ATLAS Preliminary Simulation
= 8 TeV) s
→4e (
→ZZ*
H
0.06) GeV
± m = (123.17
0.05) GeV
± = (2.73 σ
: 19%
σ
± 2 fraction outside
without Z mass constraint
(c)
[GeV]
µ
m4
80 90 100 110 120 130 140
a.u. / 0.5 GeV
0 0.02 0.04 0.06 0.08 0.1 0.12
= 125 GeV mH Gaussian fit ATLAS Preliminary Simulation
= 8 TeV) s µ (
→4
→ZZ*
H
0.02) GeV
± m = (124.88
0.02) GeV
± = (1.62 σ
: 16%
σ
± 2 fraction outside
with Z mass constraint
(d)
[GeV]
µ 2e/2e2 µ
m2
80 90 100 110 120 130 140
a.u. / 0.5 GeV
0 0.01 0.02 0.03 0.04 0.05 0.06 0.07 0.08 0.09 0.1
= 125 GeV mH Gaussian fit ATLAS Preliminary Simulation
µ 2e/2e2 µ
→2
→ZZ*
H = 8 TeV) s (
0.02) GeV
± m = (124.39
0.02) GeV
± = (1.90 σ
: 22%
σ
± 2 fraction outside
with Z mass constraint
(e)
[GeV]
m4e
80 90 100 110 120 130 140
a.u. / 0.5 GeV
0 0.01 0.02 0.03 0.04 0.05 0.06 0.07 0.08 0.09
= 125 GeV mH Gaussian fit ATLAS Preliminary Simulation
= 8 TeV) s
→4e (
→ZZ*
H
0.05) GeV
± m = (123.71
0.04) GeV
± = (2.40 σ
: 21%
σ
± 2 fraction outside
with Z mass constraint
(f)
Figure 1: Invariant mass distributions for simulated (a)H →ZZ(∗)→4µ, (b)H→ZZ(∗) →2µ2e/2e2µ and (c)H →ZZ(∗) →4eevents formH = 125 GeV, at √
s= 8 TeV. The fitted range for the Gaussian is chosen to be:−2σto 2σ(−1.5σto 2.5σ) for the 4µ(2µ2e/2e2µ/4e) channel. The slightly reduced mean values arise from radiative losses which are more important for channels involving electrons [72]. In (d), (e) and (f) the corresponding results after applying theZ-mass constraint are shown.
(with 2e2µ/2µ2ecombined), withmH =125 GeV, at √
s= 8 TeV. The width of the reconstructed Higgs boson mass distribution is dominated by the experimental resolution formH <350 GeV, while for higher mHthe reconstructed width is dominated by the natural width of the Higgs boson. The predicted natural width of the Higgs boson is approximately 4 MeV (29 GeV) atmH=125 (400) GeV.
4.2 Jet selection and event categorisation
To separately measure the cross sections for the ggF, VBF, and VH production mechanisms, eachH→4`
candidate selected with the criteria described above is assigned to one of three categories (VBF-like, VH- like, or ggF-like), depending on its characteristics. The VBF-like category is defined by events with two high pT jets widely separated in rapidity. Jets are reconstructed from topological clusters using an anti- kt algorithm [78] with a distance parameter R = 0.4. Jets within the ID acceptance (η < 2.47) are required to have more than 50% of the sum of the scalar pTof their associated tracks coming from the primary vertex to reduce background from pile-up. The VBF kinematic requirements for jets arepT>25 (30) GeV for|η|<2.5 (2.5<|η|<4.5). The two highestpTjets are required to be separated by more than 3 units in pseudorapidity and have an invariant mass greater than 350 GeV. Events which do not satisfy the VBF-like criteria are considered for the VH-like category. Events are classified as VH-like if there is a lepton (e orµ), in addition to the four leptons forming the Higgs boson candidate, withpT >8 GeV
and satisfying the same lepton requirements. Events which are not classified as VBF-like or VH-like are assigned to the ggF-like category. Table 2 shows the expected yields of both Higgs boson andZZ(∗) background events in each category from each of the production mechanisms, for mH =125 GeV and 20.7 fb−1at √
s=8 TeV and 4.6 fb−1at √
s=7 TeV.
Table 2: The expected numbers of events in each category (ggF-like, VBF-like, VH-like), after all anal- ysis criteria are applied, for each signal production mechanism (ggF/t¯tH, VBF, VH) atmH =125 GeV and theZZ(∗)background, for 20.7 fb−1 at √
s = 8 TeV and 4.6 fb−1 at √
s = 7 TeV. The requirement m4` >100 GeV is applied.
category gg→H,qq/gg¯ →t¯tH qq0 →Hqq0 qq¯ →W/ZH ZZ(∗)
√s=8 TeV
ggF-like 13.5 0.79 0.65 320.4
VBF-like 0.28 0.43 0.01 3.58
VH-like 0.06 √ - 0.14 0.69
s=7 TeV
ggF-like 2.20 0.14 0.11 57.5
VBF-like 0.03 0.06 - 0.44
VH-like 0.01 - 0.03 0.25
4.3 Background estimation
The level of the irreducibleZZ(∗)background is estimated using MC simulation normalised to the theo- retical cross section, while the rate and composition of the reducible``+jets andtt¯background processes are evaluated with data-driven methods. The composition of the reducible backgrounds depends on the flavour of the sub-leading di-lepton pair and different approaches are taken for the``+µµand the``+ee final states. Section 4.3.1 and Section 4.3.2 discuss these two cases, respectively, and the yields for all reducible backgrounds in the signal region are summarised in Table 3. The background estimates follow closely the methods discussed in Ref. [4] and described in more detail in Ref. [79]. The present analysis includes some improved methods and more cross checks.
4.3.1 ``+µµbackground
The ``+µµreducible background arises fromt¯tandZ+jets, where the Z+jets component has both a heavy quarkZbb¯ part and another part fromπ/K in-flight decays. The number of background events fromtt¯andZ+jets is estimated from two control regions: one with an enhanced bb¯ contribution and π/Kin-flight decays suppressed, and the other with both components augmented.
The enhanced bb¯ control region is obtained by removing the isolation requirement from the sub- leading pair, and requiring at least one of the sub-leading leptons to fail the impact parameter significance requirement. This removes a large fraction of theZZ(∗) contribution, and allows both thet¯tand heavy quarkZ+jets backgrounds to be estimated simultaneously.
As shown in Fig. 2, them12distribution has a flattt¯component, fitted with a second order Chebychev polynomial, and a peak at the Z boson mass for the Z + jets component, fitted with a Breit-Wigner line-shape convoluted with a Crystal-Ball resolution function. The shapes used in the unbinned fit are obtained from MC and the resulting fit parameters are allowed to vary by 10% in the fit to the data. The number of events in the control region is then extrapolated to the signal region with a transfer factor which uses the efficiency of the impact parameter significance and isolation requirements obtained from
[GeV]
m12
50 60 70 80 90 100
Events/4 GeV
0 10 20 30 40 50 60
Data
fit t Z+jets and t
fit t tZZ Z+jets
t tWZ
Preliminary ATLAS
µ
-1 4 Ldt = 20.7 fb
∫
= 8 TeV:
s
(a)
[GeV]
m12
50 60 70 80 90 100
Events/4 GeV
0 5 10 15 20 25 30 35 40 45
Data
fit t Z+jets and t
fit t tZZ Z+jets
t tWZ
Preliminary ATLAS
µ
-1 2e2 Ldt = 20.7 fb
∫
= 8 TeV:
s
(b)
Figure 2: Distribution ofm12, for √
s=8 TeV, in the control region where the isolation requirements are not applied to the two sub-leading muons, and at least one of these muons is required to fail the impact parameter significance requirement. The fit used to obtain the yields fortt¯andZ+jets is presented in (a) for 4µand in (b) for 2e2µ. The MC expectations are given for ZZ,t¯t, WZ andZ+jets, with theZ+jets expectation rescaled by the fit to the data.
theZbb¯ MC. The MC description of the selection efficiency has been verified with data using a control region obtained by requiring a Z boson and exactly one extra muon. This Z boson is selected using the leading di-lepton requirements of this analysis for the two highest pT same-flavour opposite sign leptons. The systematic uncertainties on the extrapolation factors of around 10% are obtained from the comparison of the MC to thisZ+µcontrol sample. They are used to estimate the systematic uncertainties on the number of background events in the signal region.
Replacing the above requirement on the impact parameter with a corresponding one on the track isolation enhances theZbb¯ andtt¯backgrounds, still removes theZZ(∗)component and also preserves a possibleπ/K in-flight decay background. The residual number of events from aZ boson mass fit after removing the re-scaled Zbb¯ MC estimate previously obtained is interpreted as theπ/K in-flight decay contribution. Theπ/Kin-flight decay contributes around 20% to theZ+jets background estimate given in Table 3.
Thet¯tbackground is cross-checked using a control region defined by selecting events with ane±µ∓ di-lepton pair with an invariant mass between 50 and 106 GeV, accompanied by an opposite sign di- muon satisfying them34 selection. Events with aZ boson candidate decaying to a pair of electrons or muons in this mass range are excluded. Isolation and impact parameter requirements are applied only to the leptons of theeµpair. This gives an estimate consistent to the one described previously with them12 fit method.
4.3.2 ``+eebackground
A sample of reconstruction-level objects identified as electron candidates will contain true isolated elec- trons, electrons from heavy flavour semi-leptonic decays (Q), electrons from photon conversions (γ) or light jets mis-reconstructed as electrons and denoted as fake electrons (f). The different sources of back- ground electrons are separated into reconstruction categories which are electron-like (E), and fake-like
(F), using appropriate discriminating variables [80]. The variables used are: fraction of high threshold hits in the TRT (RTRT), the fraction of energy in the first layer of the electromagnetic calorimeter (f1), and the lateral containment of the cluster in the azimuthal direction in the second layer of the electromagnetic calorimeter (Rφ).
An``+eebackground control region is formed by relaxing the electron selection criteria for the electrons of the sub-leading pair. In this case the events in the signal region are a subset of the events present in this control region. Estimating the relative composition of the control region in terms of its isolated electron, Q, γ, and f components is performed using the classification into reconstruction categories. The efficiency needed to extrapolate the background yield of each category from the control region to the signal region is obtained from MC, and cross-checked with data. Additionally, the``+ eebackground is also estimated from a control region which is well separated from the signal region, defined by inverted isolation and impact parameter significance selections, and has been classified into the reconstruction categories. In this case the extrapolation efficiency is estimated inpTandηbins using aZ+`data sample. The results of the two methods are in good agreement. As an additional cross-check these same methods are applied to similar control regions containing same-sign sub-leading di-electrons.
The `` + eebackground is also estimated using a control region with same-sign sub-leading di- electrons, where the three highest pTleptons satisfy all the analysis criteria and the remaining electron is required to only fulfil the good track criteria (nsiliconhits ≥7 andnpixelhits ≥1) and the lateral containment of the cluster energy alongη(Rη). This method will be referred to as 3`+`hereafter. In this case a simultaneous fit of templates, obtained from thenb−layerhits and theRTRTdistributions, is used to estimate the yields for the different truth components f,γand Q. The templates used are obtained from MC. Additional checks are performed by replacing theRTRTwith f1, or the distance inηbetween the extrapolated impact point of the track on the calorimeter and the cluster barycentre using the finely-segmented first calorimeter layer,
∆η1. The difference in the results is taken into account as a systematic uncertainty.
Finally, the``+eebackground is also estimated by performing the full analysis but selecting same- sign pairs for the sub-leading di-electrons. In this case, there remain 6 (2) events belowm4` =160 GeV in the 4e(2µ2e) sub-channels. The 160 GeV selection is applied for these events to avoid contamination from the irreducibleZZ(∗)background with an incorrect charge measurement. Since thebb¯ background contribution is small, the same-sign estimate is expected to be close to the opposite-sign estimates. This is the case within the statistical uncertainty.
4.3.3 Summary of reducible background estimates
The results of all the reducible background estimation methods are summarised in Table 3 and the esti- mate used for the background normalisation is indicated with the “†” symbol. These are given for the full mass range, where approximately 80% of the background has m4` < 160 GeV. The m12 andm34 distributions for events selected by the analysis when removing the isolation and impact parameter re- quirements for the sub-leading di-lepton are presented in Fig. 3. The events are divided according to the flavour of the sub-leading lepton pair into ``+µµand``+eesamples. In Figs. 3(a) and 3(c) them12 andm34 distributions are presented for``+µµevents, while in Figs. 3(b) and 3(d) the corresponding distributions are presented for``+eeevents. The shape and normalisation of the backgrounds discussed earlier are in good agreement with data. This is observed both for large values ofm34, where theZZ(∗) background dominates, and for lowm34values.
Similar techniques are used to estimate the backgrounds for VBF-like and VH-like categories. The estimated total background yields for the 20.7 fb−1for 2012 data at √
s=8 TeV (4.6 fb−1for 2011 data at
√s=7 TeV) are 0.33±0.09 (0.15±0.07) events for the VBF-like category and 0.08±0.04 (0.03±0.02) events for the VH-like category.
Table 3: Summary of the estimated numbers ofZ+jets andtt¯background events for the 20.7 fb−1 of
√s=8 TeV data and for the 4.6 fb−1of √
s=7 TeV data for the full mass range of the analysis after the kinematic selections described in the text. The sub-leading same sign full analysis event counts are given only form4` <160 GeV to avoid contamination from the irreducibleZZ(∗)background with an incorrect charge measurement. Approximately 80% of the reducible background has m4` < 160 GeV. The “†”
symbol indicates the estimates used for the background normalisation, the others being cross-checks.
The first uncertainty is statistical, the second is systematic.
method estimate at √
s=8 TeV estimate at √
s=7 TeV
4µ 4µ
m12fit: Z+jets contribution 2.4±0.5±0.6† 0.22±0.07±0.02† m12fit:tt¯contribution 0.14±0.03±0.03† 0.03±0.01±0.01†
t¯tfromeµ+µµ 0.10±0.05±0.004 -
2e2µ 2e2µ
m12fit: Z+jets contribution 2.5±0.5±0.6† 0.19±0.06±0.02† m12fit:tt¯contribution 0.10±0.02±0.02† 0.03±0.01±0.01†
tt¯fromeµ+µµ 0.12±0.07±0.005 -
2µ2e 2µ2e
``+e±e∓relaxed cuts 5.2±0.4±0.5† 1.8±0.3±0.4
``+e±e∓inverted cuts 3.9±0.4±0.6 -
3`+`(same-sign) 4.3±0.6±0.5 2.8±0.4±0.5†
sub-leading same sign full analysis events 4 0
4e 4e
``+e±e∓relaxed cuts 3.2±0.5±0.4† 1.4±0.3±0.4
``+e±e∓inverted cuts 3.6±0.6±0.6 -
3`+`(same-sign) 4.2±0.5±0.5 2.5±0.3±0.5†
sub-leading same sign full analysis events 3 2
[GeV]
m12
60 80 100
Events/2 GeV
0 20 40 60 80 100 120 140 160 180
Data =125 GeV) Signal (mH
ZZ Z+jets
t t WZ Syst.Unc.
Preliminary ATLAS
Ldt = 4.6 fb-1
∫
= 7 TeV:
s
Ldt = 20.7 fb-1
∫
= 8 TeV:
s
µ-
µ+ -+
+e
-/e µ µ+
(a)
[GeV]
m12
60 80 100
Events/2 GeV
0 20 40 60 80 100 120 140 160 180
Data
=125 GeV) Signal (mH
ZZ t Z+jets, t Syst.Unc.
Preliminary ATLAS
Ldt = 4.6 fb-1
∫
= 7 TeV:
s
Ldt = 20.7 fb-1
∫
= 8 TeV:
s
e-
+e+
e-
/e+
µ-
µ+
(b)
[GeV]
m34
50 100
Events/5 GeV
0 20 40 60 80 100 120 140 160 180 Data
=125 GeV) Signal (mH
ZZ Z+jets
t t WZ Syst.Unc.
Preliminary ATLAS
Ldt = 4.6 fb-1
∫
= 7 TeV:
s
Ldt = 20.7 fb-1
∫
= 8 TeV:
s
µ-
µ+ -+
+e
-/e µ µ+
(c)
[GeV]
m34
50 100
Events/5 GeV
0 20 40 60 80 100 120 140 160 180 Data
=125 GeV) Signal (mH
ZZ t Z+jets, t Syst.Unc.
Preliminary ATLAS
Ldt = 4.6 fb-1
∫
= 7 TeV:
s
Ldt = 20.7 fb-1
∫
= 8 TeV:
s
e-
+e+
e-
/e+
µ-
µ+
(d)
Figure 3: Invariant mass distributions of the lepton pairs in the control sample defined by a Z boson candidate and an additional same-flavour lepton pair, for the √
s=8 TeV and √
s=7 TeV data combined.
The sample is divided according to the flavour of the additional lepton pair. In (a) them12and in (c) the m34 distributions are presented for ``+µµevents. In (b) the m12 and in (d) the m34 distributions are presented for ``+eeevents. The kinematic selection of the analysis is applied. Isolation and impact parameter significance requirements are applied to the first lepton pair only. The MC is normalised to the data-driven background estimations given in Table 3. Finally, the expected contribution of the SM Higgs boson signal atmH=125 GeV is also shown.
5 Systematic Uncertainties
The uncertainties on the lepton reconstruction and identification efficiencies, and on the energy or mo- mentum resolution and scale, are determined using samples ofW,ZandJ/ψdecays. The discussion of these systematic uncertainties, as well as of the uncertainties associated with the event categorisation, is separated into three parts. The discussion of the systematic uncertainties related to the measurement of the signal rate is presented in Section 5.1. A detailed overview of the systematic uncertainties which af- fect the mass measurement is given in Section 5.2. The discussion of the systematic uncertainties related to the event categorisation is discussed in Section 5.3.
5.1 Systematic uncertainties on the measurement of the signal rate
The uncertainty on the muon identification and reconstruction efficiency results in an uncertainty on the yields for the signal and the dominant ZZ(∗) background which is uniform over the mass range of interest, and amounts to±0.8% (±0.4%/±0.4%) for the 4µ(2µ2e/2e2µ) channel. The uncertainty on the electron identification and reconstruction efficiency results in an uncertainty on the yields for the signal of±2.4% (±1.8%/±1.6%) for the 4e(2µ2e/2e2µ) channel atm4`=1 TeV and±9.4% (±8.7%/±2.4%) atm4`=125 GeV.
The selection efficiency of the isolation and impact parameter requirements is studied using data for both isolated and non-isolated leptons. Isolated leptons are obtained fromZ → ``decays, while addi- tional leptons reconstructed in events withZ →``decays constitute the sample of non-isolated leptons.
Additional checks are performed with non-isolated leptons from semi-leptonicb- andc-quark decays in a heavy-flavour enriched di-jet sample. Good agreement is observed between data and simulation and the systematic uncertainty is estimated to be small with respect to other systematic uncertainties.
ThepTre-weighting of the ggF process of Ref. [13] is applied only at the analysis level to simulated events for the 2011 analysis, and is included in the event generation for the 2012 analysis. To allow for a possible selection bias, an additional±1% uncertainty on the signal selection efficiency is added, evaluated by varying the Higgs boson pT spectrum in the ggF process according to the PDF and QCD scale uncertainties.
The background uncertainties on the data-driven methods have already been presented in Section 4 and are summarised in Table 3. The overall uncertainty on the integrated luminosity for the complete 2011 data set is±1.8% and is described in Ref. [81]. The uncertainty on the 2012 data set luminosity is
±3.6%. It is derived following the same methodology as that detailed in Ref. [81], from a preliminary calibration of the luminosity scale derived from beam-separation scans performed in April 2012. Finally, the theory-related systematic uncertainty, for both signal and ZZ(∗) background, has been discussed in Section 3.
5.2 Systematic uncertainties on the measurement of the signal mass
For the H → ZZ(∗) → 4` decay modes involving electrons, the impact of the electron energy scale uncertainty is determined from theZ→eesample. This uncertainty is conservatively estimated to be less than±0.4%(±0.2%) on the measured mass for the 4e(2e2µ) channel, and is negligible for 2µ2edue to the lowpTof the electrons. The uncertainty on the energy scale for electrons with transverse energies below 15 GeV is verified using J/ψ→eedecays: for electrons with a transverse energy of around 10 GeV, the measurements agree with the predictions to better than 1%, which leads to a negligible contribution to the overall uncertainty on theH→ZZ(∗)→4`mass measurement, i.e. below 0.1%. Finally, mass-scale uncertainties related to final-state QED radiation modelling and to background contamination are also smaller than 0.1%.