ATLAS-CONF-2013-079 31/07/2013
ATLAS NOTE
ATLAS-CONF-2013-079
July 19, 2013
Minor revision: July 25, 2013
Search for the bb decay of the Standard Model Higgs boson in associated (W /Z)H production with the ATLAS detector
The ATLAS Collaboration
Abstract
A search for thebb decay of the Standard Model Higgs boson is performed with the ATLAS experiment using the full dataset recorded at the LHC in Run 1. The integrated luminosities used fromppcollisions at√
s=7 and 8 TeV are 4.7 and 20.3 fb−1, respectively.
The processes considered are associated (W/Z)H production, withW → `ν, Z → ``(` = e, µ), and Z → νν. No significant excess is observed above the Standard Model (SM) backgrounds. FormH=125 GeV, a 95% CL upper limit of 1.4 times the SM expectation is set on the cross section times branching ratio forpp→(W/Z)(H→bb). The corresponding limit expected in the absence of signal is 1.3. The ratio of the measured signal strength to the SM expectation is found to beµ= 0.2±0.5(stat.)±0.4(syst.). The analysis procedure is validated by a measurement of the yield of (W/Z)Zproduction, withZ→bb, from which the ratio of the observed signal strength to the SM expectation is found to beµVZ=0.9±0.2.
Revised Table 5 and minor textual revision with respect to the version of July 19, 2013
c
Copyright 2013 CERN for the benefit of the ATLAS Collaboration.
Reproduction of this article or parts of it is allowed as specified in the CC-BY-3.0 license.
1 Introduction
For decades, the Higgs boson [1–4] of the Standard Model (SM) remained an unconfirmed prediction.
In July 2012, the ATLAS and CMS experiments at the LHC reported the observation of a new particle with a mass of about 125 GeV and with properties consistent with those expected from the SM Higgs boson [5, 6]. Since then, more precise measurements have strengthened the hypothesis that the new particle is indeed a Higgs boson [7–9]. The ATLAS measurements have been performed in the bosonic decay modes of the new particle (H
→γγ,H
→ZZ, and H
→WW), and it is also essential to verify that it decays into fermions as predicted by the Standard Model, or to observe deviations from those predictions.
The H
→bb decay mode is predicted in the SM to have a branching ratio of 58% for m
H =125 GeV [10]. An inclusive search for H
→bb is not feasible at hadron colliders because of the overwhelming background from multijet production. In spite of a cross section more than an order of magnitude lower than the dominant gluon-gluon fusion process, associated production of a Higgs boson with a vector boson, W or Z, o
ffers a viable alternative because leptonic decays of the vector boson, W
→`ν,Z
→``(`
=e, µ), and Z
→νν, can be efficiently used for triggering and background reduction purposes. The CDF and D0 experiments at the Tevatron reported in July 2012 an excess of events in their search for associated (W/Z)H production in the H
→bb decay mode at the level of 2.8 standard deviations (σ) for m
H =125 GeV [11]. Recently, the CMS experiment reported an excess of events in the H
→bb decay mode with a significance of 2.1σ for m
H=125 GeV [12].
Searches for associated (W/Z)H production of the SM Higgs boson in the bb decay mode have been reported by the ATLAS experiment, based on datasets of 4.7 and 13.0 fb
−1recorded at
√s
=7 and 8 TeV, respectively [13, 14]. In this note, an update of these searches is presented, using the full integrated luminosity accumulated by ATLAS during Run 1 of the LHC, 4.7 and 20.3 fb
−1at centre-of- mass energies of 7 and 8 TeV in 2011 and 2012, respectively. In addition to the increase in the size of the dataset, this update benefits from numerous analysis improvements.
The analysis is performed for events containing zero, one, or two charged leptons (electrons or muons), targeting the Z
→ νν,W
→ `ν, orZ
→ ``decay modes of the vector boson, respectively.
The 0-lepton channel has a reduced but not insignificant contribution from W
→ `ν, when the lepton isproduced outside of the detector acceptance or not identified. A b-tagging algorithm is used to identify the jets from the H
→bb decay. To improve the sensitivity, the three channels are further split according to the vector boson transverse momentum and the number of jets, and topological and kinematic selec- tion criteria are applied within each of the resulting categories. In the statistical analysis used to obtain the final results, the mass of the two b-tagged jets is used as the discriminating variable, and dedicated control samples constrain the contributions of the dominant background processes.
To validate the analysis, a measurement of the cross section of (W
/Z)Zproduction is performed in the same final states and with the same event selection, with H
→bb replaced by Z
→bb.
2 The ATLAS Detector
The ATLAS detector [15] consists of four main subsystems. An inner tracking detector is immersed in the 2 T magnetic field produced by a superconducting solenoid. Charged particle position and momentum measurements are made by pixel detectors followed by silicon strip detectors in the pseudorapidity
11ATLAS uses a right-handed coordinate system with its origin at the nominal interaction point (IP) in the centre of the detector and thez-axis coinciding with the axis of the beam pipe. Thex-axis points from the IP to the centre of the LHC ring, and they-axis points upward. Cylindrical coordinates (r,φ) are used in the transverse plane,φbeing the azimuthal angle around thez-axis. The pseudorapidity is defined in terms of the polar angleθasη=−ln tan(θ/2). The distance inη−φcoordinates is
∆R=p
∆φ2+ ∆η2, also used to define cone radii. For the purpose of object selections,ηis calculated relative to the geometric
range
|η| <2.5 and also by a straw tube tracker in the range
|η| <2.0. Calorimeters cover
|η| <4.9 with a variety of detector technologies. The liquid-argon electromagnetic calorimeters are divided into barrel (
|η| <1.475), endcap (1.375
< |η| <3.2), and forward (3.1
< |η| <4.9) sections. The hadronic calorimeters (using liquid argon or scintillating tiles as active materials) surround the electromagnetic calorimeters and cover
|η| <4.9. The muon spectrometer measures the deflection of muon tracks in the field of three large air-core toroidal magnets, each containing eight superconducting coils. It is instrumented with separate trigger chambers (covering
|η| <2.4) and high-precision tracking chambers (covering
|η|<2.7).
3 Simulated Samples
Monte Carlo (MC) simulated samples are produced for signal and background processes using the
atlfast-II simulation [16], which includes a full simulation of the ATLAS detector based on the
geant4 program [17], except for the response of the calorimeters for which a parameterised simulation is used.
The MC generator used for the W H and ZH signal processes is
pythia8 [18] with the CTEQ6L1 [19]
parton distribution functions (PDFs). The AU2 tune [20,21] is used for the parton shower, hadronisation, and multiple parton interactions. The total production cross sections and associated uncertainties are computed at next-to-next-to-leading order (NNLO) in QCD
2and with electroweak corrections at next- to-leading order (NLO) according to Refs. [23–26]. Additional NLO corrections are applied as a function of the transverse momentum of the vector boson [27]. The decay branching ratios are calculated with
hdecay[10]. Signal samples are simulated for Higgs boson masses from 100 to 150 GeV in steps of 5 GeV. All charged lepton flavours are simulated in the W and Z decays, as leptonic decays of the
τleptons can also be selected in the analysis. For the Higgs boson, only the bb decay mode is simulated.
For the main background processes, version 1.4.1 of the
sherpagenerator [28] is used with the CT10 PDFs [29] to simulate W and Z
+jets at leading-order (LO) in QCD, with massive c and b quarks. The next most important background is from tt production, which is simulated with the
powheggenerator [30–32]
with the CT10 PDFs, interfaced with
pythia6 [33], for which the CTEQ6L1 PDFs and the Perugia2011C tune [20, 21] are used. In this analysis, the final normalisations of these dominant backgrounds are constrained by the data, but theoretical cross sections at NNLO for (W
/Z)+jets [34] and approximateNNLO for tt [35] are used to optimise the selection.
Additional backgrounds arise from single-top and diboson (WW , WZ, and ZZ) production. For single-top, the s-channel exchange process and Wt production are simulated with
powheg, as fortt, while the t-channel exchange process is simulated with the A
cerMC generator [36] with the CTEQ6L1 PDFs and the Perugia2011C tune. The cross sections are taken from Refs. [37–39]. The
herwiggenerator [40]
is used for diboson processes, with the CTEQ6L1 PDFs and the AUET2 tune [20,21]. The cross sections are obtained at NLO from
mcfm[41] with the MSTW2008NLO PDFs [42].
Events from minimum bias interactions are simulated with the
pythia8 generator with the MSTW- 2008LO PDFs [43] and the A2 tune [20, 21]. They are overlaid on the signal and background simulated events according to the luminosity profile of the recorded data. The contributions from these “pile-up”
interactions are simulated both within the same bunch crossing as the hard-scattering process and in neighbouring bunch crossings. The resulting events are then processed through the same reconstruction programs as the data.
Additional generators are used for the assessment of systematic uncertainties on the main back- grounds. For Wbb, these are
powheg[44] and amc@nlo [45, 46], based on the
mc@nloformalism [47]
centre of the detector; otherwise, it is relative to the reconstructed primary vertex of each event.
2The recent NLO corrections to gluon-inducedZHproduction [22], which increase the totalZHproduction cross section by about 5%, are not included.
and the
madgraph-5 framework [48], and for tt
powheg+herwig, A
cerMC,
alpgen[49], and
mc@
nlo. These studies are performed at generator level.
Simulated jets are labeled according to which generated hadrons with p
T >5 GeV are found within a cone of radius 0.4 around the reconstructed jet axis. If a b hadron is found, the jet is labeled as b jet.
If not and a c hadron is found, the jet is labeled as c jet. If neither a b nor a c hadron is found, the jet is labeled as light (i.e., quark or gluon) jet. Simulated V
+jet events, whereV stands for W or Z, are then categorised according to the labels of the two jets that are selected to reconstruct the dijet mass. If one of those jets is labeled as a b jet, the event belongs to the Vb category. If not and one of the jets is labeled as a c jet, the event belongs to the Vc category. Otherwise, the event belongs to the Vl category. Further subdivisions are defined according to the flavour of the other jet from the pair, using the same precedence order: Vbb, Vbc, Vbl, Vcc, Vcl.
4 Object and Event Reconstruction
Events in the 0-lepton channel are selected by triggers based on missing transverse momentum (E
missT).
Three slightly di
fferent trigger configurations are used in 2012 to cope with the increasing pile-up con- ditions. Events in the 1-lepton channel are primarily selected by single-lepton triggers. In the muon channel, E
missTtriggers are also used to cope with a reduced muon-chamber coverage in some regions of the detector, thus improving the signal acceptance by about 20%. Events in the 2-lepton channel are selected by a combination of single-lepton, dielectron, and dimuon triggers.
The primary vertex is selected among all vertices as the one with the largest sum of associated track p
2Tand is required to have at least three associated tracks with p
T >0.4 GeV.
Three categories of electrons [50] and muons [51] are used in the analysis, denoted in increasing order of purity as loose, medium and tight leptons. Loose leptons are selected with transverse energy E
T >10 GeV and pass impact parameter and basic quality requirements. Loose electrons are required to have
|η|<
2.47. Three types of muons are included in the loose definition to maximise the acceptance: muons reconstructed in both the muon spectrometer and the inner detector cover
|η| <2.5, muons identified in the calorimeter and associated with an inner detector track are accepted for
|η| <0.1, where there is limited muon-chamber coverage, and muons without a full inner detector track are accepted for 2.5
<|η|<
2.7. Finally, the scalar sum of the transverse momenta of tracks within a cone of radius 0.2 centred on the lepton candidate track, excluding the lepton track, is required to be less than 10% of the transverse momentum of the lepton.
Medium leptons meet the loose identification criteria and have E
T >25 GeV. Medium electrons are required to pass additional requirements based on the track quality and the shower shape in the calorimeter, and medium muons must have
|η| <2.5. Tight electrons are required to pass still more stringent quality requirements. For both tight electrons and tight muons, it is further required that the sum of the calorimeter energy deposits in a cone of radius 0.3 around the lepton, excluding energy associated with the lepton candidate, be less than 7% of the lepton energy, and the track-based isolation criterion is tightened from 10% to 4%.
Jets are reconstructed from topological clusters in the calorimeters [52] using the anti-k
talgorithm [53]
with a distance parameter of 0.4. Jet energies are corrected for the contribution of pile-up interactions using a jet-area based technique [54] and calibrated using p
Tand
η-dependent correction factors deter-mined from simulation and validated with data [55]. To reduce the contamination by jets from pile-up interactions, the scalar sum of the p
Tof tracks matched to the jet and originating from the primary vertex must be at least 75% (50%) of the scalar sum of the p
Tof all tracks matched to the jet for the 7 TeV (8 TeV) dataset. This criterion is only applied to jets with p
T <50 GeV and
|η|<2.4. Selected jets must have p
T >20 GeV and
|η| <4.5. The two jets used to reconstruct the dijet mass are required to satisfy
|η|<
2.5, the
ηrange within which b-tagging can be applied.
Table 1: The basic event selection for the three channels.
Object 0-lepton 1-lepton 2-lepton
Leptons 0 loose leptons 1 tight lepton 1 medium lepton
+0 loose leptons
+1 loose lepton Jets
2 b-tags p
jetT1 >45 GeV p
jetT2 >20 GeV
+≤1 extra jets Missing E
TE
missT >120 GeV E
missT >25 Gev E
missT <60 GeV p
missT >30 GeV
∆φ(Emiss
T ,pmiss
T
)
< π/2min[
∆φ(EmissT ,
jet)]
>1.5
∆φ(Emiss
T ,
b b) ¯
>2.8
Vector Boson - m
WT <120 GeV 83
<m
`` <99 GeV
Jets originating from b-quarks are identified using the MV1 b-tagging algorithm [56–60], which combines information from various algorithms based on track impact-parameter significance or explicit reconstruction of b-hadron decay vertices. The b-tagging selection criterion used in this analysis results in a typical efficiency of 70% for b jets, as measured in simulated tt events, and rejection factors of 5 and 150 against c and light jets, respectively.
In the analysis samples for which two b-tagged jets are required, the powerful rejection of the b- tagging algorithm renders the size of the Vc, Vl and WW simulated samples insufficient to provide a reliable description of the dijet mass shape of these backgrounds. In those cases, therefore, an alternative procedure is used wherein, instead of tagging the c and l-labeled jets by the MV1 algorithm, parameteri- sations as functions of p
Tand
ηof their probabilities to be b tagged are used.
The missing transverse momentum
EmissT
[61] is measured as the negative vector sum of the trans- verse momenta associated with energy clusters in the calorimeters with
|η|<4.9. Corrections are applied to the energies of clusters associated to reconstructed objects (jets, electrons,
τleptons, and photons), using the calibrations of those objects. The transverse momenta of reconstructed muons are included, with the energy deposited by these muons in the calorimeters properly taken into account. In addition, a track-based missing transverse momentum,
pmissT
, is calculated as the negative vector sum of the trans- verse momenta of tracks associated to the primary vertex.
Corrections are applied to the simulation to account for small di
fferences from data for trigger ef- ficiencies, object reconstruction and identification efficiencies, as well as object energy and momentum calibrations and resolutions.
5 Event Selection
The optimisation of the analysis is performed for a Higgs boson mass of 125 GeV. The basic event selection criteria are summarised in Table 1.
Events containing no loose leptons are assigned to the 0-lepton channel. Events containing one tight lepton and no additional loose leptons are assigned to the 1-lepton channel. Events containing one medium lepton and one additional loose lepton of the same flavour and of opposite charge are assigned to the 2-lepton channel.
Exactly two b-tagged jets are required, with p
T>20 GeV and
|η|<2.5, and the leading (highest p
T)
Table 2: Further topological criteria in p
VTintervals. The 0-lepton channel does not use the lowest two p
VTintervals.
p
VT[GeV] 0-90 90-120 120-160 160-200
>200All Channels
∆R(b, b) ¯ 0.7-3.4 0.7-3.0 0.7-2.3 0.7-1.8
<1.41-lepton E
missT[GeV]
>25 >50m
WT[GeV] 40-120
<120b-tagged jet must have p
T >45 GeV. The dijet system is formed by these two b-tagged jets. There can be at most one additional jet with p
T >20 GeV and
|η| <2.5. In the 0- and 1-lepton channels, events containing a jet with p
T >30 GeV and
|η| >2.5 are discarded to reduce the tt background and, if three jets are selected, the two b-tagged jets must be the two leading jets.
In the 0-lepton channel, the multijet background is suppressed by imposing requirements on E
Tmiss, p
missT, the azimuthal angle between those (
∆φ(EmissT ,pmiss
T
)), the azimuthal angle between
EmissT
and the nearest jet (min[∆
φ(EmissT ,
jet)]), and the azimuthal angle between
EmissT
and the dijet system (∆
φ(EmissT ,
b b)). ¯ In the 1-lepton channel, requirements are imposed on E
missTand on the transverse mass
3m
WTto select events consistent with the presence of a W boson. The requirement on the maximum value of m
WTreduces the contamination from the tt background. This background is reduced in the 2-lepton channel by imposing criteria on the dilepton invariant mass (m
``), which must be consistent with the mass of the Z boson, and on E
missT.
Further topological criteria are applied to reject backgrounds and enhance the sensitivity of the search. These are outlined in Table 2.
The transverse momentum of the vector boson (p
VT) is reconstructed as the E
missTin the 0-lepton channel, the magnitude of the vector sum of the lepton and the
EmissT
in the 1-lepton channel (p
WT) and of the vector sum of the two leptons in the 2-lepton channel ( p
ZT). The events are categorised in five p
VTintervals, with boundaries at 0, 90, 120, 160, and 200 GeV. The E
missTtriggers are 90% efficient for E
missT =120 GeV, and fully e
fficient for E
missT >160 GeV. Only the last three intervals are therefore used in the 0-lepton channel.
The requirements applied on the angular separation between the two jets of the dijet system,
∆R(b, b) ¯
= p∆φ(b,b) ¯
2+ ∆η(b,b) ¯
2, depend on the p
VTinterval. The criterion on the minimum value reduces the back- ground from V
+jet production, while the criterion on the maximum value, which reduces the background from tt production, is tightened with increasing p
VTto take advantage of the increasing collimation of the dijet system. For the same reason, the criterion on the minimum value is removed in the highest p
VTinterval. In the 1-lepton channel, the requirement of a minimum value for m
WT, designed to reject the multijet background, is removed for events with p
WT >160 GeV, where this background is negligible, thus improving the signal acceptance.
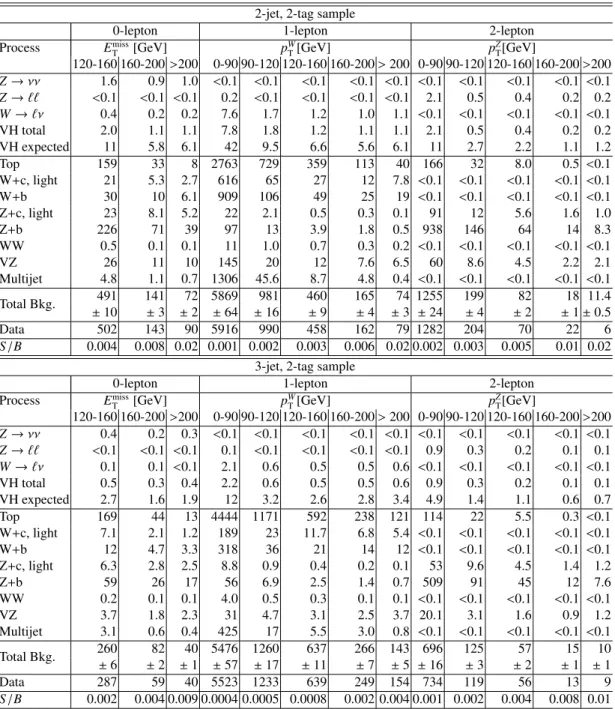
These selection criteria define a set of “2-tag signal regions”, categorised in terms of channel (0-, 1-, or 2-leptons), p
VTinterval, and jet multiplicity (2 or 3). A number of “control” regions are also used in the analysis to constrain the main backgrounds. These control regions are selected in the same way as the signal regions, except for the following modifications. For the 1-tag control regions, exactly one jet must be b tagged, and the highest p
Tnon b-tagged jet plays the role of the second b-tagged jet in the selection. For the 0-tag control region, no jet is b tagged, and the two leading jets play the role of the b-tagged jets in the selection. In the 1-lepton channel, the 2-tag region with a third jet selected acts also as a control region because it is largely dominated by tt events. In the 2-lepton channel, two additional
3The transverse massmWT is calculated from the transverse momenta and the azimuthal angles of the charged lepton (p`T andφ`) and missing transverse momentum (EmissT andφmiss):mWT =q
2p`TEmissT (1−cos(φ`−φmiss)).
2-tag regions are defined, which are inclusive in jet multiplicity (≥ 2). In the first one, a “validation region”, the requirement on the dilepton mass is reversed (40
<m
`` <83 GeV or m
`` >99 GeV) and no requirement is placed on E
missT. In the second one, a “control region”, events containing different-flavour lepton pairs (electron or muon) are selected.
After event selection, the dijet mass is recomputed in the 2-tag regions with an improved jet calibra- tion. The energy from muons within a jet is added to the calorimeter-based jet energy, and a p
T-dependent correction is applied to account for biases in the response due to resolution effects. This latter correction is determined for the p
Tspectrum of the jets from the decay of a Higgs boson with m
H =125 GeV in (W
/Z)Hevents. The mass resolution for the signal after these corrections ranges between 12% and 10%
from the lowest to the highest p
VTinterval.
The cross sections times branching ratios for (W/Z)H with W
→`ν,Z
→``,Z
→νν, andH
→bb, as well as the acceptances in the three channels after full selection are given in Table 3.
Table 3: The cross section
×branching ratio (BR) and acceptance for the three channels at both 7 and 8 TeV. The branching ratios are calculated considering only decays to muons and electrons for Z
→``,decays to all three lepton flavours for W
→ `νand decays to neutrinos for Z
→νν. The acceptance iscalculated as the fraction of events remaining in the 2-tag signal regions after the full event selection.
m
H=125 GeV at 7 TeV
(W
/Z)(H→bb) Cross-section
×BR [fb] Acceptance [%]
0-lepton 1-lepton 2-lepton
Z
→``12.3 0.0 0.7 8.2
W
→`ν107.1 0.2 3.5 -
Z
→νν36.4 2.2 - -
m
H=125 GeV at 8 TeV
(W
/Z)(H→bb) Cross-section
×BR [fb] Acceptance [%]
0-lepton 1-lepton 2-lepton
Z
→``15.3 0.0 0.9 8.4
W
→`ν130.2 0.2 3.3 -
Z
→νν45.5 2.5 - -
6 Background Composition and Modeling
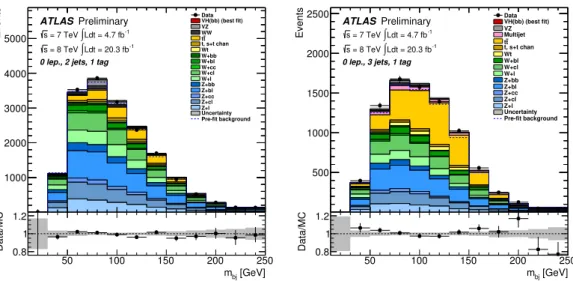
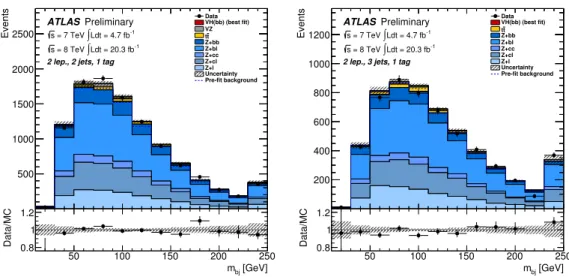
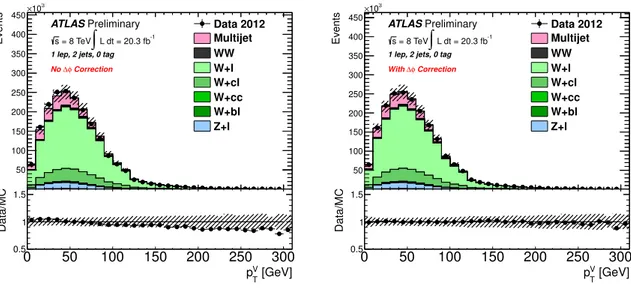
The dijet mass distributions are shown in Figs. 1 to 5 for all the 2-tag signal regions. Distributions for the 1-tag control regions are shown in Figs. 6 to 8 with all p
VTintervals combined. The validation and top control regions in the 2-lepton channel are shown in Fig. 9 with all p
VTintervals combined. The normalisations of the various backgrounds are those extracted from the global fit described in Sec. 8. The fit also adjusts the shapes of the dijet mass distributions in the 2-tag signal regions within the constraints from the systematic uncertainties. For the multijet backgrounds, the normalisations and shapes provided as inputs to the fit are estimated from data, as described below. For the other backgrounds the inputs are given by the simulation, except for the normalisations of the V
+jets and tt backgrounds, which are left free to float in the fit. The corrections to these two backgrounds, described below, are also applied prior to the fit. In each figure, all backgrounds are taken into account, but those contributing less than 1% are omitted from the legend.
It can be seen that the background composition in the signal regions varies greatly from channel to
channel, with the jet multiplicity, and with the p
VTinterval considered. The signal to background ratio
50 100 150 200 250
Events
50 100 150 200 250 300
Data VH(bb) (best fit) VZ
t t t, s+t chan Wt W+bb W+cc W+cl Z+bb Z+bl Z+cc Z+cl Uncertainty Pre-fit background
=1.0) µ VH(bb) (
ATLASPreliminary Ldt = 4.7 fb-1
∫
= 7 TeV s
Ldt = 20.3 fb-1
∫
= 8 TeV s
<160 GeV V 0 lep., 2 jets, 2 tags, 120<pT
[GeV]
mbb
50 100 150 200 250
Data/MC 0.5
1
1.5 50 100 150 200 250
Events
20 40 60 80 100 120 140
160 Data
VH(bb) (best fit) VZ Multijet
t t t, s+t chan Wt W+bb W+cc W+cl Z+bb Z+bl Z+cc Uncertainty Pre-fit background
=1.0) µ VH(bb) (
ATLASPreliminary Ldt = 4.7 fb-1
∫
= 7 TeV s
Ldt = 20.3 fb-1
∫
= 8 TeV s
<160 GeV V 0 lep., 3 jets, 2 tags, 120<pT
[GeV]
mbb
50 100 150 200 250
Data/MC 0.5
1 1.5
50 100 150 200 250
Events
20 40 60 80 100
Data VH(bb) (best fit) VZ
t t t, s+t chan Wt W+bb W+cc W+cl Z+bb Z+bl Z+cc Z+cl Uncertainty Pre-fit background
=1.0) µ VH(bb) (
ATLASPreliminary Ldt = 4.7 fb-1
∫
= 7 TeV s
Ldt = 20.3 fb-1
∫
= 8 TeV s
<200 GeV V 0 lep., 2 jets, 2 tags, 160<pT
[GeV]
mbb
50 100 150 200 250
Data/MC 0.5
1
1.5 50 100 150 200 250
Events
10 20 30 40
50 DataVH(bb) (best fit)
VZ t t t, s+t chan Wt W+bb W+cc W+cl Z+bb Z+bl Z+cc Z+cl Uncertainty Pre-fit background
=1.0) µ VH(bb) (
ATLASPreliminary Ldt = 4.7 fb-1
∫
= 7 TeV s
Ldt = 20.3 fb-1
∫
= 8 TeV s
<200 GeV V 0 lep., 3 jets, 2 tags, 160<pT
[GeV]
mbb
50 100 150 200 250
Data/MC 0.5
1 1.5
50 100 150 200 250
Events
10 20 30 40 50 60 70
80 DataVH(bb) (best fit)
VZ t t W+bb W+cc W+cl Z+bb Z+bl Z+cc Z+cl Uncertainty Pre-fit background
=1.0) µ VH(bb) (
ATLASPreliminary Ldt = 4.7 fb-1
∫
= 7 TeV s
Ldt = 20.3 fb-1
∫
= 8 TeV s
>200 GeV V 0 lep., 2 jets, 2 tags, pT
[GeV]
mbb
50 100 150 200 250
Data/MC 0.5
1
1.5 50 100 150 200 250
Events
5 10 15 20 25 30 35
Data VH(bb) (best fit) VZ
t t Wt W+bb W+cc W+cl Z+bb Z+bl Z+cc Z+cl Uncertainty Pre-fit background
=1.0) µ VH(bb) (
ATLASPreliminary Ldt = 4.7 fb-1
∫
= 7 TeV s
Ldt = 20.3 fb-1
∫
= 8 TeV s
>200 GeV V 0 lep., 3 jets, 2 tags, pT
[GeV]
mbb
50 100 150 200 250
Data/MC 0.5
1 1.5
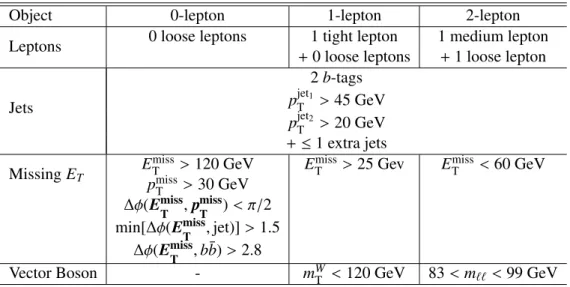
Figure 1: The m
bbdistribution in data (points with error bars) and simulation (histograms) for the six
signal regions of the 0-lepton channel. The 2-jet and 3-jet regions are shown on the left and on the right,
respectively. The background contributions after the global fit are shown as filled histograms. The Higgs
boson signal (m
H =125 GeV) is shown as filled histograms on top of the fitted backgrounds both after
the global fit (indicated as “best fit”) and as expected from the SM ( indicated as
µ =1.0). The size of
the combined statistical and systematic uncertainty on the fitted signal+background is indicated by the
hashed band. The dashed blue histogram shows the total background as expected from the pre-fit Monte
Carlo simulation. The entries in overflow are included in the last bin.
50 100 150 200 250
Events
500 1000 1500 2000 2500 3000
3500 Data
VH(bb) (best fit) VZ Multijet
t t t, s+t chan Wt W+bb W+cc W+cl Z+bb Uncertainty Pre-fit background
=1.0) µ VH(bb) (
ATLASPreliminary Ldt = 4.7 fb-1
∫
= 7 TeV s
Ldt = 20.3 fb-1
∫
= 8 TeV s
<90 GeV V 1 lep., 2 jets, 2 tags, pT
[GeV]
mbb
50 100 150 200 250
Data/MC 0.5
1
1.5 50 100 150 200 250
Events
100 200 300 400 500
Data VH(bb) (best fit) VZ Multijet
t t t, s+t chan Wt W+bb W+cc W+cl Z+bb Uncertainty Pre-fit background
=1.0) µ VH(bb) (
ATLASPreliminary Ldt = 4.7 fb-1
∫
= 7 TeV s
Ldt = 20.3 fb-1
∫
= 8 TeV s
<120 GeV V 1 lep., 2 jets, 2 tags, 90<pT
[GeV]
mbb
50 100 150 200 250
Data/MC 0.5
1 1.5
50 100 150 200 250
Events
50 100 150 200 250
Data VH(bb) (best fit) VZ Multijet
t t t, s+t chan Wt W+bb W+cc W+cl Uncertainty Pre-fit background
=1.0) µ VH(bb) (
ATLASPreliminary Ldt = 4.7 fb-1
∫
= 7 TeV s
Ldt = 20.3 fb-1
∫
= 8 TeV s
<160 GeV V 1 lep., 2 jets, 2 tags, 120<pT
[GeV]
mbb
50 100 150 200 250
Data/MC 0.5
1
1.5 50 100 150 200 250
Events
20 40 60 80 100
Data VH(bb) (best fit) VZ Multijet
t t t, s+t chan Wt W+bb W+bl W+cc W+cl Z+bb Uncertainty Pre-fit background
=1.0) µ VH(bb) (
ATLASPreliminary Ldt = 4.7 fb-1
∫
= 7 TeV s
Ldt = 20.3 fb-1
∫
= 8 TeV s
<200 GeV V 1 lep., 2 jets, 2 tags, 160<pT
[GeV]
mbb
50 100 150 200 250
Data/MC 0.5
1 1.5
50 100 150 200 250
Events
10 20 30 40 50 60
Data VH(bb) (best fit) VZ Multijet
t tt, s+t chan
Wt W+bb W+bl W+cc W+cl W+l Uncertainty Pre-fit background
=1.0) µ VH(bb) (
ATLASPreliminary Ldt = 4.7 fb-1
∫
= 7 TeV s
Ldt = 20.3 fb-1
∫
= 8 TeV s
>200 GeV V 1 lep., 2 jets, 2 tags, pT
[GeV]
mbb
50 100 150 200 250
Data/MC 0.5
1 1.5
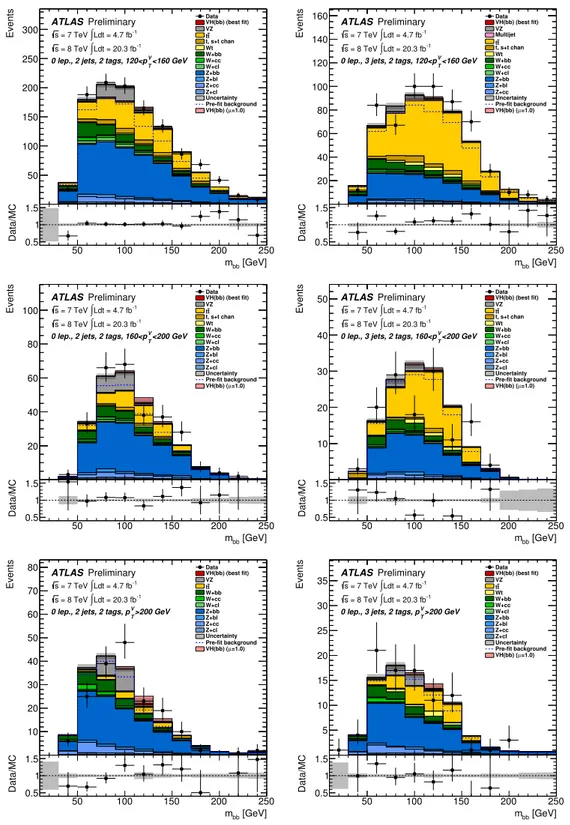
Figure 2: The m
bbdistribution in data (points with error bars) and simulation (histograms) for the five
2-jet signal regions of the 1-lepton channel. The background contributions after the global fit are shown
as filled histograms. The Higgs boson signal (m
H =125 GeV) is shown as filled histograms on top
of the fitted backgrounds both after the global fit (indicated as “best fit”) and as expected from the
SM ( indicated as
µ =1.0). The size of the combined statistical and systematic uncertainty on the
fitted signal+background is indicated by the hashed band. The dashed blue histogram shows the total
background as expected from the pre-fit Monte Carlo simulation. The entries in overflow are included in
the last bin.
50 100 150 200 250
Events
1000 2000 3000 4000
5000 Data
VH(bb) (best fit) Multijet
t t t, s+t chan Wt W+bb W+cc W+cl Uncertainty Pre-fit background
=1.0) µ VH(bb) (
ATLASPreliminary Ldt = 4.7 fb-1
∫
= 7 TeV s
Ldt = 20.3 fb-1
∫
= 8 TeV s
<90 GeV V 1 lep., 3 jets, 2 tags, pT
[GeV]
mbb
50 100 150 200 250
Data/MC 0.5
1
1.5 50 100 150 200 250
Events
100 200 300 400 500 600
Data VH(bb) (best fit) Multijet
t t t, s+t chan Wt W+bb Uncertainty Pre-fit background
=1.0) µ VH(bb) (
ATLASPreliminary Ldt = 4.7 fb-1
∫
= 7 TeV s
Ldt = 20.3 fb-1
∫
= 8 TeV s
<120 GeV V 1 lep., 3 jets, 2 tags, 90<pT
[GeV]
mbb
50 100 150 200 250
Data/MC 0.5
1 1.5
50 100 150 200 250
Events
50 100 150 200 250 300
Data VH(bb) (best fit)
t t t, s+t chan Wt W+bb W+cc Uncertainty Pre-fit background
=1.0) µ VH(bb) (
ATLASPreliminary Ldt = 4.7 fb-1
∫
= 7 TeV s
Ldt = 20.3 fb-1
∫
= 8 TeV s
<160 GeV V 1 lep., 3 jets, 2 tags, 120<pT
[GeV]
mbb
50 100 150 200 250
Data/MC 0.5
1
1.5 50 100 150 200 250
Events
20 40 60 80 100 120 140
Data VH(bb) (best fit) VZ Multijet
t t t, s+t chan Wt W+bb W+cc W+cl Uncertainty Pre-fit background
=1.0) µ VH(bb) (
ATLASPreliminary Ldt = 4.7 fb-1
∫
= 7 TeV s
Ldt = 20.3 fb-1
∫
= 8 TeV s
<200 GeV V 1 lep., 3 jets, 2 tags, 160<pT
[GeV]
mbb
50 100 150 200 250
Data/MC 0.5
1 1.5
50 100 150 200 250
Events
20 40 60 80
100 Data
VH(bb) (best fit) VZ
t t t, s+t chan Wt W+bb W+bl W+cc W+cl Uncertainty Pre-fit background
=1.0) µ VH(bb) (
ATLASPreliminary Ldt = 4.7 fb-1
∫
= 7 TeV s
Ldt = 20.3 fb-1
∫
= 8 TeV s
>200 GeV V 1 lep., 3 jets, 2 tags, pT
[GeV]
mbb
50 100 150 200 250
Data/MC 0.5
1 1.5
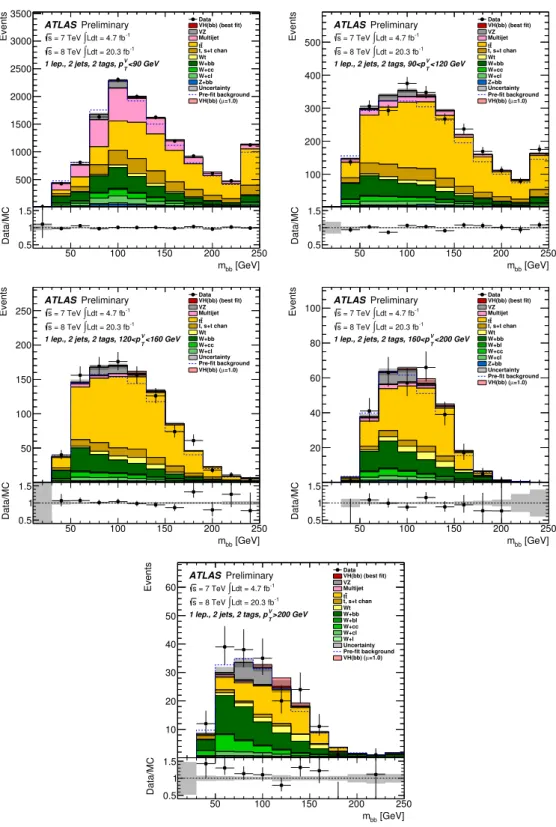
Figure 3: The m
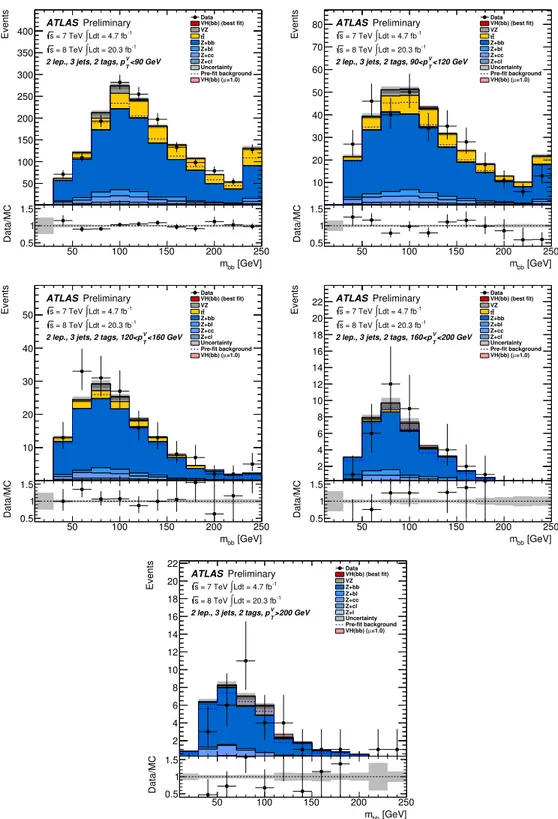
bbdistribution in data (points with error bars) and simulation (histograms) for the five
3-jet signal regions of the 1-lepton channel. The background contributions after the global fit are shown
as filled histograms. The Higgs boson signal (m
H =125 GeV) is shown as filled histograms on top
of the fitted backgrounds both after the global fit (indicated as “best fit”) and as expected from the
SM ( indicated as
µ =1.0). The size of the combined statistical and systematic uncertainty on the
fitted signal+background is indicated by the hashed band. The dashed blue histogram shows the total
background as expected from the pre-fit Monte Carlo simulation. The entries in overflow are included in
the last bin.
50 100 150 200 250
Events
100 200 300 400 500 600 700
800 DataVH(bb) (best fit)
VZ t t Z+bb Z+bl Z+cc Z+cl Uncertainty Pre-fit background
=1.0) µ VH(bb) (
ATLASPreliminary Ldt = 4.7 fb-1
∫
= 7 TeV s
Ldt = 20.3 fb-1
∫
= 8 TeV s
<90 GeV V 2 lep., 2 jets, 2 tags, pT
[GeV]
mbb
50 100 150 200 250
Data/MC 0.5
1
1.5 50 100 150 200 250
Events
20 40 60 80 100 120
Data VH(bb) (best fit) VZ
t t Z+bb Z+bl Z+cc Z+cl Uncertainty Pre-fit background
=1.0) µ VH(bb) (
ATLASPreliminary Ldt = 4.7 fb-1
∫
= 7 TeV s
Ldt = 20.3 fb-1
∫
= 8 TeV s
<120 GeV V 2 lep., 2 jets, 2 tags, 90<pT
[GeV]
mbb
50 100 150 200 250
Data/MC 0.5
1 1.5
50 100 150 200 250
Events
10 20 30 40 50
Data VH(bb) (best fit) VZ
t t Z+bb Z+bl Z+cc Z+cl Uncertainty Pre-fit background
=1.0) µ VH(bb) (
ATLASPreliminary Ldt = 4.7 fb-1
∫
= 7 TeV s
Ldt = 20.3 fb-1
∫
= 8 TeV s
<160 GeV V 2 lep., 2 jets, 2 tags, 120<pT
[GeV]
mbb
50 100 150 200 250
Data/MC 0.5
1
1.5 50 100 150 200 250
Events
5 10 15 20 25
Data VH(bb) (best fit) VZ
t t Z+bb Z+bl Z+cc Z+cl Uncertainty Pre-fit background
=1.0) µ VH(bb) (
ATLASPreliminary Ldt = 4.7 fb-1
∫
= 7 TeV s
Ldt = 20.3 fb-1
∫
= 8 TeV s
<200 GeV V 2 lep., 2 jets, 2 tags, 160<pT
[GeV]
mbb
50 100 150 200 250
Data/MC 0.5
1 1.5
50 100 150 200 250
Events
2 4 6 8 10 12 14 16
18 DataVH(bb) (best fit)
VZ Z+bb Z+bl Z+cc Z+cl Uncertainty Pre-fit background
=1.0) µ VH(bb) (
ATLASPreliminary Ldt = 4.7 fb-1
∫
= 7 TeV s
Ldt = 20.3 fb-1
∫
= 8 TeV s
>200 GeV V 2 lep., 2 jets, 2 tags, pT
[GeV]
mbb
50 100 150 200 250
Data/MC 0.5
1 1.5
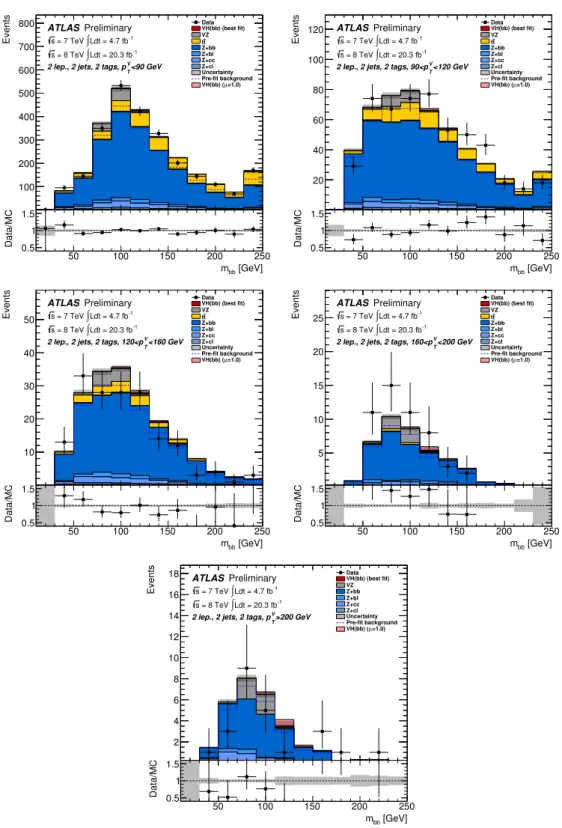
Figure 4: The m
bbdistribution in data (points with error bars) and simulation (histograms) for the five
2-jet signal regions of the 2-lepton channel. The background contributions after the global fit are shown
as filled histograms. The Higgs boson signal (m
H =125 GeV) is shown as filled histograms on top
of the fitted backgrounds both after the global fit (indicated as “best fit”) and as expected from the
SM ( indicated as
µ =1.0). The size of the combined statistical and systematic uncertainty on the
fitted signal+background is indicated by the hashed band. The dashed blue histogram shows the total
background as expected from the pre-fit Monte Carlo simulation. The entries in overflow are included in
the last bin.
50 100 150 200 250
Events
50 100 150 200 250 300 350 400
Data VH(bb) (best fit) VZ
t t Z+bb Z+bl Z+cc Z+cl Uncertainty Pre-fit background
=1.0) µ VH(bb) (
ATLASPreliminary Ldt = 4.7 fb-1
∫
= 7 TeV s
Ldt = 20.3 fb-1
∫
= 8 TeV s
<90 GeV V 2 lep., 3 jets, 2 tags, pT
[GeV]
mbb
50 100 150 200 250
Data/MC 0.5
1
1.5 50 100 150 200 250
Events
10 20 30 40 50 60 70 80
Data VH(bb) (best fit) VZ
t t Z+bb Z+bl Z+cc Z+cl Uncertainty Pre-fit background
=1.0) µ VH(bb) (
ATLASPreliminary Ldt = 4.7 fb-1
∫
= 7 TeV s
Ldt = 20.3 fb-1
∫
= 8 TeV s
<120 GeV V 2 lep., 3 jets, 2 tags, 90<pT
[GeV]
mbb
50 100 150 200 250
Data/MC 0.5
1 1.5
50 100 150 200 250
Events
10 20 30 40 50
Data VH(bb) (best fit) VZ
t t Z+bb Z+bl Z+cc Z+cl Uncertainty Pre-fit background
=1.0) µ VH(bb) (
ATLASPreliminary Ldt = 4.7 fb-1
∫
= 7 TeV s
Ldt = 20.3 fb-1
∫
= 8 TeV s
<160 GeV V 2 lep., 3 jets, 2 tags, 120<pT
[GeV]
mbb
50 100 150 200 250
Data/MC 0.5
1
1.5 50 100 150 200 250
Events
2 4 6 8 10 12 14 16 18 20 22
Data VH(bb) (best fit) VZ
t t Z+bb Z+bl Z+cc Z+cl Uncertainty Pre-fit background
=1.0) µ VH(bb) (
ATLASPreliminary Ldt = 4.7 fb-1
∫
= 7 TeV s
Ldt = 20.3 fb-1
∫
= 8 TeV s
<200 GeV V 2 lep., 3 jets, 2 tags, 160<pT
[GeV]
mbb
50 100 150 200 250
Data/MC 0.5
1 1.5
50 100 150 200 250
Events
2 4 6 8 10 12 14 16 18 20
22 Data
VH(bb) (best fit) VZ Z+bb Z+bl Z+cc Z+cl Z+l Uncertainty Pre-fit background
=1.0) µ VH(bb) (
ATLASPreliminary Ldt = 4.7 fb-1
∫
= 7 TeV s
Ldt = 20.3 fb-1
∫
= 8 TeV s
>200 GeV V 2 lep., 3 jets, 2 tags, pT
[GeV]
mbb
50 100 150 200 250
Data/MC 0.5
1 1.5