ATLAS-CONF-2012-060 06June2012
ATLAS NOTE
ATLAS-CONF-2012-060
June 6, 2012
Search for the Standard Model Higgs boson in the H → WW
(∗)→ ℓνℓν decay mode using Multivariate Techniques with 4.7 fb
−1of ATLAS data
at √
s = 7 TeV
The ATLAS Collaboration
Abstract
A search for the Standard Model Higgs boson in the
H→WW(∗)→ℓνℓν(ℓ
= e, µ)decay mode using multivariate techniques is presented. The search is performed using proton-proton collision data corresponding to an integrated luminosity of 4.7 fb
−1at a centre-of-mass energy of 7 TeV collected during 2011 with the ATLAS detector at the Large Hadron Collider. No significant excess of events over the expected background is observed. An upper bound is placed on the Higgs boson production cross section as a function of its mass. A Standard Model Higgs boson with a mass in the range be- tween 130 GeV and 281 GeV is excluded at the 95% confidence level, while the expected exclusion range is 127 GeV
≤mH≤255 GeV.
c Copyright 2012 CERN for the benefit of the ATLAS Collaboration.
Reproduction of this article or parts of it is allowed as specified in the CC-BY-3.0 license.
1 Introduction
The Higgs boson is the only elementary particle in the Standard Model (SM) of particle physics that has not yet been observed. It is intimately related to the Higgs mechanism [1–3] which in the SM gives mass to all other massive elementary particles. The search for this particle is a centrepiece of the Large Hadron Collider (LHC) physics programme.
Indirect limits on the Higgs boson mass of m
H <158 GeV at 95% confidence level (CL) have been set using global fits to precision electroweak results [4]. Direct searches at LEP and the Tevatron have excluded at 95% CL a SM Higgs boson with a mass below 114.4 GeV [5] and in the regions 100 GeV
<m
H <106 GeV and 147 GeV
<m
H<179 GeV [6], respectively.
The results of searches in various channels using proton-proton (pp) collision data corresponding to an integrated luminosity of approximately 5 fb
−1have been reported recently by both the ATLAS and the CMS Collaborations [7,8], excluding the mass ranges between 110.0 and 117.5 GeV, between 118.5 and 122.5 GeV, and between 127.5 and 600 GeV.
ATLAS has reported a number of results in the H
→WW
(∗)→ℓνℓνchannel (with
ℓ =e, µ). The most recent result [9] is based on all of the data recorded in 2011, corresponding to an integrated luminosity of 4.7 fb
−1, and excludes a SM Higgs boson in the range of 133 GeV
≤m
H ≤261 GeV.
These results are obtained by using a transverse mass variable, m
T, as a discriminant.
In this Note, also based on the 4.7 fb
−1dataset, the results of Ref. [9] are extended by using two multivariate analyses: a boosted decision tree (BDT) technique [10] and a matrix element (ME) method. The multivariate analyses build upon the m
Tfit approach, using the same simulated samples, object selection criteria and statistical treatment, and utilize the correlations among discriminant vari- ables. Of the two methods, BDT yields the better expected sensitivity and is used to obtain the results of this Note. The ME method is sensitive to different aspects of the event kinematics and is used to support the BDT results. A similar search has been performed by the CMS Collaboration [11] using the BDT technique. ATLAS plans to use both the BDT and the ME techniques with 2012 data to search for the Higgs boson in the H
→WW
(∗)→ℓνℓνchannel.
The data and simulated samples are summarised in Section 2, while Section 3 details the object and event selection criteria. Section 4 describes the two multivariate techniques. Section 5 discusses the use of data control samples to estimate the dominant backgrounds, and Section 6 summarizes the sources of systematic uncertainty. Section 7 presents the results of the analyses and compares them with the results of the m
Tfit analysis.
2 Data and Simulated Samples
The data used for these analyses were collected in 2011 using the ATLAS detector, a multi-purpose particle physics experiment with a forward-backward symmetric cylindrical geometry and near 4
πcoverage in solid angle [12]. It consists of an inner tracking detector surrounded by a thin super- conducting solenoid, electromagnetic and hadronic calorimeters, and an external muon spectrometer incorporating large superconducting air-core toroid magnets. The combination of these systems pro- vides charged particle measurements together with highly efficient and precise lepton measurements over the pseudorapidity
1range
|η|<2.5. Jets are reconstructed over the full coverage of the calorime-
1ATLAS uses a right-handed coordinate system with its origin at the nominal interaction point (IP) in the centre of the detector and thez-axis along the beam line. Thex-axis points from the IP to the centre of the LHC ring, and they-axis points upwards. Cylindrical coordinates (r, φ) are used in the transverse plane,φbeing the azimuthal angle around the beam pipe. The pseudorapidity is defined in terms of the polar angleθasη=−ln tan(θ/2).
ters,
|η|<4.9, and this calorimeter coverage provides a precise measurement of the missing transverse momentum.
The data were collected using inclusive single-muon and single-electron triggers. The single- muon trigger required the transverse momentum of the muon with respect to the beam line, p
T, to exceed 18 GeV; for the single-electron trigger the threshold varied from 20 to 22 GeV. The trigger ob- ject quality requirements were tightened throughout the data-taking period to cope with the increasing instantaneous luminosity.
In these analyses, the signal contributions that are considered include the dominant gluon fusion production process (gg
→H, denoted as ggF), the vector-boson fusion production process (qq
′ →H, denoted as VBF) and the Higgs-strahlung process (qq
′ →W H, ZH, denoted as W H/ZH).
For the decay of the Higgs boson, only the H
→WW
(∗)→ℓνℓνmode is considered, with final states featuring two charged leptons (ℓ
=e, µ, including small contributions from leptonic
τdecays). The branching fraction for this decay, as a function of m
H, is taken from the HDECAY [13] program.
The signal cross section is computed to next-to-next-to-leading order (NNLO) [14–19] in QCD for the ggF process. Next-to-leading order (NLO) electroweak (EW) corrections are also applied [20,21], as well as QCD soft-gluon resummations up to next-to-next-to-leading log (NNLL) [22]. These calcu- lations are detailed in Refs. [23–25], and assume factorisation between QCD and EW corrections. Full NLO QCD and EW corrections [26–28] and approximate NNLO QCD corrections [29] are used to calculate the cross sections for VBF signal production. The cross sections of the associated W H/ZH production processes are calculated up to NNLO QCD corrections [30, 31], with NLO EW radiative corrections [32] applied.
The ggF and VBF processes are modelled using the POWHEG [33,34] Monte Carlo (MC) genera- tor, interfaced to PYTHIA [35] for showering and hadronisation; the ggF Higgs boson p
Tspectrum is reweighted to agree with the prediction from HqT [36]. The associated W H/ZH production processes are modelled using PYTHIA.
ALPGEN [37], interfaced to HERWIG [38] with the MLM matching scheme [39] is used to model the production of W and Z/γ
∗bosons decaying to charged leptons in association with jets (the latter is also referred to below as the Drell-Yan process). MC@NLO [40] is used to model t¯ t and WW production, using HERWIG for the parton hadronisation; an additional contribution to the continuum WW background from gluon-initiated diagrams is modelled using gg2WW [41] interfaced to HER- WIG. Wherever parton showering is performed by HERWIG, JIMMY [42] is used for the simulation of the underlying event. SHERPA [43] is used for the generation of ZZ final states while MC@NLO is chosen for WZ production. Wγ production is modelled with ALPGEN while MadGraph [44, 45] is employed for Wγ
∗[46]. AcerMC [47], using PYTHIA for showering and hadronisation, is used for the generation of single top events in all three production channels (s-channel, t-channel, and Wt).
The CT10 parton distribution function (PDF) set [48] is used for the MC@NLO samples, CTEQ6L1
[49] for the ALPGEN, SHERPA, and MadGraph samples, and MRSTMCal [50] for the PYTHIA and
AcerMC samples. Acceptances and efficiencies are based on a full simulation [51] of the ATLAS
detector using GEANT4 [52]. This includes a realistic treatment of the event pile-up conditions (the
data are affected by the detector response to multiple pp collisions occurring in the same or in differ-
ent bunch crossings) present in the 2011 data; from the first 2.3 fb
−1to the last 2.4 fb
−1of data taken,
the average number of pp interactions per bunch crossing increased from 6.3 to 11.6.
3 Event Selection
The event selection criteria are the similar to those used in Ref. [9], with a few differences that are specified below.
Events are required to have a primary vertex that is consistent with the beam spot position, with at least three associated tracks with p
T >400 MeV. Overall quality criteria are applied in order to suppress non-collision backgrounds such as cosmic-ray muons, beam-related backgrounds, or noise in the calorimeters.
H
→WW
(∗)→ℓνℓν(ℓ
=e, µ) candidates are pre-selected by requiring exactly two oppositely charged leptons with p
Tthresholds of 25 GeV and 15 GeV for the leading and sub-leading lepton, respectively. For muons, the range
|η| <2.40 is used; for electrons, the range
|η| <2.47 is used, with the region 1.37
<|η|<1.52 (corresponding to the boundary between calorimeter cryostats) excluded.
The selected electron candidates are reconstructed using a combination of tracking and calorimetric information [53], while the muon candidates are identified by matching tracks reconstructed in the inner detector to those reconstructed in the muon spectrometer [54]. At least one of the selected lep- tons is required to match a triggering object. Leptons from heavy-flavour decays and jets satisfying the lepton identification criteria are suppressed by requiring the leptons to be isolated: the scalar sum of the p
Tof charged particles and of the calorimeter energy deposits within
∆R= p∆φ2+ ∆η2 =
0.3 of the lepton direction are each required to be less than approximately 0.15 times the lepton p
T, with slight differences between track- and calorimeter-based criteria and between electrons and muons.
The Drell-Yan production of Z/γ
∗or
Υresonances leads to two same-flavour, opposite-sign high- p
Tleptons. In the ee and
µµchannels this background is suppressed by requiring the dilepton invariant mass to be greater than 12 GeV and to di
ffer from the Z-boson mass m
Zby at least 15 GeV. In the eµ channel, the dilepton invariant mass is required to be greater than 10 GeV.
Multijet and Drell-Yan backgrounds are suppressed by requiring large E
missT. The E
missTis the magnitude of
pmissT, the opposite of the vector sum of the reconstructed objects’ transverse momenta, including identified muons, electrons, photons, jets, and clusters in the calorimeter not associated with these objects. The quantity E
T,relmissused in this analysis is defined as: E
missT,rel=E
missTsin
∆φmin, with
∆φmin ≡
min(∆φ,
π2). Here,
∆φis the absolute azimuthal angular difference between the E
missTvector and the nearest lepton or jet with p
T>25 GeV. For the ee and
µµchannels, the multijet and Drell-Yan events are suppressed by requiring E
missT,rel >45 GeV. For the eµ channel, Drell-Yan events originate predominantly from the
ττproduction channel, where the small leptonic
τdecay branching fractions lead to a much smaller background. In this channel. the requirement is relaxed to E
missT,rel >25 GeV.
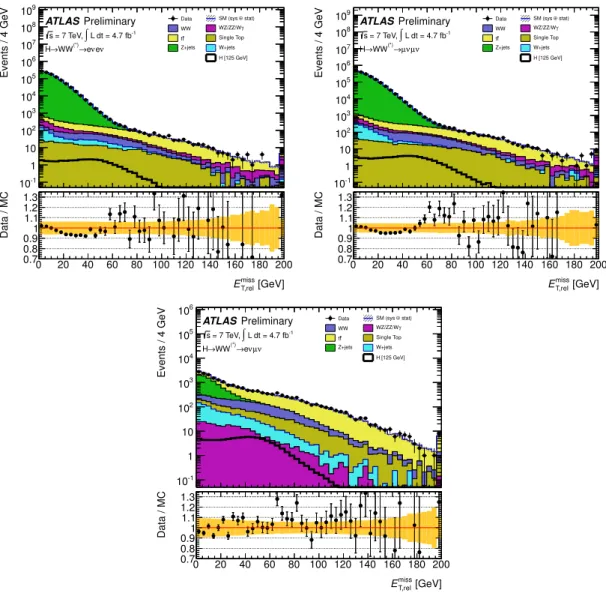
After the isolation and E
missT,relcuts, the multijet background is found to be negligible. As can be observed in Figure 1, the distribution of the E
T,relmissvariable is described well by the sum of the predicted backgrounds. For this Figure, all the backgrounds are estimated using the MC simulation except the W+jets background which is estimated using a data-driven approach as described in Section 5.4.
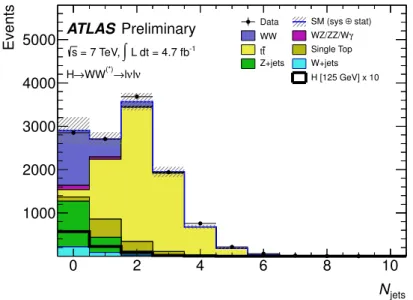
Figure 2 shows the multiplicity distribution of jets reconstructed using the anti-k
talgorithm [55], with radius parameter R
=0.4, for all events satisfying the pre-selection criteria described above.
Only jets with p
T >25 GeV and
|η| <4.5 are selected. This threshold is increased to 30 GeV in
the region 2.75
< |η| <3.25, which corresponds to a boundary between two calorimeter systems
and is more sensitive to reconstruction issues arising from event pile-up. The background rate and
composition depend significantly on jet multiplicity, as does the signal topology: in events with no
jets, the signal originates almost entirely from the ggF process and the background is dominated by
WW and Drell-Yan events. In contrast, when produced in association with two or more jets, the signal
Events / 4 GeV
10-1
1 10 102
103
104
105
106
107
108
109
Data SM (sys ⊕ stat)
WW WZ/ZZ/Wγ
t
t Single Top
Z+jets W+jets H [125 GeV]
ATLASPreliminary
L dt = 4.7 fb-1
∫
= 7 TeV, s
ν νe
→e WW(*)
→ H
[GeV]
T,rel
Emiss
0 20 40 60 80 100 120 140 160 180 200
Data / MC
0.7 0.8 0.91.11 1.2 1.3
Events / 4 GeV
10-1
1 10 102
103
104
105
106
107
108
109 Data SM (sys ⊕ stat)
WW WZ/ZZ/Wγ
t
t Single Top
Z+jets W+jets H [125 GeV]
ATLASPreliminary
L dt = 4.7 fb-1
∫
= 7 TeV, s
ν µ ν µ (*)→
→WW H
[GeV]
T,rel
Emiss
0 20 40 60 80 100 120 140 160 180 200
Data / MC
0.7 0.8 0.91.11 1.2 1.3
Events / 4 GeV
10-1
1 10 102
103
104
105
106
Data SM (sys ⊕ stat)
WW WZ/ZZ/Wγ
t
t Single Top
Z+jets W+jets H [125 GeV]
ATLASPreliminary
L dt = 4.7 fb-1
∫
= 7 TeV, s
ν µ ν
→e WW(*)
→ H
[GeV]
T,rel
Emiss
0 20 40 60 80 100 120 140 160 180 200
Data / MC
0.7 0.8 0.91.11 1.2 1.3
Figure 1: The E
missT,reldistributions for the ee (top left),
µµ(top right), and eµ (bottom) channels with
the lepton p
Tand minimum m
ℓℓrequirements applied. The expected signal for a SM Higgs boson
is shown for m
H =125 GeV. The final bin includes the overflow. The lower pane in each plot
shows the bin-by-bin data/MC ratio; the shaded error band includes both MC statistical and systematic
uncertainties.
contains a much larger contribution from the VBF process
2and the background is dominated by t t ¯ production. To enhance the sensitivity, further selection criteria that depend on the jet multiplicity are therefore applied to the pre-selected sample. The data are subdivided into 0-jet, 1-jet and 2-jet channels according to the jet counting defined above, with the 2-jet channel also including events with higher jet multiplicities. The different selections for these channels are described in more detail below.
Njets
0 2 4 6 8 10
Events
1000 2000 3000 4000 5000
Data SM (sys ⊕ stat)
WW WZ/ZZ/Wγ
t
t Single Top
Z+jets W+jets H [125 GeV] x 10
ATLAS Preliminary
L dt = 4.7 fb-1
∫
= 7 TeV, s
ν νl
→l WW(*)
→ H
Figure 2: Multiplicity of jets within the acceptance described in the text, after the cut on E
missT,rel. The shaded region indicates the total uncertainty on the background prediction. The expected signal for a SM Higgs boson with m
H =125 GeV is superimposed (multiplied by a factor of 10 for better visibility).
In the 0-jet channel, the magnitude p
ℓℓTof the transverse momentum of the dilepton system,
pℓℓT = pℓ1T +pℓ2T, is required to be greater than 30 GeV for the eµ channel and greater than 45 GeV for the ee and
µµchannels. This improves the rejection of the Drell-Yan background.
In the 1-jet channel, backgrounds from top quark decays are suppressed by rejecting any event containing a b-tagged jet, as determined using a b-tagging algorithm which uses a combination of impact parameter significance and secondary vertexing information and exploits the topology of weak decays of b- and c-hadrons [56]. The algorithm is tuned to achieve an 80% b-jet identification ef- ficiency for t¯ t events while yielding a light-jet tagging rate of approximately 6% [57, 58]. The total transverse momentum, defined as the magnitude of the vector sum
ptotT =pℓ1T +pℓ2T +pjT+pmissT, is re- quired to be smaller than 30 GeV in order to suppress Drell-Yan, t¯ t and single top background events with jets with p
Tbelow threshold. To reduce Z
→ ττbackground, the
ττinvariant mass, m
ττ, is computed under the assumption that the reconstructed leptons are
τdecay products, that the neutrinos produced in the
τdecays are collinear with the leptons [59], and that they are the only source of E
missT. Events with
|m
ττ −m
Z| <25 GeV are rejected if the energy fractions carried by the putative visible decay products are positive (the collinear approximation does not always yield physical solutions).
The 2-jet selection follows the 1-jet selection described above (with the p
totTdefinition modified to include all selected jets). In addition, the following jet-related cuts are applied: the two highest-p
Tjets
2For example,∼87% of selected signal events in the 2-jet channel originate via the VBF process.
in the event, the “tag” jets, are required to lie in opposite pseudorapidity hemispheres (η
j1×ηj2 <0), with no additional jet within
|η| <3.2; the two tag jets must be separated in pseudorapidity by a distance
|∆ηjj|of at least 3.8 units; finally, the invariant mass of the two tag jets, m
jj, must be at least 500 GeV.
Due to spin correlations in the WW
(∗)system arising from the spin-0 nature of the Higgs boson, the charged leptons tend to emerge from the interaction point in the same direction. This feature results in the dilepton invariant mass, m
ℓℓ, being small. Consequently, in all jet channels, m
ℓℓis required to be less than 80 GeV (the
|m
ℓℓ−m
Z|>15 GeV cut is always applied for the same-flavour channels). In the 2-jet channel, an additional cut is applied on the azimuthal angular difference between the leptons,
∆φℓℓ
, which is required to be less than 1.8 radians
3. For m
H ≥200 GeV, the leptons tend to have higher p
Tand larger angular separation. Therefore, the m
ℓℓand
∆φℓℓcriteria are omitted in this Higgs mass region. In the following, the selections for m
H <200 GeV and m
H >=200 GeV are referred to as low m
Hand high m
Hselections, respectively.
The predicted numbers of events from signal (m
H =125 GeV) and background sources at each stage of the low m
Hselection are presented in Table 1.
4 Multivariate Techniques
As mentioned in Section 1, two multivariate analyses (MVAs) are used in this search, namely, a BDT and a ME technique. The MVAs take advantage of correlations among the discriminant variables, thereby enhancing the search sensitivity with respect to a cut-based analysis. In this case, the MVAs are employed in the 0-jet and 1-jet channels only. In the 2-jet channel, a cut-based analysis [9] is used.
The two multivariate methods are described below.
4.1 The Boosted Decision Tree (BDT) technique
A decision tree is a collection of cuts used to classify events as signal or background. The input events are successively split using a set of discriminant variables. At each split, the algorithm finds the variable and the optimal cut on this variable that give the best separation between signal and background. The tree is complete after a specified number of splits, at which point it contains event subsamples or leaves, with each leaf having predominantly signal or background events. A signal event is correctly classified if it is in a signal-like leaf, and similarly for background events. A second tree is then grown to correctly classify the signal or background events that were misclassified by the first tree. Such events are given an increased weight relative to correctly classified events, so that the second tree focuses on previously misclassifed events. This process is repeated until a specified number of trees have been grown. A weighted average is taken from all trees to form a BDT output discriminant, which ranges from -1 to
+1.In this analysis, four kinematic variables are used to distinguish between expected Higgs signal and backgrounds in the 0-jet and 1-jet channels: m
ℓℓ, p
ℓℓT,
∆φℓℓand a transverse mass variable m
T[60], defined as:
m
T = q(E
Tℓℓ+E
missT)
2− |pℓℓT +pmissT |2,3ThemT fit analysis reported in Ref. [9] requiresmℓℓto be less than 50 GeV and uses the∆φℓℓcriterion in all three jet categories. The multivariate analyses use the loosermℓℓselection, and avoids the∆φℓℓcriterion in the 0-jet and 1-jet categories, to minimize event elimination at this stage.
where E
ℓℓT = q|pℓℓT|2+
m
2ℓℓ. These variables have all been used in the transverse mass fit analysis [9]
and are well understood.
Two independent BDTs are trained in each of the 0-jet and 1-jet channels: one with the ee and
µµfinal states together and one with the eµ final state. BDTs are trained separately for each Higgs mass hypothesis. The SM background processes trained against are WW, WZ, ZZ, t¯ t, single top, and Z/γ
∗+jets4. Both the signal and the backgrounds input to training are normalized to SM expectations.
One thousand trees are grown for each training, each tree having two splits.
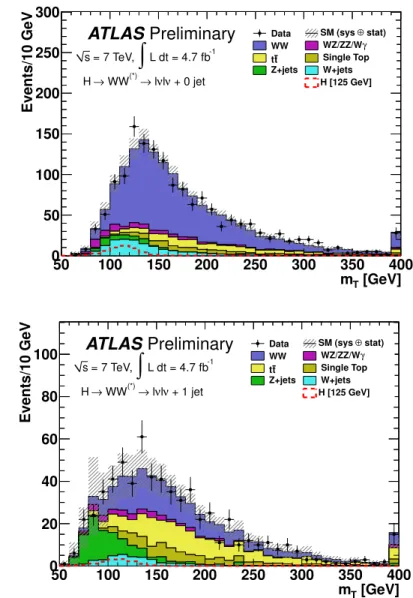
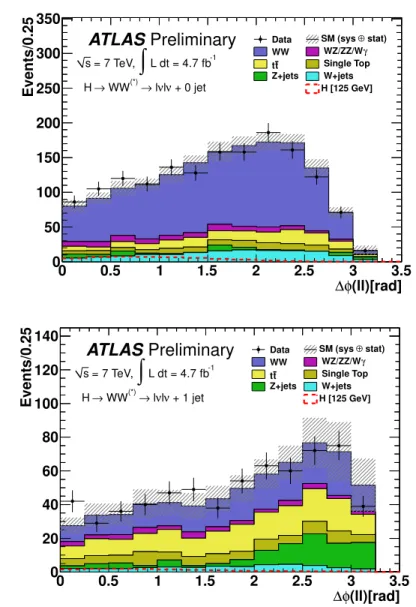
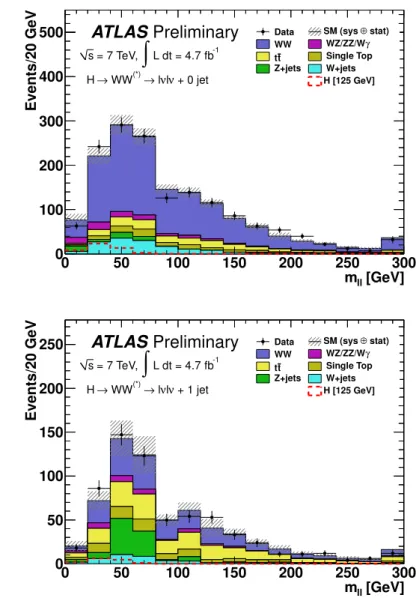
Figures 3-6 show distributions of m
T,
∆φℓℓm
ℓℓand p
ℓℓTin the 0-jet and 1-jet channels after all event selection criteria except the m
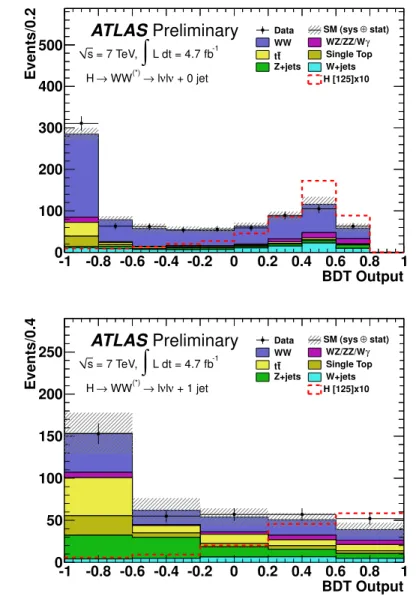
ℓℓcut. The backgrounds are estimated with MC simulation except for W+jets which is estimated using a data-driven approach, and the WW, top, and Drell-Yan back- grounds which are normalised to data in control regions. BDT output distributions in the 0-jet and 1-jet channels for events passing all low-m
Hselection criteria are shown in Figure 7.
4.2 The Matrix Element (ME) technique
In the Matrix Element technique, each event is tested against signal and background hypotheses based on fully differential cross section calculations for each process using MadGraph. The differential cross section is integrated over the allowable phase space of the undetected neutrinos. The resulting probability density function is evaluated for candidate events to obtain parton level event probability densities P
sand P
bfor the signal and background hypotheses, respectively. The background processes used are continuum WW production in both the 0-jet and 1-jet channels and, in addition, t t ¯ in the 1-jet channel. In the 0-jet channel, the momenta of the two leptons are used to compute the probability densities, while the leading jet momentum is additionally used in the 1-jet channel. The probability densities are combined into an event probability discriminant EPD
=P
s/(Ps +P
b), which ranges from 0 to
+1.The salient feature of the ME method is that the discriminant is calculated from first principles.
In practice, the calculation of the probability densities is rendered tractable with some simplifying assumptions. P
sand P
bcan be expressed as a product of the squared matrix element
|M
|2and the phase-space factor dΦ convolved with the parton distribution functions f (q
1) and f (q
2), as shown in Eq. 1. The evolution of the parton-level configuration
yinto a reconstructed event x in the detector is modeled by a transfer function T( x, y).
P(x)
=1
σZ
dΦ (y)dq
1dq
2f (q
1) f (q
2)
|M(y)
|2T (x, y)dy (1) Transfer functions improve the sensitivity of the method when the detector resolution for energy or angle measurements is not negligible. Since lepton momenta and jet angles are well measured by ATLAS, their transfer functions are taken to be
δ-functions. The transfer function for jet energywith respect to partonic energy is described by a double Gaussian function that parameterizes the jet response in fully simulated MC events.
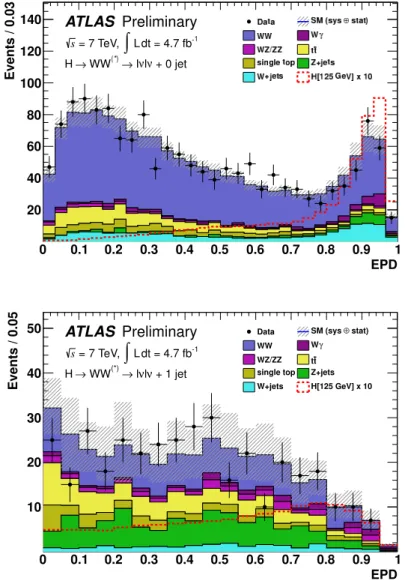
EPD distributions in the 0-jet and 1-jet channels for events passing all event selection criteria are shown in Figure 8.
4Low-mass Drell-Yan events, having a lepton pair with 10 GeV<mℓℓ<40 GeV, are not used in BDT training.
[GeV]
mT
50 100 150 200 250 300 350 400
Events/10 GeV
0 50 100 150 200 250 300
Data SM (sys ⊕ stat) WW WZ/ZZ/Wγ
t
t Single Top
Z+jets W+jets H [125 GeV]
Preliminary ATLAS
L dt = 4.7 fb-1
∫
= 7 TeV, s
+ 0 jet ν νl
→ l WW(*)
→ H
[GeV]
mT
50 100 150 200 250 300 350 400
Events/10 GeV
0 20 40 60 80
100 Data stat)
SM (sys ⊕ WW WZ/ZZ/Wγ
t
t Single Top
Z+jets W+jets H [125 GeV]
Preliminary ATLAS
L dt = 4.7 fb-1
∫
= 7 TeV, s
+ 1 jet ν νl
→ l WW(*)
→ H
Figure 3: m
Tdistribution in the 0-jet (top) and 1-jet (bottom) channels for events satisfying all selec-
tion criteria except the cut on m
ℓℓ. The lepton flavours are combined. The expected signal for a SM
Higgs boson with m
H =125 GeV is superimposed. The final bin includes the overflow. The hashed
area indicates the total uncertainty on the background prediction.
(ll)[rad]
φ
0 0.5 1 1.5 2 2.5 ∆3 3.5
Events/0.25
0 50 100 150 200 250 300 350
Data SM (sys ⊕ stat) WW WZ/ZZ/Wγ
t
t Single Top
Z+jets W+jets H [125 GeV]
Preliminary ATLAS
L dt = 4.7 fb-1
∫
= 7 TeV, s
+ 0 jet ν νl
→ l WW(*)
→ H
(ll)[rad]
φ
0 0.5 1 1.5 2 2.5 ∆3 3.5
Events/0.25
0 20 40 60 80 100 120 140
Data SM (sys ⊕ stat) WW WZ/ZZ/Wγ
t
t Single Top
Z+jets W+jets H [125 GeV]
Preliminary ATLAS
L dt = 4.7 fb-1
∫
= 7 TeV, s
+ 1 jet ν νl
→ l WW(*)
→ H
Figure 4:
∆φℓℓdistribution in the 0-jet (top) and 1-jet (bottom) channels, for events satisfying all
selection criteria except the cut on m
ℓℓ. The lepton flavours are combined. The expected signal for a
SM Higgs boson with m
H =125 GeV is superimposed. The hashed area indicates the total uncertainty
on the background prediction.
[GeV]
mll
0 50 100 150 200 250 300
Events/20 GeV
0 100 200 300 400
500 Data SM (sys ⊕ stat)
WW WZ/ZZ/Wγ t
t Single Top
Z+jets W+jets H [125 GeV]
Preliminary ATLAS
L dt = 4.7 fb-1
∫
= 7 TeV, s
+ 0 jet ν νl
→ l WW(*)
→ H
[GeV]
mll
0 50 100 150 200 250 300
Events/20 GeV
0 50 100 150 200
250 Data SM (sys ⊕ stat)
WW WZ/ZZ/Wγ t
t Single Top
Z+jets W+jets H [125 GeV]
Preliminary ATLAS
L dt = 4.7 fb-1
∫
= 7 TeV, s
+ 1 jet ν νl
→ l WW(*)
→ H
Figure 5: m
ℓℓdistribution in the 0-jet (top) and 1-jet (bottom) channels, for events satisfying all
selection criteria except the cut on m
ℓℓ. The lepton flavours are combined. The expected signal for
a SM Higgs boson with m
H =125 GeV is superimposed. The final bin includes the overflow. The
hashed area indicates the total uncertainty on the background prediction.
(ll) [GeV]
pT
0 20 40 60 80 100 120 140 160 180 200
Events/10 GeV
0 100 200 300 400 500
600 Data WW SM (sys WZ/ZZ/W⊕γ stat)
t
t Single Top
Z+jets W+jets H [125 GeV]
Preliminary ATLAS
L dt = 4.7 fb-1
∫
= 7 TeV, s
+ 0 jet ν νl
→ l WW(*)
→ H
(ll) [GeV]
pT
0 20 40 60 80 100 120 140 160 180 200
Events/10 GeV
0 20 40 60 80 100 120 140 160 180
Data SM (sys ⊕ stat) WW WZ/ZZ/Wγ
t
t Single Top
Z+jets W+jets H [125 GeV]
Preliminary ATLAS
L dt = 4.7 fb-1
∫
= 7 TeV, s
+ 1 jet ν νl
→ l WW(*)
→ H
Figure 6: p
ℓℓTdistribution in the 0-jet (top) and 1-jet (bottom) channels, for events satisfying all selec-
tion criteria except the cut on m
ℓℓ. The lepton flavours are combined. The expected signal for a SM
Higgs boson with m
H =125 GeV is superimposed. The final bin includes the overflow. The hashed
area indicates the total uncertainty on the background prediction.
BDT Output -1 -0.8 -0.6 -0.4 -0.2 0 0.2 0.4 0.6 0.8 1
Events/0.2
0 100 200 300 400 500
Data SM (sys ⊕ stat) WW WZ/ZZ/Wγ
t
t Single Top
Z+jets W+jets H [125]x10
Preliminary ATLAS
L dt = 4.7 fb-1
∫
= 7 TeV, s
+ 0 jet ν νl
→ l WW(*)
→ H
BDT Output -1 -0.8 -0.6 -0.4 -0.2 0 0.2 0.4 0.6 0.8 1
Events/0.4
0 50 100 150 200 250
Data SM (sys ⊕ stat) WW WZ/ZZ/Wγ
t
t Single Top
Z+jets W+jets H [125]x10
Preliminary ATLAS
L dt = 4.7 fb-1
∫
= 7 TeV, s
+ 1 jet ν νl
→ l WW(*)
→ H
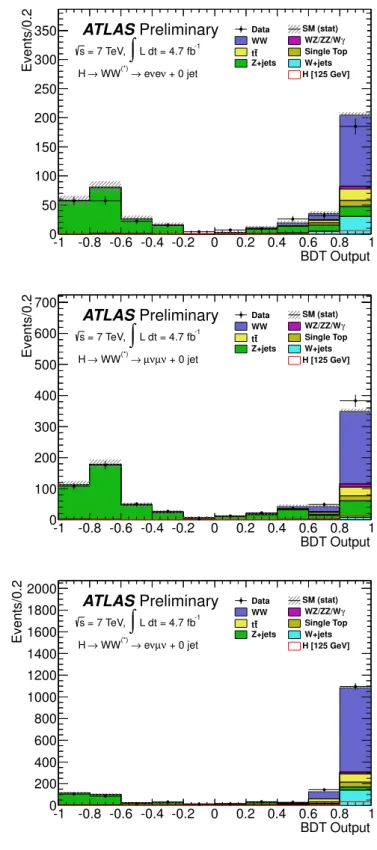
Figure 7: BDT output weight distributions for Higgs signal and background events satisfying all selection criteria in the 0-jet (top) and 1-jet (bottom) channels corresponding to m
H=125 GeV. The lepton flavours are combined. The signal has been multiplied by a factor of 10 for better visibility.
The number of bins in each distribution corresponds to that used in the statistical treatment.
EPD 0 0.1 0.2 0.3 0.4 0.5 0.6 0.7 0.8 0.9 1
Events / 0.05
10 20 30 40
50 Data SM (sys ⊕ stat)
WW Wγ
WZ/ZZ tt
single top Z+jets W+jets H[125 GeV] x 10
ATLAS Preliminary
dt = 4.7 fb-1
L
∫
= 7 TeV, s
+ 1 jet ν νl
→ l WW(*)
→ H
Figure 8: EPD distributions for Higgs signal and background events satisfying all selection criteria in
the 0-jet (top) and 1-jet (bottom) channels corresponding to m
H =125 GeV. The lepton flavours are
combined. The signal has been multiplied by a factor of 10 for better visibility.
5 Background Normalisation and Control Samples
The dominant backgrounds are normalised using control samples obtained from the data with selec- tions similar to those used in the signal region but with some criteria reversed or modified to create signal-depleted, background-enriched regions. This helps to reduce the sensitivity of the background predictions to the systematic uncertainties that are detailed in Section 6. In the following, such control samples are defined for the WW, Z/γ
∗+jets, top, andW+jets backgrounds.
5.1 WW control sample
The WW background MC prediction is normalised using a control region defined with the same se- lection as for the signal region except that the upper bound on m
ℓℓis replaced with a lower bound m
ℓℓ >80 GeV (m
ℓℓ >m
Z+15 GeV) for the eµ (ee and
µµ) final states. This control region is usedonly for the low m
Hselection in the 0-jet and 1-jet analyses. In the high (m
H ≥200) m
Hselection and in the 2-jet analysis, a high-statistics signal-depleted region cannot be isolated in this fashion; in these cases, the MC prediction is used.
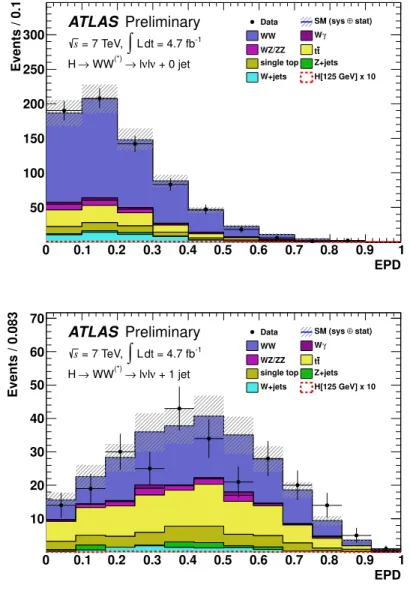
Figure 9 shows the ME EPD distributions in this control region in the 0-jet and 1-jet channels
5. The number of events in the WW control region in data agrees well with the predictions, as can be seen in Table 1. The total uncertainty on the predicted WW background in the signal region is 10%
for the 0-jet and 28% for the 1-jet analyses.
To further check the accuracy of WW event modeling in the MC, the BDT method is trained in the 0-jet channel with WW events as signal and t¯ t, single top, WZ, ZZ and Z/γ
∗+jets events asbackgrounds. The m
ℓℓand p
ℓℓTrequirements are not applied in this check. As shown in Figure 10, in all three leptonic channels the method classifies WW events as being signal-like, well separated from the dominant Z/γ
∗+jets background. Good data-MC agrement is seen in the BDT output distributions,suggesting that WW events are well modelled by the simulation.
5.2 Z/γ
∗+ jets control sample
Z/γ
∗+jets contamination in the signal region arises from events containing two real leptons and mis- measured E
missT. Since there is a discrepancy between data and MC in the E
Tmisstail, the predicted Z/γ
∗+jets background in theee and
µµchannels is corrected with a E
missTmismodelling factor. This factor is determined using control regions in both data and MC; three regions are defined in the two- dimensional plane of E
missT,reland m
ℓℓ:
•
A: E
missT,rel>45 GeV, m
ℓℓ<m
Z−15 GeV (signal region)
•
B: E
missT,rel>45 GeV,
|m
ℓℓ−m
Z|<15 GeV
•
C: E
missT,rel<45 GeV,
|m
ℓℓ−m
Z|<15 GeV The mismodelling factor F
metis then defined as:
F
met=B
dataB
data+C
dataB
MC+C
MCB
MC(2)
5The BDT output distributions in theWWcontrol region are not instructive, since the events are overwhelmingly in the most background-like bin.
EPD 0 0.1 0.2 0.3 0.4 0.5 0.6 0.7 0.8 0.9 1
Events / 0.1
50 100 150 200 250 300
Data SM (sys ⊕ stat)
WW Wγ
WZ/ZZ tt
single top Z+jets W+jets H[125 GeV] x 10
ATLAS Preliminary
dt = 4.7 fb-1
L
∫
= 7 TeV, s
+ 0 jet ν νl
→ l WW(*)
→ H
EPD 0 0.1 0.2 0.3 0.4 0.5 0.6 0.7 0.8 0.9 1
Events / 0.083
10 20 30 40 50 60 70
Data SM (sys ⊕ stat)
WW Wγ
WZ/ZZ tt
single top Z+jets W+jets H[125 GeV] x 10
ATLAS Preliminary
dt = 4.7 fb-1
L
∫
= 7 TeV, s
+ 1 jet ν νl
→ l WW(*)
→ H
Figure 9: Distributions of the ME EPD in the WW control region in the 0-jet (top) and 1-jet (bottom)
analyses. The lepton flavours are combined. The signal shown is for m
H =125 GeV, multiplied by
a factor of 10 for better visibility. The hashed area indicates the total uncertainty on the background
prediction.
BDT Output -1 -0.8 -0.6 -0.4 -0.2 0 0.2 0.4 0.6 0.8 1
Events/0.2
0 50 100 150 200 250 300
350 Data SM (stat)
WW WZ/ZZ/Wγ
t
t Single Top
Z+jets W+jets H [125 GeV]
Preliminary ATLAS
L dt = 4.7 fb-1
∫
= 7 TeV, s
+ 0 jet ν νe
→ e WW(*)
→ H
BDT Output -1 -0.8 -0.6 -0.4 -0.2 0 0.2 0.4 0.6 0.8 1
Events/0.2
0 100 200 300 400 500 600 700
Data SM (stat)
WW WZ/ZZ/Wγ
t
t Single Top
Z+jets W+jets H [125 GeV]
Preliminary ATLAS
L dt = 4.7 fb-1
∫
= 7 TeV, s
+ 0 jet ν µ ν µ
(*)→
→ WW H
BDT Output -1 -0.8 -0.6 -0.4 -0.2 0 0.2 0.4 0.6 0.8 1
Events/0.2
0 200 400 600 800 1000 1200 1400 1600 1800 2000
Data SM (stat)
WW WZ/ZZ/Wγ
t
t Single Top
Z+jets W+jets H [125 GeV]
Preliminary ATLAS
L dt = 4.7 fb-1
∫
= 7 TeV, s
+ 0 jet ν µ ν
→ e WW(*)
→ H
Figure 10: BDT output distributions in the 0-jet ee (top),
µµ(middle) and eµ (bottom) channels, the
method having been trained with WW events as signal, and t¯ t, single top, WZ, ZZ and Z/γ
∗+jets
events as backgrounds. The Higgs signal corresponding to m
H =125 GeV is shown for comparison
only and was not used in training. The shaded error band shows only the statistical uncertainty on the
predictions.
after subtracting contamination from other backgrounds in regions B and C in data. The corrected estimate of the Z/γ
∗+jets background in the signal region is thenA
corrMC =A
MC×F
met. The values of F
metthus obtained are:
•
ee
+0-jet: 0.99
±0.15
•
ee
+1-jet: 0.88
±0.17
• µµ+
0-jet: 1.13
±0.08
• µµ+
1-jet: 0.89
±0.10
where only statistical uncertainties are shown.
The Z/γ
∗+jets background in theeµ channel is small, and is estimated using the MC prediction without any scaling applied.
The total uncertainty on the Z/γ
∗+jets background amounts to 19% and 35% in the 0-jet and 1-jetcategories respectively, with all three lepton channels combined. The uncertainties include the statis- tical uncertainty on F
metas well as theoretical and experimental systematic uncertainties described in Section 6.
5.3 Top control sample
In the 0-jet signal region, the estimated number of top quark background events is extrapolated from the number of events satisfying the pre-selection criteria described in Section 3. This sample is domi- nated by top quark backgrounds, as shown in Figure 2. The scale factor used to propagate the t¯ t yield from this sample to the signal region is estimated as the square of the efficiency for one top quark decay to survive the jet veto, which is determined using another control sample defined by the pres- ence of an additional b-jet. To account for the presence of single top events, a correction is computed using simulation [61]. The overall e
fficiency for the requirements on p
ℓℓTand m
ℓℓis also taken from simulation. The total uncertainty on the top quark background estimate in events with no jets is 26%.
In the 1-jet and 2-jet analyses, the top quark background MC prediction is normalised to the data using a control sample defined by reversing the b-jet veto. In the 1-jet analysis, the requirement on m
ℓℓis removed, while in the 2-jet analysis the requirements on m
ℓℓand
∆φℓℓare both removed.
The resulting samples are dominated by top quark backgrounds (both t t ¯ and single top), with little contribution from other sources. The number of events in the 1-jet and 2-jet control regions are given in Table 1. The total uncertainties on the estimated top quark background in the 1-jet and 2-jet analyses amount to 27% and 44%, respectively.
Figure 11 shows the BDT output distribution and Figure 12 the ME EPD distribution in the 1-jet top control region. Good data-MC agreement is seen in both distributions.
5.4 W + jets control sample
The W+jets background contribution is estimated using a data control sample of events where one
of the two leptons satisfies the identification and isolation criteria described in Section 3, and the
other lepton (denoted “anti-identified”) fails these criteria while satisfying a loosened selection. The
dominant contribution to this background comes from fake electrons. The W+jets contamination
in the signal region is then obtained by scaling the number of events in the data control sample by a
normalisation “misidentification factor”. This factor is estimated as a function of anti-identified lepton
p
Tusing an inclusive dijet data sample, after subtracting the residual contributions from real leptons
BDT Output -1 -0.8 -0.6 -0.4 -0.2 0 0.2 0.4 0.6 0.8 1
Events/0.4
1 10 102
103
104
Data SM (sys ⊕ stat) WW WZ/ZZ/Wγ
t
t Single Top
Z+jets W+jets H [125]x10
Preliminary ATLAS
L dt = 4.7 fb-1
∫
= 7 TeV, s
+ 1 jet ν νl
→ l WW(*)
→ H
Figure 11: BDT output distribution in the 1-jet top control region, defined by requiring a b-tagged jet.
The lepton flavours are combined. The signal shown is for m
H =125 GeV, multiplied by a factor of 10 for better visibility. The hashed area indicates the total uncertainty on the background prediction.
arising from leptonic W and Z decays. The W candidates are identified by requiring the transverse mass m
WT =q
2p
ℓTE
Tmiss·(1
−cos
∆φ) to satisfym
WT >30 GeV. In this expression, p
ℓTis the lepton transverse momentum and
∆φis the difference in azimuth between the lepton and missing transverse momentum directions. The Z candidates are identified requiring two opposite-sign leptons of the same flavour and
|m
ℓℓ−m
Z|<15 GeV. The small remaining lepton contamination, which includes Wγ and Wγ
∗events, is subtracted using MC simulation.
The uncertainty on the misidentification factor is the main uncertainty on the W+jets background contribution. This uncertainty is dominated by differences in jet properties between dijet and W+jets samples evaluated with simulated events, with smaller contributions originating from trigger effects and the subtraction of the contribution from real leptons from leptonic W and Z decays. The total uncertainty on this background is estimated to be approximately 50%.
6 Systematic Uncertainties
Theoretical uncertainties on the signal production cross sections are determined following Refs. [62, 63]. QCD renormalisation and factorisation scales are varied up and down independently by a factor of two. Independent uncertainties on the ggF signal production are assumed for the inclusive cross section, the cross section for production with at least one jet and with at least two jets. The resulting uncertainties on the cross sections in exclusive jet multiplicity analyses are taken into account, as well as anti-correlations caused by transitions among jet categories. The relative 0-jet (1-jet) cross section uncertainties depend on m
H, rising from
±21% (
±31%) at m
H =125 GeV and m
H =240 GeV to
±
42% (
±31%) at m
H=600 GeV [63–65]. The scale uncertainty on both the VBF signal cross section
and the acceptance associated with the jet veto requirement, to which the 2-jet analysis is particularly
sensitive, is 4%. In the 2-jet analysis, around 25% of the signal events are produced via ggF, where
the uncertainty on the ggF signal cross section is around 25%. For m
Hlarger than 300 GeV, an
EPD 0 0.1 0.2 0.3 0.4 0.5 0.6 0.7 0.8 0.9 1
Events / 0.083
20 40 60 80 100 120 140 160
Data SM (sys ⊕ stat)
WW Wγ
WZ/ZZ tt
single top Z+jets W+jets H[125 GeV] x 10
ATLAS Preliminary
dt = 4.7 fb-1
L
∫
= 7 TeV, s
+ 1 jet ν νl
→ l WW(*)
→ H