ATLAS-CONF-2013-009 06March2013
ATLAS NOTE
ATLAS-CONF-2013-009
March 5, 2013
Search for the Standard Model Higgs boson in the H → Zγ decay mode with pp collisions at √
s = 7 and 8 TeV
The ATLAS Collaboration
Abstract
This note presents a search for the Standard Model Higgs boson in the decay channel
H →Zγ,Z →ℓ+ℓ−, where
ℓ= eor
µ, using 4.6 fb−1of proton-proton collisions at
√s =
7 TeV and 20.7 fb
−1of proton-proton collisions at
√s =8 TeV recorded with the ATLAS detector at the LHC. The distribution of the difference
∆mbetween the final state three-body invariant mass
mℓℓγand the di-lepton invariant mass
mℓℓis compared to Standard Model (SM) background expectations. No significant deviation from the SM prediction is observed and upper limits on the cross section of a Higgs boson with a mass between 120 and 150 GeV are derived. The expected exclusion limits at 95% confidence level range between 7.3 and 22 times the predicted Standard Model cross section. The observed exclusion limits range between 5.4 and 37 times the Standard Model cross section. For a Higgs boson mass of 125 GeV, the expected and observed limits are 13.5 and 18.2 times the Standard Model, respectively.
c Copyright 2013 CERN for the benefit of the ATLAS Collaboration.
Reproduction of this article or parts of it is allowed as specified in the CC-BY-3.0 license.
1 Introduction
In 2012 the ATLAS and CMS experiments announced the discovery of a Higgs-like boson [1, 2]. Its mass is measured by ATLAS to be close to 125 GeV [3]. In order to determine whether the newly discovered particle is the SM Higgs boson or a different object, it is fundamental to fully characterize its properties, including parity, spin, and decays to as many final states as possible. This note presents the search for the Standard Model Higgs boson in the decay channel H
→Zγ, Z
→ℓ+ℓ−,
1where
ℓ=e or
µ, using 20.7 fb−1of proton-proton collisions at
√s
=8 TeV and 4.6 fb
−1of proton-proton collisions at
√
s
=7 TeV recorded with the ATLAS detector at the LHC. A similar search has recently been presented by the CMS Collaboration [4].
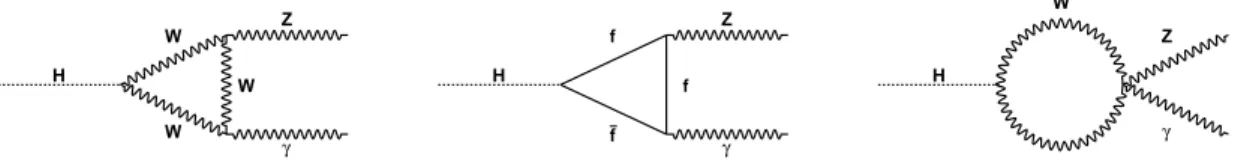
In the SM, the Higgs boson decays to Zγ via loop diagrams similar to H
→ γγ(Fig. 1) with the dominant contribution originating from the W-mediated amplitudes. For a Higgs boson mass of 125 GeV the predicted pp
→H cross section is
σ =17.5 (22.3) pb at 7 (8) TeV, and the branching ratio B(H
→Zγ)
=1.54
×10
−3[5, 6]. Including B(Z
→ℓ+ℓ−)
=6.7% [7] reduces the total cross section to 1.8 (2.3) fb, roughly similar to that of pp
→H
→ZZ
∗→4ℓ and only 5% of that of pp
→H
→γγ. Thereconstructed final state can be produced also from internal photon conversion in Higgs-boson decays to di-photons (H
→γ∗γ →ℓℓγ) or from radiation emission by leptons in Higgs-boson decays to di-leptons(H
→ℓℓ∗ →ℓℓγ) [8]. The selection applied in this study suppresses these additionalH
→ ℓℓγdecay processes.
H
W
W W
Z
γ
H
f
f f
Z
γ
H
W
Z
γ
Figure 1: Leading Feynman diagrams for the H
→Zγ decay in the Standard Model. In the case of the fermion loop, top quarks dominate.
The main backgrounds originate from Z+γ events, either from diboson production in the t, u channels (also referred to as initial-state-radiation), from final-state-radiation (FSR) in radiative Z boson decays (Z
→ ℓℓγ) or from parton-to-photon fragmentation, and production of aZ boson in association with jets, followed by a Z
→ℓℓdecay, and misidentification of a jet as a photon. Smaller contributions arise from other backgrounds (t t ¯ and W
/Zprocesses). Although the background level for H
→Zγ is reduced compared to H
→γγ, it is orders of magnitude higher than that forH
→ZZ
∗→4ℓ.
Measurements of (or limits on) the H
→Zγ decay rate can provide insight into models beyond the SM. The decay rate can help determine whether the new boson is the Higgs boson or a member of other electroweak singlets or triplets. Moreover, because the H
→Zγ decay proceeds via electroweak loop coupling to the Higgs boson, it can provide direct evidence of new heavy particles appearing there.
Some models [9, 10, 11, 12] predict significant enhancements over the SM rate. However, many of these alternative hypotheses are already severely limited by the known H
→γγ,H
→ZZ, and SM Zγ measurements [13]. Nonetheless, the measurement of H
→Zγ (and its rate compared to H
→ γγ) isimportant for extending our understanding of the Higgs mechanism.
In the following, the ATLAS detector is briefly described in Section 2, the signal and background simulation samples used in the analysis are presented in Section 3. The event selection criteria are described in Section 4. A comparison between the selected data sample and the simulation is presented in Section 5. The discrimination between signal and background events is performed by means of an
1In the following the charge of the leptons will be omitted for simplicity.
unbinned maximum likelihood fit, and the estimated signal yield is compared to the one predicted by the Standard Model. The properties of the signal, in terms of expected yields and of the signal model used for the fit, are described in Section 6, while the choice of the background model adopted in the fit is motivated in Section 7. After a description of the systematic uncertainties in Section 8, Section 9 presents the result of the combined analysis of the 7 and 8 TeV datasets.
2 The ATLAS detector
The ATLAS detector [14] is a multi-purpose particle physics detector with approximately forward- backward symmetric cylindrical geometry
2. The inner tracking detector (ID) covers
|η|<2.5 and consists of a silicon pixel detector, a silicon micro-strip detector, and a transition radiation tracker. The ID is sur- rounded by a thin superconducting solenoid providing a 2 T axial magnetic field. A high-granularity lead/liquid-argon (LAr) sampling calorimeter measures the energy and the position of electromagnetic showers with
|η| <3.2. It includes a presampler (for
|η| <1.8) and three longitudinal sampling layers up to
|η| <2.5. LAr sampling calorimeters are also used to measure hadronic showers in the end-cap (1.5
< |η| <3.2) and forward (3.1
< |η| <4.9) regions, while an iron-scintillator/tile calorimeter mea- sures hadronic showers in the central region (
|η| <1.7). The muon spectrometer (MS) surrounds the calorimeters and consists of three large superconducting air-core toroid magnets, each with eight coils, a system of precision tracking chambers (
|η| <2.7), and fast tracking chambers for triggering. A three- level trigger system selects events to be recorded for offline analysis.
3 Signal and Background simulation samples
Monte Carlo (MC) samples are used to study the properties of signal and background events and to op- timize the selection criteria. They are produced using the generators described below. Generated events are simulated using the ATLAS detector simulation [15] within the G
eant4 [16] framework. Additional pp interactions in the same and nearby bunch crossings (pile-up) are included in the simulation. The MC samples are re-weighted to reproduce the observed distribution of the mean number of interactions per bunch crossing in the data and the size of the luminous beamspot.
Samples of H
→Zγ decays are generated with POWHEG [17, 18], interfaced to PYTHIA 8.170 [19]
for showering and hadronization. Signal events are generated for Higgs boson masses between 120 and 150 GeV, in intervals of 5 GeV, at both
√s
=7 TeV and
√s
=8 TeV. In each sample, the Z boson is forced to decay to charged lepton pairs. The CT10 [20] parton distribution functions (PDFs) are used. In addition, at
√s
=8 TeV signal samples for the gluon fusion process for m
H =120, 125 or 130 GeV are generated using MCFM 6.3 [21] interfaced to PYTHIA 8.165. The comparison between the MCFM and the POWHEG samples is used to assess systematic uncertainties related to the generator-level kinematic distributions of the final state particles.
Standard Model Z+γ simulated events are generated with SHERPA 1.4.0 (at
√s
=7 TeV) and 1.4.1 (at
√s
=8 TeV) [22, 23], using the CT10 PDFs. Separate samples are produced for the eeγ and
µµγfinal states. Up to three additional partons are produced in the hard scattering processes, with matrix elements implemented at leading order (LO).
Z+jets events are generated with SHERPA 1.4.0 and ALPGEN 2.13 [24] interfaced to HERWIG 6.510 [25] for parton shower and fragmentation into particles and to JIMMY 4.31 [26] to model un- derlying event contributions, using the AUET2-CTEQ6L1 tune [27]. Separate samples are produced
2ATLAS uses a right-handed coordinate system with its origin at the nominal interaction point (IP) in the center of the detector and thez-axis along the beam pipe. Thex-axis points from the IP to the center of the LHC ring, and theyaxis points upward. Cylindrical coordinates (r, φ) are used in the transverse plane,φbeing the azimuthal angle around the beam pipe. The pseudorapidity is defined in terms of the polar angleθasη=−ln tan(θ/2).
for Z bosons decaying either to electron or muon pairs. The ALPGEN samples are generated using the CTEQ6L1 [28] PDFs, while the SHERPA samples use the CT10 ones. PHOTOS [29] is used to simulate final state QED radiation in the ALPGEN samples. In both samples the LO matrix elements for the production of up to 5 partons are used for the event generation.
Background events from the t¯ t process are generated with MC@NLO [30, 31] interfaced to HERWIG 6.510 for parton shower and fragmentation and to JIMMY 4.31 for the underlying event. The CT10 PDFs are used.
Background events from the WZ process at
√s
=7 TeV are generated with SHERPA 1.3.1 using the CTEQ6L1 PDFs. Both the W and the Z decay leptonically. Up to three partons are produced in the hard scattering. At
√s
=8 TeV, WZ events are generated with POWHEG interfaced to PYTHIA 8.165.
4 Event Selection
The analyzed data are subjected to quality requirements: events in which the ATLAS detector is not fully operational, or show data quality problems, are excluded. The resulting integrated luminosity after the trigger and data quality requirements corresponds to 20.7 fb
−1(4.6 fb
−1), with a relative uncertainty of 3.6% (1.8%) at
√s
=8 TeV (
√s
=7 TeV) [32, 33]. Unless explicitly specified, the selection criteria at
√
s
=8 TeV and
√s
=7 TeV are identical. Values quoted in parentheses correspond to the
√s
=7 TeV run period.
Data are selected using the lowest threshold, unprescaled single-lepton or di-lepton triggers. For the single-muon trigger the transverse momentum, p
T, threshold is 24 (18) GeV, while for the single-electron trigger the transverse energy, E
T, threshold is 24 (20) GeV. For the di-muon triggers the thresholds are p
T >13 (10) GeV for each muon, while for the di-electron triggers the thresholds are E
T >12 GeV for each electron. At
√s
=8 TeV an asymmetric di-muon trigger is also used with p
T1 >18 GeV and p
T2 >8 GeV. The trigger efficiency with respect to events passing the selection criteria is around 99%
in the eeγ channel and 92% in the
µµγchannel due to the reduced geometric acceptance of the muon trigger system in the
|η|<1.05 region.
Primary vertices are determined from fits to tracks reconstructed in the inner detector and consistent with a common origin. The primary vertex with the largest sum of the squared transverse momenta of the tracks associated to it is considered as the primary vertex of the hard interaction.
Muon candidates are formed starting from tracks reconstructed either in the ID or in the MS [34]. The MS extends the muon reconstruction coverage to the forward region (2.5
<|η| <2.7), which is outside of the ID acceptance. If a track is reconstructed both in the ID and in the MS, the two independent momentum measurements are combined; otherwise the momentum is measured using the ID or the MS information alone. In the center of the barrel region (
|η| <0.1), which lacks MS coverage, ID tracks with p
T >15 GeV are identified as muons using the profile of the associated energy deposits in the calorimeter. All muon candidates identified using the information from the MS are required to have transverse momentum p
T >10 GeV and
|η| <2.7, while the ones that are tagged by the calorimeters must have p
T >15 GeV and
|η| <0.1. The inner detector tracks associated to muons that are identified inside the ID acceptance are required to have a minimum number of associated hits in each of the ID sub- detectors (to ensure good track reconstruction) and to have transverse (longitudinal) impact parameter d
0(z
0), with respect to the primary vertex, smaller than 1 mm (10 mm).
The electron and photon reconstruction are seeded from clusters of energy deposits in the electromag-
netic calorimeter. The reconstruction is designed to separate electrons, unconverted photons, and pho-
tons which have converted in the detector material to electron-positron pairs. The clusters are matched
to tracks and to conversion vertex candidates, which have been reconstructed in the inner detector and
extrapolated to the second layer of the calorimeter [35]. Clusters with a matching track are classified as
electrons. Clusters without any matching track or conversion vertex are classified as unconverted photon
candidates, while the ones with a matching vertex reconstructed from one or two tracks are converted photon candidates. Tracks matched to electron candidates (and, for 8 TeV data, from photon conver- sions) and having enough associated hits in the silicon detectors are fitted using a Gaussian-Sum Filter, which accounts for bremsstrahlung energy loss [36]. The energies of the clusters are calibrated, sepa- rately for electrons, unconverted and converted photon candidates, to account for energy losses upstream of the calorimeter and for energy leakage outside of the cluster. In data, the calibration is refined by applying
η-dependent correction factors, which are of the order of±1%, determined from data-to-MC comparisons of the Z boson mass peak in Z
→e
+e
−events [37]. In addition, the energy measurement of converted photons is improved with corrections, evaluated as a function of the conversion radius (i.e. the distance from the beamline at which the photon converts into an e
+e
−pair) based on dedicated Monte Carlo simulation studies.
Electron candidates are required to have a transverse energy greater than 10 GeV, pseudorapidity
|η|<
2.47, a well-reconstructed ID track pointing to an electromagnetic calorimeter cluster. The cluster should satisfy a set of identification criteria that require the longitudinal and transverse shower profiles to be consistent with those expected for electromagnetic showers [37]. The electron four-momentum is formed using the energy measured by the calorimeter and the track azimuth and pseudorapidity measured in the inner detector. The electron track is required to have a hit in the b-layer when passing through an active b-layer module and is also required to have a longitudinal impact parameter, with respect to the primary vertex, smaller than 10 mm.
Photon candidates are required to have a transverse energy greater than 15 GeV. In order to exploit the fine segmentation of the first layer of the electromagnetic calorimeter to discriminate between genuine prompt photons and fake photons within jets, the photon candidate pseudorapidity must satisfy
|η| <1.37 or 1.52
< |η| <2.37. The photon four-momentum is formed using the energy measured by the calorimeter and the direction determined by the nominal IP and the energy-weighted barycenter of all cluster cells in the second layer of the calorimeter. Photons reconstructed near regions of the calorimeter affected by read-out or high-voltage failures are not accepted. The identification of photons is performed through a cut-based selection based on shower shapes measured in the first two longitudinal layers of the electromagnetic calorimeter and on the leakage in the hadronic calorimeter. To further suppress hadronic background, an isolation requirement is applied. The calorimeter isolation transverse energy E
isoTis estimated by summing the transverse energy of three-dimensional positive-energy topological clusters reconstructed in the electromagnetic and hadronic calorimeters in a cone of
∆R =0.4 around the photon candidate, where the region within 0.125
×0.175 in
η×φaround the photon barycenter is excluded. The isolation energy is corrected by subtracting the estimated contributions from the leakage of the photon energy outside of the excluded region and, using the technique described in Refs. [38, 39], from the underlying event and additional pp interactions. Photon candidates are required to have an isolation transverse energy of less than 4 GeV.
An overlap removal between electrons and muons that pass all selection criteria and share the same inner detector track within a cone of
∆R<0.02 is performed: if the muon is identified by the MS, then the electron candidate is discarded, otherwise the muon candidate is rejected. Photon candidates that are within
∆R<0.3 of a selected electron or muon candidate are also rejected, thus suppressing background from FSR Z+γ events.
Z boson candidates are reconstructed from pairs of same-flavor, opposite-sign leptons passing the previous selections. Muon pairs are required to have no more than one muon identified either without the MS or in the region outside the ID acceptance. In case of multiple Z candidates in the same event, the candidate with the invariant mass closest to the Z pole is selected.
Higgs boson candidates are reconstructed from the combination of the Z candidate with invariant
mass closest to the Z pole and the photon with largest transverse energy. Track and calorimeter isolation
requirements are applied to the leptons forming the Higgs boson candidate. The normalized track isola-
tion is defined as the sum of the transverse momenta of tracks,
Pp
T, inside a cone of
∆R<0.2 around the lepton, excluding the lepton track, divided by the lepton p
T. Each lepton is required to have a nor- malized track isolation smaller than 0.15. The normalized calorimetric isolation for electrons, computed as the sum of the positive-energy topological clusters with a reconstructed barycenter falling in a cone of
∆R<
0.2 around the candidate electron cluster divided by the electron E
T, must be lower than 0.2. The cells within 0.125
×0.175 in
η×φaround the electron barycenter are excluded. The calorimetric isolation E
coneTfor muons is computed from the sum of the transverse energy of the calorimeter cells inside a cone of
∆R <0.2 around the muon direction. The transverse energy of the cells inside a predefined region around the points where the muon track crosses the different layers of the calorimeters and accounts for the muon energy loss itself is subtracted. Muons are required to have a normalized calorimetric isolation E
coneT /pTless than 0.3 (0.15 in case of muons without an ID track). For both the track- and calorimeter-based isolation any contributions arising from the other lepton from the candidate Z decay are subtracted. Additional track impact significance selections are also applied to the leptons from the Z candidate decay. The transverse impact parameter significance
|d
0|/σd0of the ID track associated to leptons within the acceptance of the inner detector is required to be less than 3.5 and 6.5 for muons and electrons, respectively. The electron impact parameter is affected by bremsstrahlung and it thus has a broader distribution. The isolation criteria, as well as the impact significance selections applied in this analysis, have been optimized in the search for the SM Higgs boson in the H
→ZZ
∗→4l channel [40].
Finally, to suppress events from FSR Z
→ℓℓγ, the di-lepton invariant mass is required to be largerthan the PDG value of the Z boson mass minus 10 GeV. This requirement also reduces the contribution to the signal from internal photon conversions in H
→γγto a negligible level [41].
After applying all selection criteria, the number of H
→Zγ candidate events in the
√s
=8 TeV (
√s
=7 TeV) data sample is 13978 (1927) in the Z
→eeγ channel and 16678 (2621) in the Z
→µµγchannel. The same reconstruction algorithms and selection criteria are used for simulated events. The simulation is corrected to take into account known data-MC differences on photon and lepton efficiencies and energy or momentum resolution.
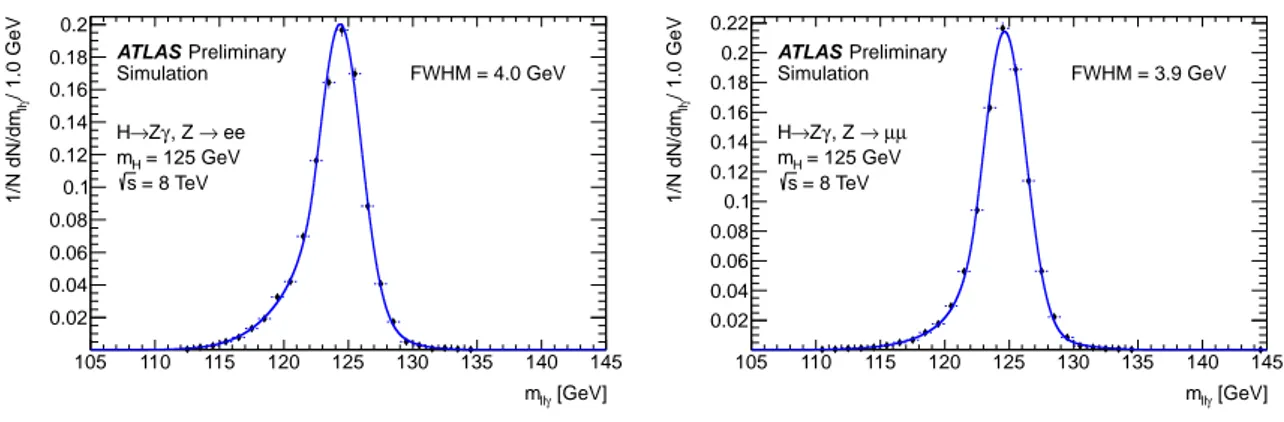
In order to improve the three-body invariant mass resolution of the Higgs boson candidate events and thus improve discrimination against non-resonant background events, two corrections are applied to the three-body mass m
ℓℓγ. First, the photon pseudorapidity
ηγand its transverse energy E
Tγ =E
γ/cosh
ηγare recalculated from the identified primary vertex and the photon impact point in the calorimeter. Second, the lepton four-momenta are recomputed by means of the Z-mass constrained kinematic fit previously used in the H
→4ℓ search [1]. The distribution of m
ℓℓγfor simulated signal events from
gg →H at m
H =125 GeV after all corrections is shown in Fig. 2.
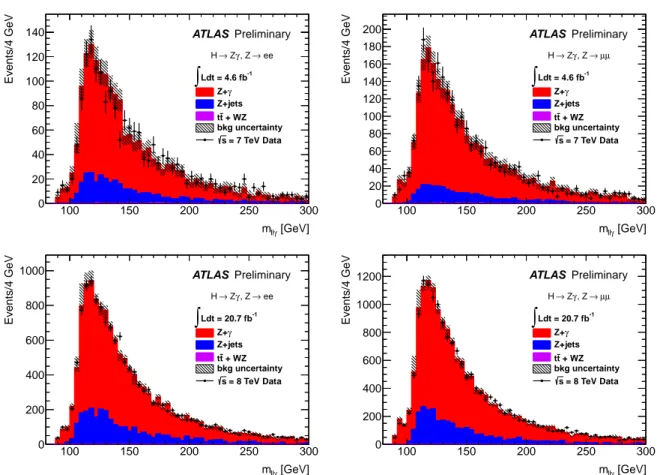
5 Data-driven background estimation
The main backgrounds in the H
→Zγ search originate from SM Z+γ and Z+jets events, with small contributions from t t ¯ and WZ events. In Z+γ events, the requirements m
ℓℓ >81.2 GeV and
∆Rℓγ >0.3 suppress the contribution from FSR, while the photon isolation requirement reduces the importance of the fragmentation component. The latter, together with the photon identification requirements, is also effective in reducing Z+jets events.
In this analysis the background composition is not used to determine the amount of expected back-
ground, which is directly fitted to the data mass spectrum, but is needed to optimize the background
modeling used in the signal extraction as described in Section 7. In this section a data-driven estimation
of the background composition is performed, based on a two-dimensional sideband method exploiting
the distribution of the photon identification and isolation variables in control regions enriched in Z+jets
events to estimate the relative Z+γ and Z+jets fractions in the selected sample. This technique was first
used by ATLAS in the measurement of the Standard Model prompt photon production cross section [42]
[GeV]
γ
mll
105 110 115 120 125 130 135 140 145
/ 1.0 GeVγll1/N dN/dm
0.02 0.04 0.06 0.08 0.1 0.12 0.14 0.16 0.18 0.2
ATLAS Preliminary Simulation
→ ee γ, Z
→Z H
= 125 GeV mH
= 8 TeV s
FWHM = 4.0 GeV
[GeV]
γ
mll
105 110 115 120 125 130 135 140 145
/ 1.0 GeVγll1/N dN/dm
0.02 0.04 0.06 0.08 0.1 0.12 0.14 0.16 0.18 0.2 0.22
ATLAS Preliminary Simulation
µ µ
→ γ, Z
→Z H
= 125 GeV mH
= 8 TeV s
FWHM = 3.9 GeV
Figure 2: Three-body invariant mass distribution for
gg →H
→Zγ selected events in the 8 TeV, m
H =125 GeV signal simulation, after applying all analysis cuts and corrections. The blue solid lines represent the fits to the points of the sum of a Crystal Ball lineshape and a Gaussian function. Left:
Z
→ee channel, right: Z
→µµchannel.
and then exploited also in the H
→γγ[43] and SM W/Z
+γ[44] measurements. The Z+γ and Z+jets contributions are estimated in situ applying the two-dimensional sideband technique to the data after sub- tracting the contribution from the t t ¯ and WZ backgrounds. The simulation is used to estimate the small backgrounds from t t ¯ and WZ (normalized to the data luminosity using the NLO MC cross sections, on which a conservative uncertainty of
±50% is applied), as well as the Z+γ contamination in the Z+jet background control regions and the correlation between photon identification and photon isolation for Z+jet events. The contribution from the H
→Zγ signal is expected to be small compared to the back- ground and is neglected in this study. The fractions of Z+γ, Z+jets and other backgrounds are estimated to be around 82%, 17% and 1% at both
√s
=7 and 8 TeV. The uncertainty on the Z+γ purity is around 5%, dominated by the uncertainty on the correlation between the photon identification and isolation in Z+jet events, which is estimated by comparing the ALPGEN and SHERPA predictions. A comparison between the three-body invariant mass distribution in data and in the simulation, where the MC back- ground distributions have been normalized to the yields estimated with the previous procedure, is shown in Fig. 3. A good agreement between data and simulation is observed in the distributions of m
ℓℓγ, as well as in the distributions of several other kinematic quantities that have also been studied.
6 Signal properties
The properties of the signal, in terms of expected yields and of the signal model used for the fit, are described in this section.
6.1 Expected signal yield
The Higgs boson cross sections, branching ratios [45, 46, 47] and their uncertainties are compiled in Refs. [5, 6]. The Higgs boson production cross sections are computed up to next-to-next-to-leading order (NNLO) [48, 49, 50, 51, 52, 53] in
αsfor the gluon fusion process. The next-to-leading order (NLO) EW corrections are applied [54, 55]. These results are compiled in Refs. [56, 57, 58] assuming factorization between QCD and EW corrections. The cross sections for the VBF process are calculated with full NLO QCD and EW corrections [59, 60, 61], and approximate NNLO QCD corrections are applied [62].
The W/ZH processes are calculated at NLO [63] and at NNLO [64] in
αs, and NLO EW radiative
corrections [65] are applied. The full NLO QCD corrections for t tH ¯ are calculated [66, 67, 68, 69].
[GeV]
γ
mll
100 150 200 250 300
Events/4 GeV
0 20 40 60 80 100 120 140
Ldt = 4.6 fb-1
∫
γZ+
Z+jets + WZ t t
bkg uncertainty = 7 TeV Data s
ATLAS Preliminary
→ ee γ, Z
→ Z H
[GeV]
γ
mll
100 150 200 250 300
Events/4 GeV
0 20 40 60 80 100 120 140 160 180 200
Ldt = 4.6 fb-1
∫
γZ+
Z+jets + WZ t t
bkg uncertainty = 7 TeV Data s
ATLAS Preliminary
µ µ
→ γ, Z
→ Z H
[GeV]
γ
mll
100 150 200 250 300
Events/4 GeV
0 200 400 600 800 1000
Ldt = 20.7 fb-1
∫
γZ+
Z+jets + WZ t t
bkg uncertainty = 8 TeV Data s
ATLAS Preliminary
→ ee γ, Z
→ Z H
[GeV]
γ
mll
100 150 200 250 300
Events/4 GeV
0 200 400 600 800 1000 1200
Ldt = 20.7 fb-1
∫
γZ+
Z+jets + WZ t t
bkg uncertainty = 8 TeV Data s
ATLAS Preliminary
µ µ
→ γ, Z
→ Z H
Figure 3: Three-body invariant mass (m
ℓℓγ) distribution of selected events in data (dots) and from the
various background sources (histograms, from the simulation) normalized to the yields determined as
described in the text, for Z
→ee (left) and Z
→ µµ(right) channels. The small peak near m
Zis
from residual FSR Z+γ contamination. The background uncertainty includes statistical uncertainties and
systematic uncertainties from the inputs taken from the simulation, as detailed in the text.
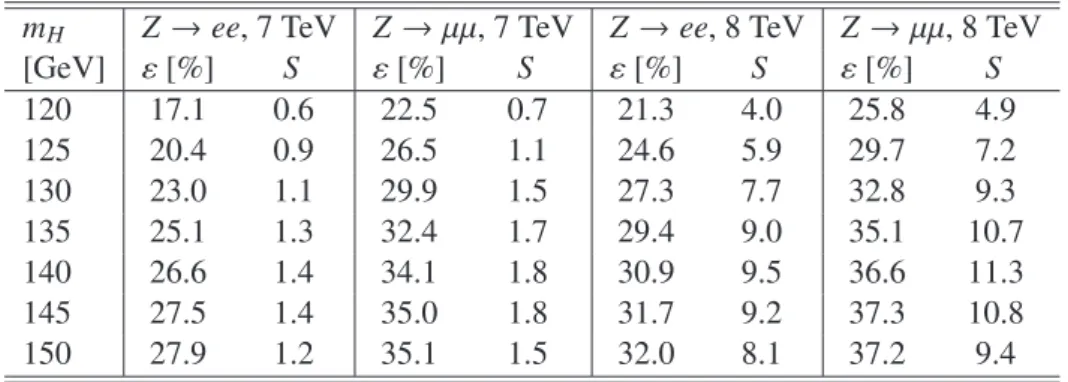
The signal selection efficiency as a function of the Higgs boson mass, in steps of 0.5 GeV, is obtained through an interpolation of the values estimated using the simulated signal samples. Taking into account the signal production cross section and branching fraction, the signal selection efficiency, and B(Z
→ ℓℓ) =(3.3658
±0.0023)% [7], the number of signal events expected after the selection as a function of the Higgs boson mass is obtained. The contribution from H
→ ℓℓγdecays proceeding through internal photon conversions in H
→ γγor FSR from leptons in H
→ ℓℓis neglected in this calculation. The expected signal yields and selection efficiencies for Higgs boson masses between 120 and 150 GeV and for an integrated luminosity of 20.7 fb
−1(4.6 fb
−1) at
√s
=8 (7) TeV are shown in Table 1.
Table 1: Selection efficiency (ε) and number of expected H
→Zγ signal events (S ), for Higgs boson masses between 120 and 150 GeV, for the two reconstructed Z boson final states and for 4.6 fb
−1at
√
s
=7 TeV and 20.7 fb
−1at
√s
=8 TeV. The relative statistical uncertainty on the quoted numbers is around 1%.
m
HZ
→ee, 7 TeV Z
→µµ, 7 TeVZ
→ee, 8 TeV Z
→µµ, 8 TeV[GeV]
ε[%] S
ε[%] S
ε[%] S
ε[%] S
120 17.1 0.6 22.5 0.7 21.3 4.0 25.8 4.9
125 20.4 0.9 26.5 1.1 24.6 5.9 29.7 7.2
130 23.0 1.1 29.9 1.5 27.3 7.7 32.8 9.3
135 25.1 1.3 32.4 1.7 29.4 9.0 35.1 10.7
140 26.6 1.4 34.1 1.8 30.9 9.5 36.6 11.3
145 27.5 1.4 35.0 1.8 31.7 9.2 37.3 10.8
150 27.9 1.2 35.1 1.5 32.0 8.1 37.2 9.4
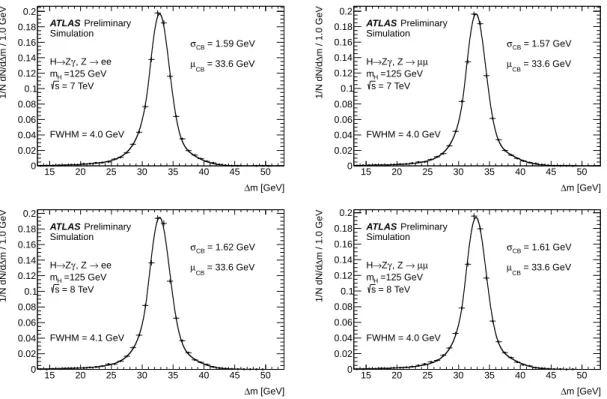
6.2 Signal model
The search for the SM Higgs boson decay to Zγ is performed through a fit to the distribution of an observable that discriminates between signal and background. Two observables have been studied: the three-body invariant mass of the final state particles, m
ℓℓγ, and the difference between the three-body and the di-lepton invariant masses,
∆m =m
ℓℓγ−m
ℓℓ. Both m
ℓℓγand m
ℓℓare computed using the Z-mass constraint described in Section 4, and m
ℓℓγis also corrected to use the primary vertex as the photon origin. In the fit, a model for the signal and background probability density functions of the observable under study is needed. It has been found that both observables m
ℓℓγand
∆mof signal events generated at a fixed Higgs boson nominal mass are well described by the sum of a Crystal Ball lineshape (a Gaussian with a power-law tail), representing the core of well-reconstructed events, and a small wide Gaussian component modeling poorly reconstructed events (outliers).
The final results, described in Section 9, are based on fits to the
∆mdistributions. Fig. 4 shows the distribution of
∆mfor signal events passing the full selection, for m
H =125 GeV and
√s
=8 TeV. The width of the
∆mdistribution is dominated by the Z-boson intrinsic width, with a subleading contribution of
≈1 GeV from the photon energy resolution (which is around 3%). Although the Z-mass constraint is applied, the
∆mresolution remains essentially unaffected.
The choice of
∆mover m
ℓℓγas the discriminant observable has two advantages. First, it is almost
unaffected by lepton energy scale uncertainties. Second, it is to a large extent insensitive to the contribu-
tion to the signal from FSR in H
→µµdecays (H
→eeγ from FSR in H
→ee in the SM is expected
to be negligible due to the small electron mass). The E
γTand
∆Rℓγrequirements significantly suppress
this contribution, which produces photons that are typically soft and collinear with the emitting lepton.
m [GeV]
∆
15 20 25 30 35 40 45 50
m / 1.0 GeV∆1/N dN/d
0 0.02 0.04 0.06 0.08 0.1 0.12 0.14 0.16 0.18 0.2
ATLAS Preliminary Simulation
→ ee γ, Z
→Z H
=125 GeV mH
= 7 TeV s
= 1.59 GeV σCB
= 33.6 GeV µCB
FWHM = 4.0 GeV
m [GeV]
∆
15 20 25 30 35 40 45 50
m / 1.0 GeV∆1/N dN/d
0 0.02 0.04 0.06 0.08 0.1 0.12 0.14 0.16 0.18 0.2
ATLAS Preliminary Simulation
µ µ
→ γ, Z
→Z H
=125 GeV mH
= 7 TeV s
= 1.57 GeV σCB
= 33.6 GeV µCB
FWHM = 4.0 GeV
m [GeV]
∆
15 20 25 30 35 40 45 50
m / 1.0 GeV∆1/N dN/d
0 0.02 0.04 0.06 0.08 0.1 0.12 0.14 0.16 0.18 0.2
ATLAS Preliminary Simulation
→ ee γ, Z
→Z H
=125 GeV mH
= 8 TeV s
= 1.62 GeV σCB
= 33.6 GeV µCB
FWHM = 4.1 GeV
m [GeV]
∆
15 20 25 30 35 40 45 50
m / 1.0 GeV∆1/N dN/d
0 0.02 0.04 0.06 0.08 0.1 0.12 0.14 0.16 0.18 0.2
ATLAS Preliminary Simulation
µ µ
→ γ, Z
→Z H
=125 GeV mH
= 8 TeV s
= 1.61 GeV σCB
= 33.6 GeV µCB
FWHM = 4.0 GeV
Figure 4: Distribution (normalized to unit area) of the difference
∆mbetween the final state three-body invariant mass m
ℓℓγand the di-lepton invariant mass m
ℓℓfor signal events passing the full selection (dots), for m
H =125 GeV and
√s
=7 (top) or 8 (bottom) TeV. The line overlaid represents the fit of the distribution with a model composed of the sum of a Crystal Ball (CB) and a Gaussian (GA) function.
Left: electron channel, right: muon channel.
However, studies performed at event-generator level, with both PYTHIA 8.150 interfaced to PHOTOS and MADGRAPH5 1.5.2 [70], indicate that after the selection there may be a non negligible residual contamination of
µ+µ−, at the level of 5%. This could not be distinguished from H
→Zγ if m
ℓℓγwere chosen as the discriminating variable, as m
ℓℓγpeaks at the Higgs boson mass m
Hfor both H
→Zγ and H
→µµγ. On the other hand, the∆mdistribution of H
→µµγdecays does not produce a peak and the presence of a small residual H
→µµγcontamination does not bias the fitted H
→Zγ yield.
7 Background model
In order to distinguish the Higgs boson signal from the background using
∆mas a discriminant, a model for the background distribution is needed. The model has been chosen carefully so that it does not introduce significant biases (“spurious signal”) on the fitted signal while at the same time preserving the sensitivity of the search.
Several functional forms have been tested, including polynomials of various orders, as well as non- polynomial functions such as exponential, Crystal Ball, Crystal Ball+Gaussian, and Crystal Ball+Landau distributions. The advantage of non-polynomial functions is that in general they do not follow local peaks and troughs in the mass distribution. The models have been tested by performing signal+background fits of the
∆mdistribution of high-statistics simulated background-only samples and evaluating the ratio of the fitted spurious signal to the statistical uncertainty on the fitted signal itself. The model that was found to provide the best sensitivity to the signal while limiting the spurious signal to be within
±20%
of the fitted signal uncertainty, for both 4.6 fb
−1of 2011 data and 20.7 fb
−1of 2012 data, is a third-order Chebychev polynomial in the fit range 24
<∆m<64 GeV. The spurious signal is treated as a systematic uncertainty on the fitted signal yield in the final statistical analysis described in Section 9.
8 Systematic Uncertainties
The theoretical and experimental systematic uncertainties are summarized in this section.
8.1 Theoretical uncertainties
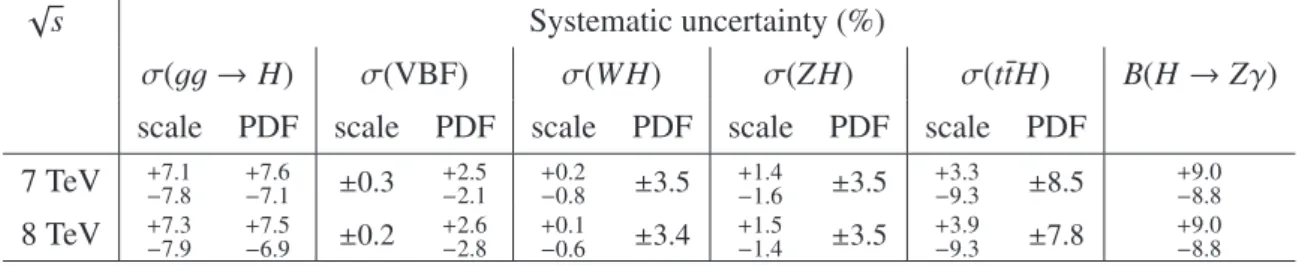
The Higgs boson production cross sections and decay branching fractions as functions of the Higgs boson mass are compiled, together with their uncertainties, in Ref. [5]. Theoretical uncertainties on the production cross section are separated into two components: the uncertainty related to the energy scales used for the fixed-order calculation, and the uncertainty from the PDF eigenvalues and the value of
αsused in the perturbative calculation. The scale uncertainties are considered uncorrelated among the five Higgs boson production modes, while the PDF uncertainties are considered correlated among the gluon fusion and t tH ¯ processes, which are induced by
ggdiagrams and thus sensitive to the uncertainty on the gluon PDF, and among the VBF and W H/ZH processes, which are induced by q q ¯ diagrams. For each tested Higgs boson mass hypothesis the uncertainties from Ref. [5] are used. Table 2 summarizes the theoretical uncertainties for a Higgs boson mass of 125 GeV. They depend only mildly on m
H, for 120
<m
H <150 GeV, with the exception of the relative uncertainty on the H
→Zγ branching fraction, which varies between 9.4% at 120 GeV and 6.2% at 150 GeV.
Theoretical uncertainties on the background cross sections do not affect the results shown in the next
section, because the background normalization and shape are obtained through a fit to the data.
Table 2: Theoretical systematic uncertainties for the SM Higgs boson production cross section and branching fraction of the H
→Zγ decay at
√s
=7 and 8 TeV, for a Higgs boson mass of 125 GeV.
√
s Systematic uncertainty (%)
σ(gg→
H)
σ(VBF) σ(W H) σ(ZH) σ(ttH) ¯ B(H
→Zγ)
scale PDF scale PDF scale PDF scale PDF scale PDF
7 TeV
+7.1−7.8 +7.6−7.1 ±0.3 +2.5−2.1 +0.2−0.8 ±3.5 +1.4−1.6 ±3.5 +3.3−9.3 ±8.5 +9.0−8.88 TeV
+7.3−7.9 +7.5−6.9 ±0.2 +2.6−2.8 +0.1
−0.6 ±3.4 +1.5−1.4 ±3.5 +3.9−9.3 ±7.8 +9.0−8.8
8.2 Experimental uncertainties
The following sources of experimental systematic uncertainties on the expected signal yields have been considered:
•
Luminosity. The uncertainty on the integrated luminosity for the 2011 data is 1.8% [33]. The un- certainty on the integrated luminosity in 2012 is
±3.6%. It is derived, following the same method- ology as that detailed in Ref. [33], from a preliminary calibration of the luminosity scale derived from beam-separation scans performed in April 2012.
•
Acceptance of the kinematic requirements. The uncertainties related to the acceptance of the se- lection criteria are estimated by comparing the acceptance estimated with simulated signal events generated either using POWHEG or MCFM, both interfaced to PYTHIA. This yields an uncer- tainty of 4%. Additional uncertainties related to the minimum transverse energy or momentum of leptons and photons originate from the momentum and energy scale uncertainties in the simulation and are described below.
•
Photon identification efficiency. At
√s
=7 TeV, the signal yield is recomputed by varying the photon identification efficiency scale factors within their uncertainties and the relative variation is considered as a systematic uncertainty. At
√s
=8 TeV a conservative estimate of the uncertainty on the photon identification efficiency obtained from a comparison between data-driven measure- ments and the simulated efficiencies is used. This amounts to 2.5% for E
T <40 GeV and for unconverted photons with
|η| >1.81, and to 1.5% otherwise. The resulting uncertainty on the H
→Zγ selection efficiency is below 3%.
•
Photon and electron calorimeter isolation requirements. The signal efficiency is measured from simulated events. To estimate the systematic uncertainty due to the uncertainty on the efficiency of the isolation criteria, the signal efficiency is recomputed by shifting, in the simulation, the photon and electron calorimeter isolation energies by the average difference observed between data and Monte Carlo for photons and electrons, selected either in di-photon enriched events or in a control sample of electrons from Z
→ee. These differences are of the order of 100 MeV for the topological-cluster based isolation.
The systematic uncertainty on the signal efficiency ranges between 0.2% and 0.4%.
•
Photon and electron energy scales. The uncertainty from the electromagnetic (photon and electron)
energy scales is assessed by varying the electromagnetic energy scale corrections (applied to the
data) within their uncertainties. The effects of the uncertainty from the Z
→ee control sample
used to extract the scale factors, of the limited knowledge of the material, of the uncertainty on
the presampler energy scale and of the low-p
Tscale factor uncertainties are evaluated. The total
uncertainty on the signal efficiency is around 0.2% for events in which the Z boson candidate decays to muons and between 0.4% and 1.2% for events in which the Z boson candidate decays to electrons.
•
Photon and electron energy resolution. The uncertainty from the photon and electron energy res- olution is estimated by varying the smearing correction within its uncertainties and observing the relative variation in the predicted signal yield. The estimated uncertainty is smaller than 0.2%.
•
Electron trigger, reconstruction and identification efficiency. The electron trigger, reconstruction and identification efficiency uncertainties are estimated by varying the efficiency scale factors ap- plied to the simulation within their uncertainties. The total uncertainty, for events in which the Z boson candidate decays to electrons, is around 3%.
•
Muon momentum scale and resolution. The uncertainty of the efficiency of the p
T >10 GeV cut (15 GeV for muons tagged in the calorimeters) is estimated by varying the muon momentum corrections in MC by their uncertainties. The effect is around 0.1%.
•
Muon trigger, reconstruction and identification efficiency. The trigger, reconstruction and identi- fication muon efficiency uncertainties are estimated by varying the efficiency scale factors within their uncertainties. The total uncertainty, for events in which the Z boson candidate decays to muons, is below 1%.
Other sources of uncertainties (the efficiency of the impact parameter and track isolation requirements for the leptons and of the calorimeter isolation selection for muons) have been estimated comparing the efficiencies in data and Monte Carlo for control samples of leptons from Z decays and found to be negligible. The total relative uncertainty on the signal efficiency is around 5%.
The following sources of experimental systematic uncertainties on the signal
∆mdistribution have been considered:
•
Photon and electron energy scales. The signal
∆mdistribution is recomputed after varying the elec- tromagnetic energy scale corrections within their uncertainties, and the shift of the peak position (0.2 GeV) is considered as the systematic uncertainty.
•
Photon and electron energy resolution. The signal
∆mdistribution is recomputed after varying the electromagnetic energy smearing corrections within their uncertainties, and the relative variation of its width is taken as a systematic uncertainty. It amounts to 2.4% for events in which the Z boson candidate decays to muons and to 5% for events in which the Z boson candidate decays to electrons
•
Muon momentum scale. The signal
∆mdistribution is recomputed after varying the muon momen- tum scale within its uncertainties, and the shift of the peak position is considered as a systematic uncertainty. This uncertainty is found to be negligible
•
Muon momentum resolution. The signal
∆mdistribution is recomputed after varying the muon momentum smearing corrections within their uncertainties, and the relative variation of its width (0-1.5%) is taken as a systematic uncertainty.
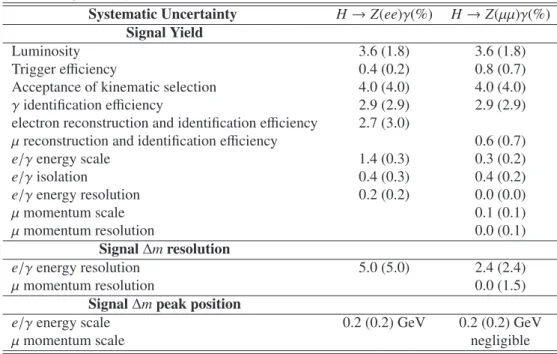
The list of the main sources of systematic uncertainties and their contributions to the H
→Zγ expected signal yields and parameters of the signal
∆mdistributions are listed in Table 3 for m
H =125 GeV and
√s
=8(7) TeV. The systematic uncertainties are profiled in the final maximum likelihood fit to the data, as described in Section 9.3. All systematic uncertainties, except that on the luminosity, are treated as correlated between the
√s
=7 TeV and the
√s
=8 TeV analyses.
Table 3: Summary of the systematic uncertainties on the signal yield and invariant mass distribution for m
H =125 GeV, at
√s
=8(7) TeV.
Systematic Uncertainty H→Z(ee)γ(%) H→Z(µµ)γ(%) Signal Yield
Luminosity 3.6 (1.8) 3.6 (1.8)
Trigger efficiency 0.4 (0.2) 0.8 (0.7)
Acceptance of kinematic selection 4.0 (4.0) 4.0 (4.0)
γidentification efficiency 2.9 (2.9) 2.9 (2.9)
electron reconstruction and identification efficiency 2.7 (3.0)
µreconstruction and identification efficiency 0.6 (0.7)
e/γenergy scale 1.4 (0.3) 0.3 (0.2)
e/γisolation 0.4 (0.3) 0.4 (0.2)
e/γenergy resolution 0.2 (0.2) 0.0 (0.0)
µmomentum scale 0.1 (0.1)
µmomentum resolution 0.0 (0.1)
Signal∆mresolution
e/γenergy resolution 5.0 (5.0) 2.4 (2.4)
µmomentum resolution 0.0 (1.5)
Signal∆mpeak position
e/γenergy scale 0.2 (0.2) GeV 0.2 (0.2) GeV
µmomentum scale negligible
9 Results
In this section we present the expected and observed p-values for the compatibility of the data with the background-only hypothesis ( p
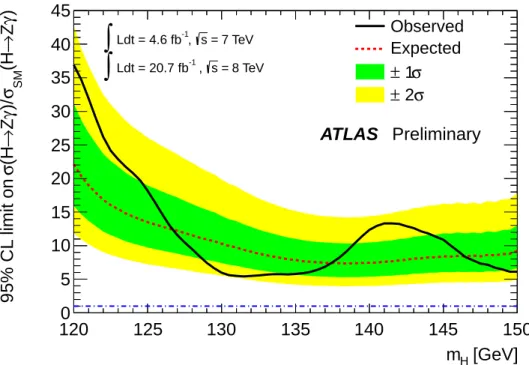
0) and the 95% confidence level (CL) exclusion limits on the cross section of a Standard Model Higgs boson decaying to Zγ, for a possible Higgs boson mass between 120 and 150 GeV.
9.1 Likelihood
The results are obtained using an unbinned maximum likelihood L depending on a single observable, the difference
∆mbetween the invariant mass of the three final state particles and the di-lepton invariant mass. The model includes a single parameter of interest, the signal strength
µ, defined as the ratio ofthe signal cross section to that predicted by the SM, and thus equal to the ratio between observed and expected signal events. In addition, several nuisance parameters are considered, which describe the normalization and
∆mdistribution of the background and the systematic uncertainties. A simultaneous fit is performed to the four orthogonal categories defined by the lepton flavor and the center-of-mass energy of the dataset.
Systematic uncertainties are incorporated into the full likelihood by adding a nuisance parameter
θfor each source of uncertainty, so that the signal and background expectations (yields or parameters of
the model) become functions of
θ(with
θ =0 corresponding to the nominal value of the signal yield
and resolution and
θ = ±1 corresponding to the
±1σ variation of the yield or the resolution due to the
source of the uncertainty). The global likelihood is then multiplied by a constraint term, i.e. a probability
density function of
θ, and the nuisance parameters are then fitted (“profiled”) to the data, together with theparameters of interest (µ), when minimizing
−log L. For systematic uncertainties affecting the expected
yields, a log-normal constraint is used while for the uncertainty on the signal
∆mresolution a Gaussian
constraint is used. Correlated uncertainties share the same nuisance parameter. In summary, the model
includes eight nuisance parameters describing theory uncertainties (five for the scales, two for PDFs, one
for the H
→Zγ branching fraction), 13 for the experimental uncertainties described in Section 8, and two for the spurious signal term described in Section 7. Including the background normalization parameters (four in total) and the background shape parameters (three for each category) the total number of nuisance parameters is thirty nine.
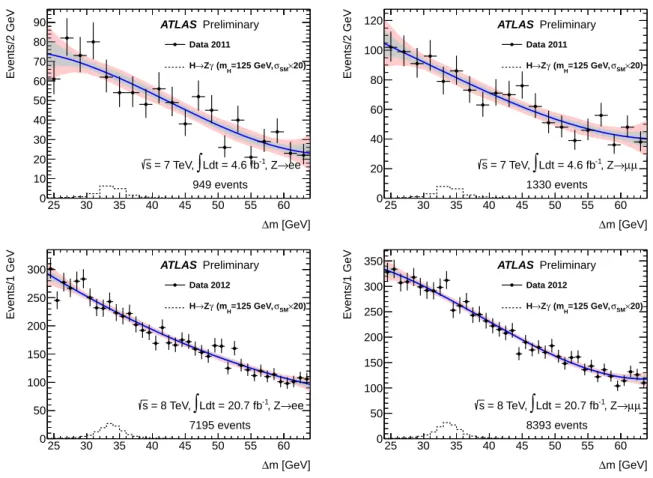
9.2 Background-only fits to the data
The shape parameters and the normalization of the background are determined by unbinned maximum likelihood fits to the data events selected in the range 24 GeV
< ∆m <64 GeV, performed separately for the two lepton categories and separately for the
√s
=7 TeV and
√s
=8 TeV data, using the parametrizations selected in Section 7. Fig. 5 shows the background-only fits to the data in the two categories for the
√s
=7 TeV and the
√s
=8 TeV data.
m [GeV]
∆
25 30 35 40 45 50 55 60
Events/2 GeV
0 10 20 30 40 50 60 70 80 90
Data 2011
×20) σSM
=125 GeV, (mH
γ
→Z H
→ee
-1, Z Ldt = 4.6 fb
∫
= 7 TeV, s
949 events ATLAS Preliminary
m [GeV]
∆
25 30 35 40 45 50 55 60
Events/2 GeV
0 20 40 60 80 100 120
Data 2011
×20) σSM
=125 GeV, (mH
γ
→Z H
µ µ
→
-1, Z Ldt = 4.6 fb
∫
= 7 TeV, s
1330 events ATLAS Preliminary
m [GeV]
∆
25 30 35 40 45 50 55 60
Events/1 GeV
0 50 100 150 200 250 300
Data 2012
×20) σSM
=125 GeV, (mH
γ
→Z H
→ee
-1, Z Ldt = 20.7 fb
∫
= 8 TeV, s
7195 events ATLAS Preliminary
m [GeV]
∆
25 30 35 40 45 50 55 60
Events/1 GeV
0 50 100 150 200 250 300 350
Data 2012
×20) σSM
=125 GeV, (mH
γ
→Z H
µ µ
→
-1, Z Ldt = 20.7 fb
∫
= 8 TeV, s
8393 events ATLAS Preliminary
Figure 5: Background-only fits to the distribution of the mass difference
∆mof selected events in data, for Z
→ee (left) and Z
→µµ(right), at
√s
=7 TeV (top) or 8 TeV (bottom). For both 7 and 8 TeV, a
third order polynomial is used for the fit. Dots correspond to data, the blue line is the fit result and the
gray and light red bands are the 1σ and 2σ uncertainty bands from the statistical uncertainties on the
fitted background model parameters. The dashed histograms correspond to the SM signal expectation,
for a Higgs boson mass of 125 GeV, scaled by a factor 20 for clarity.
9.3 Comparison to the background-only hypothesis and exclusion limits
The statistical procedures used to test the background-only hypothesis and to set exclusion limits are described in detail in Ref. [71]. The compatibility of the data with different values of the signal strength parameter
µis tested as a function of the SM Higgs boson mass m
H. In particular, for each value of m
H, the (in)compatibility of the data with the background-only hypothesis (µ
=0) is tested in order to quantify the significance of a possible observation. In addition, the compatibility between the data and increasing non-zero values of
µis used to set 95% CL upper limits on the signal strength, using a modified frequentist (CL
s) [72] method.
The compatibility between the data and the background-only hypothesis is quantified by the p-value of the
µ=0 hypothesis, p
0. In the following, p
0values are computed from the q
0values using closed- form asymptotic formulae [73]. Both observed p
0results, computed using real data, and expected p
0results, obtained from Asimov datasets [73] corresponding to the
µ=1 hypothesis, are quoted.
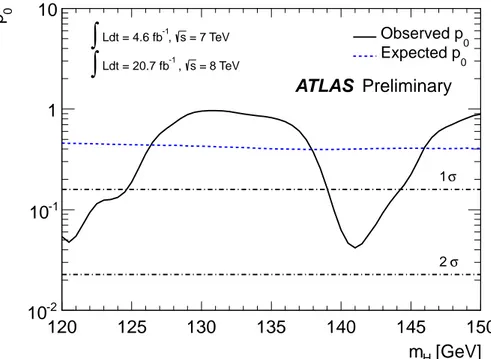
The expected and observed p
0values are shown in Fig. 6 as a function of the Higgs boson mass.
Using the full 2011 and 2012 ATLAS data, corresponding to 4.6 fb
−1of pp collisions at
√s
=7 TeV and 20.7 fb
−1of pp collisions at
√s
=8 TeV, the expected p
0ranges between 0.40 and 0.46 for 120
<m
H<150 GeV, corresponding to significances around 0.25
σ. The observedp
0distribution is compatible with the data being composed of background only. The smallest p
0(0.042), corresponding to a significance of 1.61
σ, occurs for a mass of 141 GeV. The expectedp
0at m
H =125 GeV is 0.443, corresponding to a significance of 0.14
σ, while the observed one is 0.188 (0.89σ).[GeV]
m
H120 125 130 135 140 145 150
0
p
10
-210
-11 10
= 7 TeV s
-1, Ldt = 4.6 fb
∫
= 8 TeV s
-1 , Ldt = 20.7 fb
∫
0Observed p Expected p0
σ 1
σ 2