A TLAS-CONF-2016-079 08 August 2016
ATLAS NOTE
ATLAS-CONF-2016-079
4th August 2016
Study of the Higgs boson properties and search for high-mass scalar resonances in the √ H → Z Z ∗ → 4` decay channel at
s = 13 TeV with the ATLAS detector
The ATLAS Collaboration
Abstract
The properties of the Higgs boson decaying to four leptons are studied using 14.8 fb −1 of in- tegrated luminosity collected in pp collisions by the ATLAS detector at the LHC at a centre- of-mass energy of 13 TeV. The results include measurements of the fiducial cross sections, the different production mode cross sections and a test of beyond the Standard Model inter- actions using an e ff ective Lagrangian approach. In addition, a search for scalar resonances decaying into the four-lepton final state is performed by exploring the mass range 200-1000 GeV. In all measurements no significant deviation from SM predictions are observed.
c
2016 CERN for the benefit of the ATLAS Collaboration.
Reproduction of this article or parts of it is allowed as specified in the CC-BY-4.0 license.
1 Introduction
The observation of a new particle in the search for the Standard Model (SM) Higgs boson by the ATLAS and CMS experiments [1, 2] with the data from LHC Run−1 taken during 2011 and 2012 has been an important step towards the clarification of the mechanism of the electroweak (EW) symmetry breaking [3–
5]. Further publications by the two experiments from LHC Run−1 have confirmed that the spin, parity and couplings of the new particle are consistent with those predicted for the SM Higgs boson [6–8].
The Higgs boson mass is not predicted by the SM, but once measured the production cross sections and branching ratios can be precisely calculated. The ATLAS and CMS collaborations have reported a combined measurement of the Higgs boson mass of m H = 125.09 ± 0.21(stat) ±0.11(syst) GeV [9]. This value of the mass is assumed for all Higgs boson analyses reported in this note. A study of the Higgs boson couplings to other SM particles based on the combination of the ATLAS and CMS Run−1 results, has been recently published in Ref. [10].
The Higgs boson decay to four leptons, H → ZZ ∗ → 4`, where ` = e or µ, provides good sensitivity for the measurement of its properties due to its high signal-to-background ratio (S/B), which is better than 2 for each of the four final states: µ + µ − µ + µ − (4µ), e + e − µ + µ − (2e2µ), µ + µ − e + e − (2µ2e), and e + e − e + e − (4e), where the first lepton pair is defined to be the one with the dilepton invariant mass closest to the Z boson mass. The largest background for this channel, throughout the four-lepton invariant mass (m 4` ) range, is due to continuum (Z (∗) /γ ∗ )(Z (∗) /γ ∗ ) production, referred to as ZZ ∗ hereafter. For four-lepton events with m 4` below about 160 GeV there are also non-negligible background contributions from Z + jets and t¯ t production with two prompt leptons, where the additional charged lepton candidates arise from decays of hadrons with b- or c-quark content, from π/K in flight decays, from photon conversions or from misidentification of jets.
With the LHC Run−1 data, collected at centre-of-mass energies of √
s = 7 and 8 TeV, several meas- urements were performed in the H → ZZ ∗ → 4` channel: coupling and spin / CP measurements, cross section measurements and a search for an additional heavy Higgs boson [11–14]. Preliminary results on H → ZZ ∗ → 4` decay channel, based on the first 3.2 fb −1 of pp collision data collected at a centre-of- mass energy of 13 TeV have been reported by the ATLAS collaboration in Ref. [15].
This note contains several preliminary results based on the four-lepton final state. The inclusive total and fiducial cross section measurements reported in Ref. [15] are updated including the additional 11.6 fb −1 of pp collision data collected in the first 2016 data taking period. In addition the data set is analyzed in terms of the cross section per production mode, using dedicated exclusive event categories and multivariate discriminants. The same categories are used to put constraints on possible beyond the Standard Model (BSM) interactions parameterised in terms of an e ff ective Lagrangian. The BSM scalar and pseudo-scalar interactions of the Higgs boson with the SM vector bosons Z and W boson are investigated. Additional Higgs bosons are predicted by various extensions of the SM Higgs sector, such as the two Higgs doublet model (2HDM) [16] and the electroweak singlet model (EWS) [17]. For this purpose, the m 4` distribution above 200 GeV is analyzed searching for heavy scalar resonances decaying into the four-lepton final state via a pair of SM Z bosons. Dedicated categories are defined to gain sensitivity to the production mode of such a hypothetical new resonance.
This note is organized as follows. A brief overview of the event selection, with emphasis on updates
with respect to Ref. [15], is presented in Section 2. In the same section the strategy adopted for the
different measurements reported in this note is outlined. The description of the signal and background
samples used in the analyses is given in Section 3. This includes the different production modes of the SM
Higgs boson, the BSM signals derived with the e ff ective Lagrangian approach and the high-mass scalar resonances. The background estimates are reported in Section 4. The modelling of signal and background distributions is reported in Section 5. The systematic uncertainties are discussed in Section 6. The results are summarised in Section 7. Finally the conclusions are given in Section 8.
2 Event selection and analysis strategy
The reconstruction and identification of electrons, muons and jets, as well as the event selection follow closely the strategy described in Refs. [11, 15]. More details on the ATLAS detector and its performance can be found in Ref. [18]. A brief overview on the event selection is given in the following.
Electrons in ATLAS are reconstructed using information from the inner tracking detector (ID) and the electromagnetic calorimeter [19]. Electron candidates are clusters of energy associated with ID tracks, where the final track-cluster matching is performed after the tracks have been fitted with a Gaussian-sum filter [20]. For electrons, background discrimination relies on the shower shape information available from the highly segmented calorimeter, high-threshold transition radiation tracker (TRT) hits, as well as compatibility of the tracking and calorimeter information. This information is combined into a likelihood discriminant. Requirements on the hits in the silicon detectors, including a hit in the innermost layer of the detector, the IBL (or the next-to-innermost layer in case of masked modules), are added. For Run−2, the impact parameter in the transverse plane and its significance (|d 0 |, and |d 0 |/σ d 0 ) have been added to the likelihood discriminant, improving the suppression of heavy-flavour background contributions. A “loose”
likelihood (LH) selection is applied, which maintains a high e ffi ciency and su ffi cient background suppres- sion [20]. The electron transverse energy E T is computed from the cluster energy and the track direction at the interaction point. The cluster energy corrections and calibration are described elsewhere [21]. For the current measurement, the combined fit of the cluster E T and the track p T , which was used in Run−1, is not applied.
Muons are reconstructed as tracks in the ID and the muon spectrometer (MS), and their identification is primarily based on the presence of a matching track or tag in the MS [22]. With respect to previous published results, the minimum muon transverse momentum requirement has been lowered from 6 GeV to p T > 5 GeV. This provides an increase in the signal acceptance of about 7% in the 4µ final state. If the ID and MS feature full track information, a combined muon track is formed by a global refit using the hit information from both the ID and MS detectors (combined muons), otherwise the momentum is measured using the ID, and the partial MS track serves as identification (segment-tagged muons).
The segment-tagged muons are limited in Run−2 to the centre of the barrel region (|η| < 0.1) which
lacks MS geometrical coverage. Furthermore in this central region, an ID track with p T > 15 GeV is
identified as a muon if its calorimetric energy deposition is consistent with a minimum ionizing particle
(calorimeter-tagged muons). The muon reconstruction and identification coverage is extended by using
tracks reconstructed in the forward region (2.5 < |η| < 2.7) of the MS, which is outside the ID coverage
(standalone muons). For standalone muons, the measurement of the impact parameter is improved by
looking for possible hits in the part of the ID closest to the interaction point. The ID tracks associated with
muons that are identified inside the ID acceptance are required to have a minimum number of associated
hits in each of the ID subdetectors to ensure good track reconstruction. The muon candidates outside the
ID acceptance that are reconstructed only in the MS are required to have hits in each of the three MS
stations they traverse. At most one standalone or calorimeter-tagged muon is used per event.
The QED process of radiative photon production in Z boson decays is well modeled by simulation. Some of the Final State Radiation (FSR) photons can be identified in the calorimeter and incorporated into the four-lepton measurement. The strategy to include FSR photons into the reconstruction of Z bosons is the same as in Run−1. It consists of a search for collinear (for muons) and noncollinear FSR photons (for both muons and electrons) with only one FSR photon allowed per event.
Jets are reconstructed from clusters of calorimeter cells using the anti-k t algorithm [23, 24] with a distance parameter R = 0.4. The algorithm for the clustering suppresses noise and pileup by keeping only cells with a significant energy deposit and their neighboring cells. The jets are calibrated using a dedicated scheme designed to adjust, on average, the energy measured in the calorimeter to that of the true jet energy. To reduce the number of jet candidates originated from pileup vertices, jets with p T < 60 GeV within the ID acceptance (|η| < 2.4) have requirements applied to the fraction of tracks which come from the primary vertex [25].
Different objects can be reconstructed from the same detector information, requiring an overlap ambiguity to be resolved. For an electron and a muon which share the same ID track, the muon is selected except for a calorimeter-tagged muon which does not have a MS track or segment-tag in which case the electron is selected. The reconstructed jets which overlap with electrons are removed.
A common preselection is applied for all analyses reported in this note. The data are subjected to quality requirements: if any relevant detector component is not operating correctly during a period in which an event is recorded, the event is rejected. Events are required to have at least one vertex with two associated tracks with p T > 400 MeV, and the primary vertex is chosen to be the reconstructed vertex with the largest P p 2 T . Four-lepton events are selected and classified according to their final state: 4µ, 2e2µ, 2µ2e, 4e.
Four-lepton events are selected with single-lepton, dilepton and trilepton triggers. The electron trigger applies "loose” and "medium" for multilepton triggers or “medium” and "tight" for single-electron trigger likelihood identification, and isolation requirements only in the single-muon triggers. The values of the trigger thresholds used for the 2015 data set are described in Ref. [15]. For the 2016 data the p T thresholds have been raised and the electron identification tightened with the increase of the peak luminosity during the run. The impact on the signal efficiency is rather small, below 1%. The most affected channel is the 4µ for which the trigger efficiency decreases from 99 to 98% with 2016 trigger thresholds. Globally, the trigger e ffi ciency for signal events passing the final selection is about 99%.
Higgs boson candidates are formed by selecting two same-flavour, opposite-sign lepton pairs (a lepton quadruplet) in an event. The kinematic selection applied to the leptons is the same as the one detailed in Ref. [15] with a few small changes described in the following. In order to cope with the increase of the reducible background due to the lowering of the minimum muon p T requirement (lowered from 6 to 5 GeV), the four leptons are required to be compatible with the same vertex. A loose χ 2 selection is applied, corresponding to a signal e ffi ciency of 99.5% for all decay channels. The same lepton isolation criteria as applied in Ref. [15] are applied to the leptons in the quadruplets.
Multiple quadruplets within a single event are possible: for four muons or four electrons there are two ways to pair the masses, and for five or more leptons there are multiple ways to choose the leptons.
Quadruplet selection is done separately in each sub-channel: 4µ, 2e2µ, 2µ2e, 4e, keeping only a single quadruplet per channel. For each channel, the same-flavour opposite-charge lepton pair with the mass closest (second closest) to the Z boson mass is referred to as the leading (subleading) dilepton and its invariant mass is referred to as m 12 (m 34 ).
The selection criteria that define the signal candidate events are summarized in Table 1.
Table 1: A summary of the event selection requirements.
L eptons and J ets requirements Electrons
Loose Likelihood quality electrons with hit in innermost layer, E T > 7 GeV and |η| < 2.47 M uons
Loose identification |η| < 2.7
Calo-tagged muons with p T > 15 GeV and |η| < 0.1
Combined, stand-alone (with ID hits if available) and segment tagged muons with p T > 5 GeV J ets
anti-k t jets with p T > 30 GeV, |η| < 4.5 and passing pile-up jet rejection requirements E vent S election
Q uadruplet Require at least one quadruplet of leptons consisting of two pairs of same flavour Selection opposite-charge leptons fulfilling the following requirements:
p T thresholds for three leading leptons in the quadruplet - 20, 15 and 10 GeV Maximum of one calo-tagged or standalone muon per quadruplet
Select best quadruplet to be the one with the (sub)leading dilepton mass (second) closest the Z mass
Leading dilepton mass requirement: 50 GeV < m 12 < 106 GeV Sub-leading dilepton mass requirement: 12 < m 34 < 115 GeV
Remove quadruplet if alternative same-flavour opposite-charge dilepton gives m `` < 5 GeV
∆ R(`, ` 0 ) > 0.10 (0.20) for all same(di ff erent)-flavour leptons in the quadruplet I solation Contribution from the other leptons of the quadruplet is subtracted
Muon track isolation ( ∆ R ≤ 0.30): Σ p T /p T < 0.15 Muon calorimeter isolation (∆ R = 0.20): Σ E T / p T < 0.30 Electron track isolation ( ∆ R ≤ 0.20) : Σ E T /E T < 0.15 Electron calorimeter isolation ( ∆ R = 0.20) : Σ E T /E T < 0.20
I mpact Apply impact parameter significance cut to all leptons of the quadruplet.
P arameter For electrons : |d 0 /σ d 0 | < 5 S ignificance For muons : |d 0 /σ d 0 | < 3
V ertex Require a common vertex for the leptons
S election χ 2 /ndof < 6 for 4µ and < 9 for others.
After the FSR correction, the lepton four-momenta of the leading dilepton are recomputed by means of a Z-mass-constrained kinematic fit. The fit uses a Breit-Wigner Z line shape and a single Gaussian per lepton to model the momentum response function with the Gaussian σ set to the expected resolution for each lepton. The Z-mass constraint improves the m 4` resolution by about 15%. For the high-mass region, the Z-mass constraint is applied to both pairs.
Events satisfying the above criteria are considered candidate signal events for all the described analyses, defining a signal region independent of the value of m 4` . The Higgs boson mass resolution is dependent on the final state and corresponds to 1.6 GeV, 1.7 GeV, 2.1 GeV and 2.4 GeV for 4µ, 2e2µ, 2µ2e and 4e at m H = 125 GeV, respectively. The strategies for the di ff erent measurements and searches on the selected signal candidates are outlined in the following.
2.1 Fiducial cross sections measurement
The selected events in the mass region 115 < m 4` < 130 GeV are analyzed to extract the fiducial and total cross sections. The m 4` distribution is used as a discriminant to increase the sensitivity to the signal. This differs from what was done in Refs. [11, 15] where only event counting was used in the fiducial cross section extraction. The optimal signal mass window (118 < m 4` < 129 GeV) is enlarged when using the m 4` as a discriminant. The selected candidates in the signal region can be expressed as:
N Data (m 4` ) i = L int · σ tot · B(H → 4`)·
f i · PDF(m 4` ) sig,i · X
proc
(r proc · A proc,i · C proc,i )
+ PDF(m 4` ) bkg,i · N bkg,i . (1)
where N Data (m 4` ) i is the number of observed data candidates as a function of m 4` in the decay channel
i (i = 4µ, 4e, 2e2µ and 2µ2e), L int the integrated luminosity, σ tot is the total production cross section of
the Higgs boson, B(H → 4`) is the branching ratio of the Higgs boson decay into the four lepton final
state, A proc,i are the acceptance factors (in the fiducial regions defined below) for a given production
process (proc = gluon-fusion (ggF), vector boson fusion (VBF), associated production with a Z or W bo-
son (ZH, W H), associated production with a top pair (t¯ tH)) and decay channel i, and C proc,i are detector
correction factors, which account for e ff ects such as trigger, reconstruction and identification e ffi ciencies
and reconstruction resolution (again for each production mode and decay channel). N bkg,i is the number
of estimated background events per decay channel i. The detector correction factors are estimated from
simulation and are given by the ratio of the number of selected reconstructed events relative to the num-
ber of particle-level events with Born leptons falling in the fiducial region. They include migration of
events into and out of the fiducial region due to resolution effects. The normalised m 4` distributions are
represented by the PDF(m 4` ) functions (given separately for each signal final state and for the di ff erent
backgrounds). The background normalisations and their invariant mass distributions are derived with the
methods described in Section 4. The fiducial acceptance factors A correspond to the theory dependent
fraction of H → ZZ ∗ → 4` decays that pass the fiducial selection. The r proc parameters represents the
fraction of the cross section in a given production process with respect to the total one. The parameters
f i = B(H → i)/B(H → 4`), are the relative branching fraction in each of the four final states. The values
of r proc and f i are taken from the latest available SM calculations [26, 27]. The associated systematic
uncertainties are discussed in Section 6.
Table 2: The list of the selections which define the fiducial region of the cross section measurement. Same-flavour opposite-sign lepton pairs are denoted as SFOS, the leading lepton pair mass as m 12 , and the subleading lepton pair mass as m 34 .
Lepton definition
Muons: p T > 5 GeV, |η| < 2.7 Electrons: p T > 7 GeV, |η| < 2.47 Pairing
Leading pair: SFOS lepton pair with smallest |m Z − m `` |
Sub-leading pair: Remaining SFOS lepton pair with smallest |m Z − m `` | Event selection
Lepton kinematics: Leading leptons p T > 20, 15, 10 GeV Mass requirements: 50 < m 12 < 106 GeV; 12 < m 34 < 115 GeV
Lepton separation: ∆ R(` i , ` j ) > 0.1(0.2) for same(opposite)-flavour leptons J/ψ veto: m(` i , ` j ) > 5 GeV for all SFOS lepton pairs
Mass window: 115 < m 4` < 130 GeV
In order to minimize the model dependence of the cross section measurement, the fiducial phase space definition follows closely the experimental requirements applied to the four leptons and is summarized in Table 2. The selection is applied at simulation generator level to electrons and muons before they emit photon radiation, referred to as Born-level leptons. No isolation requirement is applied in the fiducial selection, so that any isolation inefficiency is included in C. The small residual model dependence is related to the in and out of acceptance corrections and to the few experimental selection criteria that are not implemented in the fiducial phase space definition (e.g., the lepton isolation criteria).
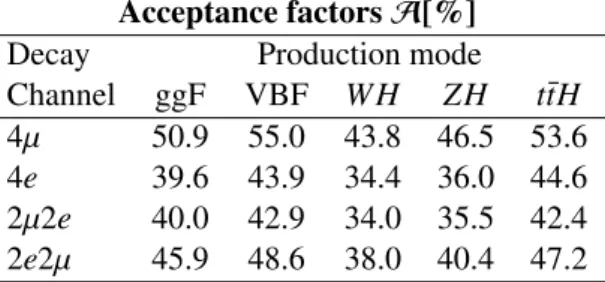
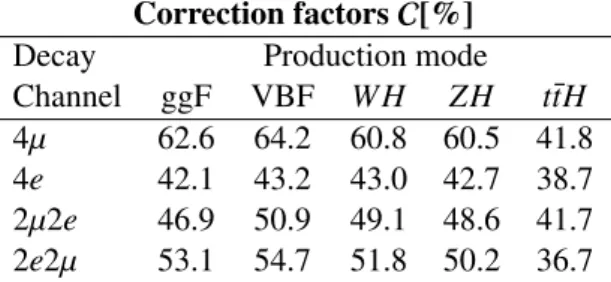
The values of the acceptance factors (A) and of the correction factors (C) for each production mode and decay channel are summarized in Tables 3 and 4, respectively. The acceptance factors are smaller for the W H and ZH production modes due to the presence of the additional leptons from vector boson leptonic decays that can be selected in the quadruplet, causing the event to fail the mass window cut. The lower values of the correction factors for the t¯ tH production mode are due to the presence of several jets that can overlap with the Higgs boson decay leptons.
Table 3: The values of the acceptance factors in % per production mode and decay channel. They are computed for a SM Higgs boson with a mass of 125.09 GeV and a signal mass window of 115 − 130 GeV.
Acceptance factors A[%]
Decay Production mode
Channel ggF VBF W H ZH t¯ tH
4µ 50.9 55.0 43.8 46.5 53.6
4e 39.6 43.9 34.4 36.0 44.6
2µ2e 40.0 42.9 34.0 35.5 42.4 2e2µ 45.9 48.6 38.0 40.4 47.2
The fiducial cross sections can be extracted with a likelihood fit to the observed m 4` distribution in the
signal mass window under di ff erent assumptions. The fit is based on the profiled likelihood test statistic
under the asymptotic approximation [28]. With the parameterisation described above, the fiducial cross
section in each final state can be defined as an independent parameter of interest. The total fiducial cross
section can be obtained by defining as parameter of interest the sum of the four final states, without any
Table 4: The values of the correction factors in % per production mode and decay channel. They are computed for a SM Higgs boson with a mass of 125.09 GeV and a signal mass window of 115 − 130 GeV.
Correction factors C[%]
Decay Production mode
Channel ggF VBF W H ZH t¯ tH
4µ 62.6 64.2 60.8 60.5 41.8
4e 42.1 43.2 43.0 42.7 38.7
2µ2e 46.9 50.9 49.1 48.6 41.7 2e2µ 53.1 54.7 51.8 50.2 36.7
assumption of the relative Higgs boson branching ratios. This approach is referred to as the sum. An alternative approach is to combine the four decay channels assuming the relative branching ratios to be those predicted by the SM. This approach is referred to as the combination. The first case is less model dependent but it has a slightly reduced statistical sensitivity.
The total inclusive cross section is derived assuming SM values for the Higgs decay branching ratio in the four channels.
2.2 Production mode studies and constraints on κ HVV and κ AVV · sin α
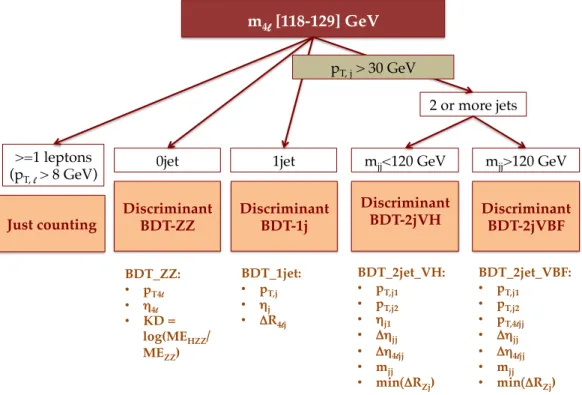
In order to gain sensitivity to the different production modes, the events selected in the mass region 118 < m 4` < 129 GeV are classified into exclusive categories. The chosen mass range di ff ers from the one used in the fiducial cross section measurement since in the categorisation analysis the mass distribution is not used as a discriminant to allow for the use of jet-based discriminants. The narrower mass range gives better performance when the mass is not used as a discriminant in the fit. Categories based on the presence of additional leptons and the number of jets are used with discriminants optimized to disentangle the different production modes. This categorisation is designed to measure the cross sections per production mode, but it also gives sensitivity to BSM interactions between the Higgs boson and the SM vector bosons W and Z, as described in the following. The schematic flow chart for the event categorisation is shown in Fig. 1.
The events are first categorised in a VH-leptonic category by requiring at least one additional isolated lepton (e or µ) with a transverse momentum greater that 8 GeV. The lepton isolation and transverse impact parameter significance criteria are the same as those applied to the four lepton final state. The events that do not pass this selection are classified into three exclusive categories depending on the number of jets identified in the event. Jets are required to have transverse momentum greater than 30 GeV and a pseudo- rapidity |η| < 4.0. The categories are 0-jet, 1-jet and 2-jet (where the last one includes events with two or more jets). In the 2-jet category the events are further split into low and high dijet invariant mass. The dijet invariant mass (m j j ) is computed with the two highest transverse energy jets. The dijet mass categories are defined by m j j < 120 GeV (low-mass) and m j j > 120 GeV (high-mass). This further division helps to separate the VH-hadronic (where the vector boson decays to a quark pair) and the VBF production processes. In addition to the event categorisation, a dedicated discriminant is used in each category to improve the sensitivity to the different production modes with the exception of the VH-leptonic one.
For the 0-jet category, a dedicated boosted decision tree (BDT) [29] trained to separate the ggF process
from SM backgrounds (dominated by the non-resonant ZZ ∗ background) is used as in Ref. [11]. This
m 4 l [118-129] GeV!
0jet! 1jet!
2 or more jets!
p T, j > 30 GeV!
Discriminant!
BDT-ZZ!
m jj <120 GeV! m jj >120 GeV!
Discriminant!
BDT-1j!
Discriminant!
BDT-2jVBF!
Discriminant!
BDT-2jVH!
!
>=1 leptons (p T, l > 8 GeV)!
Just counting !
BDT_ZZ:!
• p T4l
• η 4l!
• KD = log(ME HZZ / ME ZZ )!
BDT_1jet:!
• p T,j!
• η j!
• ΔR 4lj!
BDT_2jet_VH:!
• p T,j1!
• p T,j2!
• η j1!
• Δη jj!
• Δη 4ljj !
• m jj!
• min(ΔR Zj )!
BDT_2jet_VBF:!
• p T,j1!
• p T,j2!
• p T,4ljj!
• Δη jj!
• Δη 4ljj !
• m jj!
• min(ΔR Zj )!
Figure 1: A schematic view of the exclusive event categories detailed in the text.
BDT is based on the 4` system pseudo-rapidity, transverse momentum and on the logarithm of ratio of the signal and background matrix elements (the KD discriminant) computed with the lepton kinematics (as detailed in Ref. [11]).
For the 1-jet category a BDT trained to disentangle the ggF production mode from the VBF mode is used.
The variables used in this BDT are: the transverse momentum (p T, j ) and the pseudorapidity (η j ) of the jet and the angular separation between the four-lepton system and the jet ( ∆ R 4` j ).
Similarly, for the 2-jet categories two BDTs trained to disentangle the ggF production mode from the VH-hadronic and from the VBF mode are used in the low-mass and high-mass category, respectively.
The BDT used in the high-mass category is based on the following variables: the jet transverse momenta (p T, j1 and p T, j2 ), the dijet invariant mass (m j j ), the pseudorapidity separation (∆ η j j ) of the two leading jets, the transverse momentum of the di-jet plus four-lepton system (p T,4` j j ), the minimum angular separation between the leading dilepton pair and the two leading jets (min( ∆ R Z j )) and the di ff erence in pseudorapid- ity between the four-lepton system and the average pseudorapidity of the two leading jets (∆ η 4` j j ). For the low-mass category the same variables are used with the exception of the p T,4` j j (this variable brings little improvement in the low-mass category).
This experimental categorisation also provides sensitivity to possible BSM interactions. In particular,
BSM interactions between the Higgs boson and the SM vector bosons W and Z would have a large im-
pact on the yields in the VH and VBF production modes since they would modify simultaneously the production and the decay interactions. In order to study these interactions the BSM effects are paramet- erised following the Higgs characterization model described in Ref. [30]. Only the e ff ective Lagrangian terms related to the BSM couplings κ HVV and κ AVV of Equation 2.2 of Ref. [30] are considered in this note as in previous ATLAS studies [12], where, however, these interactions were considered only in the Higgs boson decay. They describe BSM scalar (κ HVV ) and pseudo-scalar (κ AVV ) interactions between the Higgs boson and the Z and W SM vector bosons. The BSM couplings are assumed to be the same for the W and Z bosons (i.e., κ HVV = κ HZZ = κ HWW and κ AVV = κ AZZ = κ AWW ). The scale of the new physics described in the model ( Λ ) is fixed at 1 TeV and the coupling that describes the SM-like interaction is fixed to the SM value (κ SM · cos α = 1 of Ref [30]). For the BSM scalar interaction the value of cos α of Ref. [30] is fixed to 1, so that the interaction is described by the single parameter κ HVV . For the pseudo-scalar inter- action the coupling of the BSM part is defined as a single parameter κ AVV · sin α of Ref. [30]. With these assumptions and this parameterisation, the interactions between the Higgs boson and the vector bosons are the same as in the SM when the value of the BSM coupling is zero.
In order to study the impact of the BSM interactions on the experimental categories, BSM samples have been generated using the code MadGraph5_aMC@NLO [31] and are used to emulate different values of the couplings using a morphing technique described in Section 5. The data yields are fit to the expected BSM signal in each category, without the use of discriminants. The SM-like part of the interaction is fixed to the predictions by the latest SM calculations [26, 27].
2.3 High-mass analysis
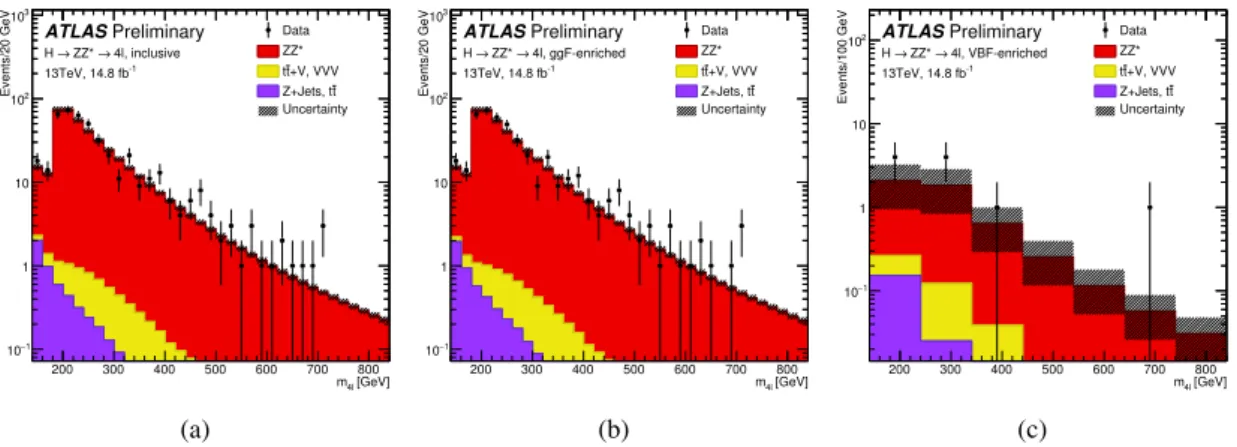
The signal candidate events selected in the invariant mass region above 140 GeV are used to search for heavy scalar resonances decaying via the process ZZ → 4`. The analysis is close to the one described in Ref. [15]. The basic event selection is described in section 2 with the addition of the Z-mass constraint applied to both dilepton pairs, as both Zs are expected to be on-shell.
A few improvements with respect to Ref. [15] are implemented in this study: in addition to the inclusive search, categories sensitive to ggF and VBF production modes are added. An event is classified as ori- ginating from the VBF production mode if there are two or more jets in the event, the invariant mass of the di-jet system is above 400 GeV and the jets are well separated in η (| ∆ η| > 3.3). Otherwise the event enters the ggF category.
The results are expressed as 95% confidence upper limits derived separately for ggF and VBF produc- tion cross sections of the additional heavy Higgs-like boson assuming the Narrow Width Approximation (NWA). In the case of the NWA, the heavy Higgs boson is modelled with a Breit-Wigner with a fixed width of 4.07 MeV as predicted for the SM Higgs boson with a mass of 125 GeV. Under the NWA as- sumption, the interference of a light Higgs with the gg-initiated ZZ continuum can be safely ignored. The modelling of the signal and background used for the high-mass analysis is discussed in Section 5.
In addition to the NWA, the case of a signal with Large Width Approximation (LWA) is also studied, as several theoretical models favor this hypothesis. In this case the signal is modelled with a Breit-Wigner with a width varying up to 10% of its mass. Results for a heavy Higgs boson with a width of 1%, 5%
and 10% of its mass are presented. The interference with the SM background is found to be small and
therefore is neglected. In the LWA analysis, no categories (sensitive to ggF and VBF production modes)
are used.
3 Signal and background simulation
The production of the SM Higgs boson is modelled using the POWHEG-BOX v2 Monte Carlo (MC) event generator [32, 33], which calculates separately the ggF and VBF production mechanisms with matrix elements up to next-to-leading order (NLO) in QCD. POWHEG-BOX is interfaced to PYTHIA 8 [34]
for showering and hadronization, which in turn is interfaced to E vt G en v1.2.0 [35] for the simulation of b and c-hadron decays. The H → ZZ ∗ → 4` decay is also performed in PYTHIA 8. In addition, a ggF sample modelled with MadGraph5_aMC@NLO is used for systematics studies. This includes up to two additional jets at NLO QCD accuracy with the F x F x merging scheme [31, 36].
PYTHIA 8 is used to simulate the production of a Higgs boson in association with a W or a Z bo- son. The production of a Higgs boson in association with a top quark pair is simulated using Mad- G raph 5_ a MC@NLO [31] and is interfaced to H erwig++ [37] for showering and hadronization.
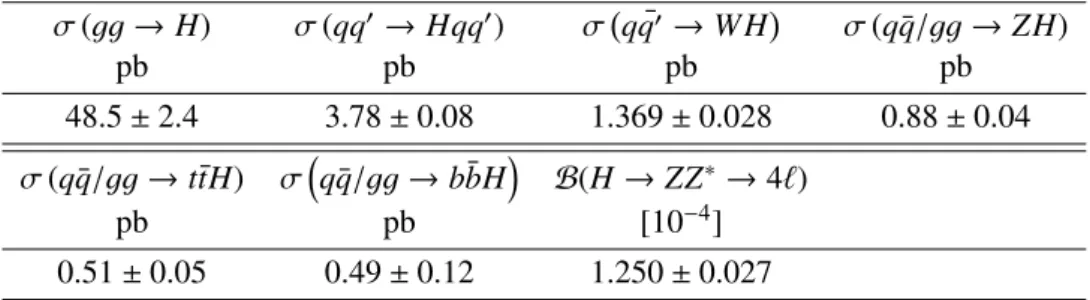
The Higgs boson production cross sections 1 and decay branching ratios, as well as their uncertainties, are taken from Refs. [26, 27, 38–68]. Table 5 summarises the production cross sections and branching ratios for H → ZZ ∗ → 4` at 13 TeV for m H = 125.09 GeV .
Table 5: The predicted SM Higgs boson production cross sections (σ) for ggF, VBF and associated production with a W or Z boson or with a b b ¯ or t t ¯ pair in pp collisions for m H = 125.09 GeV at √
s = 13 TeV [26, 27, 38–68]. The quoted uncertainties correspond to the total theoretical systematic uncertainties calculated by adding in quadrature the QCD scale and PDF + α s uncertainties. The decay branching ratio (B) with full uncertainty for H → ZZ ∗ → 4`
with ` = e, µ, is also given.
σ (gg → H) σ (qq 0 → Hqq 0 ) σ q q ¯ 0 → W H σ (q q/gg ¯ → ZH)
pb pb pb pb
48.5 ± 2.4 3.78 ± 0.08 1.369 ± 0.028 0.88 ± 0.04 σ (q q/gg ¯ → t¯ tH) σ
q q/gg ¯ → b bH ¯
B (H → ZZ ∗ → 4`)
pb pb [10 −4 ]
0.51 ± 0.05 0.49 ± 0.12 1.250 ± 0.027
Additional VBF and VH signal samples with different values of the BSM couplings κ HVV and κ AVV · sin α have been generated with M ad G raph 5_ a MC@NLO at leading order in QCD and are used for the signal morphing as a function of the BSM couplings as explained in Section 5.
For the high-mass scalar search, ggF and VBF samples for different values of the mass of the scalar and with a narrow width of 4.07 MeV as predicted in the SM for m H = 125.09 GeV, have been gen- erated with POWHEG-BOX. The mass range is between 200 GeV to 1 TeV in steps of 100 GeV. In addition, ggF samples with a width of 5% and 10% of the scalar mass m S have been generated with M ad G raph 5_ a MC@NLO.
The ZZ ∗ continuum background from quark-antiquark annihilation is modelled at NLO in QCD using POWHEG-BOX v2 and interfaced to PYTHIA 8 for parton shower and hadronization, and to E vt G en v1.2.0. The CT10 nlo [69] set is used as Parton Density Function (PDF) of the hard process while the CTEQL1 PDF set is used for the parton shower. The non-perturbative effects are modelled using the AZNLO [70] tune. NNLO QCD and NLO EW corrections are considered for the quark-initiated ZZ ∗ [71–
1 For the ggF production mode the prediction with the N 3 LO accuracy in QCD is used.
73] as function of m ZZ ∗ . In addition, a ZZ ∗ sample simulated with the S herpa 2.1.1 generator has been used for systematics studies. This sample includes matrix elements for up to 1 parton at NLO and up to 3 partons at LO.
The gluon induced ZZ ∗ production, for high m ZZ ∗ , is modelled by Sherpa 2.1.1 [74], which includes also the off-shell Higgs boson signal and their interference. For low m ZZ ∗ gg 2VV [75] has been used.
The k-factor accounting for higher order QCD e ff ects for the gg → ZZ ∗ continuum production has been calculated for massless quark loops [76, 77] in the heavy top-quark approximation [78], including the gg → H ∗ → ZZ processes [79]. Based on these studies, a k-factor of 1.7 is used, and a conservative relative uncertainty of 60% on the normalization is applied to the m ZZ ∗ distribution.
The WZ background is modelled using POWHEG-BOX v2 interfaced to PYTHIA 8 and EvtGen v1.2.0.
The triboson backgrounds ZZZ, WZZ, and WWZ with four or more prompt leptons are modelled using S herpa 2.1.1. For the fully leptonic t¯ t + Z background, with four prompt leptons coming from the top and Z decays, MadGraph5_aMC@NLO is used.
Events containing Z bosons with associated jets are simulated using the S herpa 2.2.0 generator. Mat- rix elements are calculated for up to 2 partons at NLO and 4 partons at LO using the Comix [80] and O pen L oops [81] matrix element generators and merged with the S herpa parton shower [82] using the ME + PS@NLO prescription [83]. The CT10 PDF set is used in conjunction with dedicated parton shower tuning developed by the S herpa authors. The Z + jets events are normalised to the NNLO cross sections.
The t¯ t background is modelled using POWHEG-BOX v2 interfaced to PYTHIA 6 [84] for parton shower, fragmentation, and the underlying event and to E vt G en v1.2.0 for properties of the bottom and charm hadron decays.
Generated events are processed through the ATLAS detector simulation [85] within the G eant 4 frame- work [86]. Additional pp interactions in the same and nearby bunch crossings (pileup) are included in the simulation. The simulation samples are weighted to reproduce the observed distribution of the mean number of interactions per bunch crossing in the data.
4 Background estimates
The main background component in the H → ZZ ∗ → 4` final state is the non-resonant ZZ ∗ production which is modelled using simulation normalised to the SM predictions, as described in Section 3. Addi- tional background sources are the Z +jets and t¯ t processes which are estimated in the signal region using di ff erent data-driven techniques according to the flavour of the sub-leading lepton pairs (µµ or ee). The estimation of these backgrounds follows the methods described in [15] with a few small modifications described in the following. The WZ production is included in the data-driven results for the `` + ee final states, while it is added from simulation for the `` + µµ. The contributions from t¯ tV and triboson processes are minor and taken from simulation.
4.1 `` + µµ background
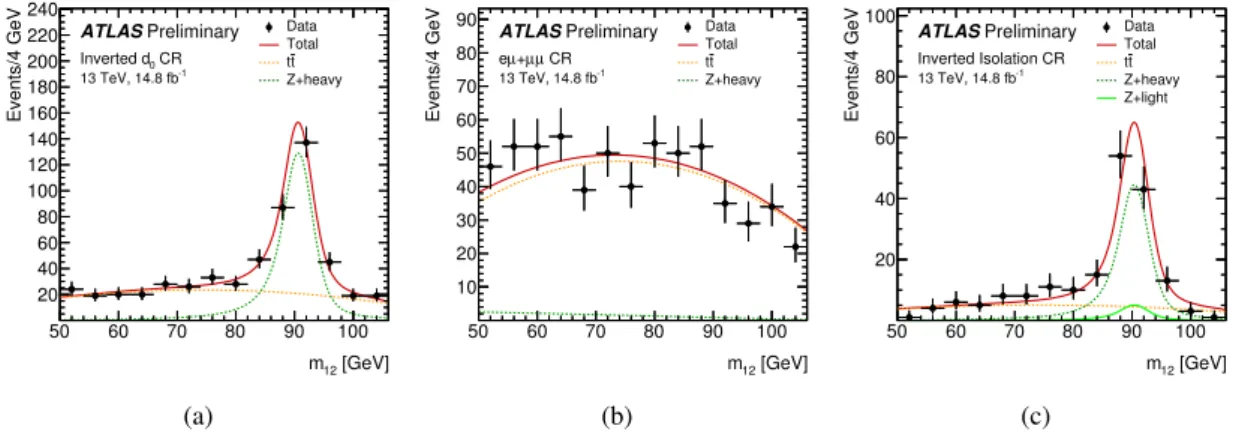
The `` + µµ background is estimated using the shape of the leading dilepton invariant mass m 12 in three
Control Regions (CRs) where each CR is enriched in a di ff erent component (t¯ t, Z + heavy-flavour, Z + light-
flavour) and extrapolated to the signal region using transfer factors.
In a first step, the relative normalisation of the t¯ t and Z + heavy-flavour is obtained with an unbinned maximum-likelihood simultaneous fit of the m 12 spectrum in two orthogonal CRs:
• the inverted-d 0 CR, enriched in Z + heavy-flavour, which has a same-flavour leading di-lepton pair passing the analysis requirements and has the transverse impact parameter significance cut inverted and no isolation requirements on the subleading muon pair.
• the eµ + µµ CR, enriched in t¯ t , in which a di ff erent-flavour leading dilepton pair passing the analysis requirements is accompanied by a subleading dimuon pair without the isolation, transverse impact parameter significance nor charge selections applied.
For the t¯ t component the m 12 distribution is modeled by a second-order Chebyshev polynomial, while for the Z +jets component it is modeled using a convolution of a Breit-Wigner distribution with a Crystal Ball 2 function. The result of the simultaneous fit is shown in Figure 2(a) and Figure 2(b).
The Z +light-flavour component with subleading muons mainly coming from π/K decays in-flight is de- termined in a second step by fitting the m 12 distribution in a third CR (denoted inverted isolation CR) where at least one of the subleading muons fails the isolation cut used in the analysis. The amount of the Z +heavy-flavour and t¯ t components is constrained, within the uncertainties, to the result of the simultan- eous fit in the eµ + µµ CR and inverted-d 0 CR. The result of the fit is show in Figure 2(c). In both steps, the small contribution of ZZ ∗ and WZ is estimated from simulation.
The estimates for the first two components are expressed in terms of yields in a validation region (denoted relaxed CR) defined by applying the analysis event selection except for the isolation and impact parameter significance requirements to the subleading dimuon pair.
Finally, the three background components are extrapolated from the control regions to the signal region using simulated samples. The isolation and impact parameter significance simulation-based e ffi ciencies are validated with data using a Z + µ control sample and the corresponding differences between data and simulation are taken as systematic uncertainties in the transfer factors. Table 6 shows the yields estimated in the relaxed CR for Z + heavy-flavour jets and t¯ t, and the inverted-isolation CR for Z + light- flavour jets backgrounds. The transfer factors used to extrapolate the fitted yields from the control to the signal region and the final estimate in the signal region for the three background components are also shown. The transfer factors are estimated with MC simulation for each background component and are quoted in this table with their statistical uncertainty from the MC sample. For Z +light-flavour jets, a 10%
systematic uncertainty is assigned which corresponds to the difference seen in data and MC simulation in the isolation e ffi ciency.
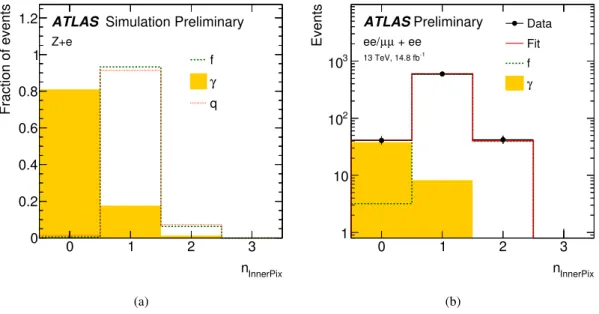
4.2 `` + ee background
The main background in the `` + ee process arises from the misidentification of light-flavour jets as electrons (denoted as f ), photon conversions (denoted as γ) and the semi-leptonic decays of heavy-flavour hadrons (denoted as q). The estimation of the electron background (for f and γ) is extracted from a control region, denoted as 3` + X, where the first three leptons pass the full analysis selection, but the identification criteria for the lower p T electron in the subleading pair (denoted with X) are relaxed. X is only required to have a minimum number of hits in the ID and the same charge as the other subleading electron. The heavy flavour component has a small contribution to the 3` + X CR and is estimated from simulation.
2 a Gaussian core with a power law tail
[GeV]
m
1250 60 70 80 90 100
Events/4 GeV
20 40 60 80 100 120 140 160 180 200 220 240
Data Total t t Z+heavy
ATLAS Preliminary
0 CR Inverted d 13 TeV, 14.8 fb-1
(a)
[GeV]
m
1250 60 70 80 90 100
Events/4 GeV
10 20 30 40 50 60 70 80
90
DataTotal t t Z+heavy
ATLAS Preliminary
CR µ +µ eµ 13 TeV, 14.8 fb-1
(b)
[GeV]
m
1250 60 70 80 90 100
Events/4 GeV
20 40 60 80
100
DataTotal t t Z+heavy Z+light