A TLAS-CONF-2012-017 07 Mar ch 2012
ATLAS NOTE
ATLAS-CONF-2012-017
March 2, 2012
Search for a Standard Model Higgs boson in the mass range 200–600 GeV in the H → ZZ → ` + ` − q q ¯ decay channel with the ATLAS Detector
The ATLAS collaboration
Abstract
A search for a heavy Standard Model Higgs boson decaying via H → ZZ → `
+`
−q q, ¯ where ` = e or µ, is presented. The search uses a data set of pp collisions at √
s = 7 TeV, cor-
responding to an integrated luminosity of 4.7 fb
−1collected in 2011 by the ATLAS detector
at the CERN LHC collider. No significant excess of events above the estimated background
is found. Upper limits at 95% confidence level on the production cross section of a Higgs bo-
son with a mass in the range between 200 and 600 GeV are derived. A Standard Model Higgs
boson with a mass in the range 300 ≤ m
H≤ 310 GeV or 360 ≤ m
H≤ 400 GeV is excluded at
95% CL. The corresponding expected exclusion range is 360 ≤ m
H≤ 400 GeV at 95% CL.
1 Introduction
The search for the Standard Model (SM) Higgs boson [1–3] is one of the most important aspects of the CERN Large Hadron Collider (LHC) physics program. Direct searches performed at the CERN Large Electron-Positron Collider (LEP) excluded at 95% confidence level (CL) the production of a SM Higgs boson with mass m
Hless than 114.4 GeV [4]. Searches at the Fermilab Tevatron p p ¯ collider have excluded at 95% CL the region 156–177 GeV [5]. At the ATLAS experiment at the LHC, the search was extended to the region 200 < m
H< 600 GeV using up to 4.9 fb
−1of √
s = 7 TeV data recorded through 2011. The combination of all the above results [6] ruled out the existence of a SM Higgs boson with a 95% CL in the regions 112.5–115.5 GeV, 131–237 GeV, and 251–468 GeV. Corresponding results from CMS [7], using 4.6 − 4.8 fb
−1of √
s = 7 TeV data, excluded the production of a SM Higgs boson at the 95% CL in the region between 127 < m
H< 600 GeV.
If m
His larger than twice the Z boson mass, m
Z, the Higgs boson is expected to decay to two on-shell Z bosons with a high branching fraction [8]. In this Letter, we consider the Higgs boson mass range 200–
600 GeV and search for a SM Higgs boson decaying to a pair of Z bosons, where one Z boson decays leptonically and the other hadronically: H → ZZ → `
+`
−q q ¯ with ` ≡ e, µ. The largest background to this signal is Z + jets production, with smaller contributions from t¯ t and diboson (ZZ, WZ) production.
This analysis uses the full data set of 4.7 fb
−1recorded by the ATLAS experiment in 2011. Previous results in this channel [6, 9], using up to 2.05 fb
−1of data, excluded a SM Higgs boson production cross section between 1.2 and 12 times the SM cross section over the mass range considered. CMS results for this channel with 4.6 fb
−1have been reported in Ref. [10].
2 Data and Monte Carlo samples
The data used in this search were recorded by the ATLAS experiment during the 2011 LHC run with pp collisions at √
s = 7 TeV. They correspond to an integrated luminosity of approximately 4.7 fb
−1after data quality selections to require that all systems used in this analysis were operational. The data were collected using primarily single-lepton triggers with a transverse momentum (p
T) threshold of between 20 to 22 GeV for electrons and 18 GeV for muons. The resulting trigger criteria are about 95% e ffi cient in the muon channel and close to 100% efficient in the electron channel, relative to the selection criteria described below. Collision events are selected by requiring a reconstructed primary vertex with at least three associated tracks with p
T> 0.4 GeV. The average number of collisions per bunch crossing in this data sample is about nine.
The H → ZZ → `
+`
−q q ¯ signal is modelled using the Monte Carlo (MC) event genera- tor [11, 12], which calculates separately the gluon and vector-boson fusion production mechanisms of the Higgs boson with matrix elements up to next-to-leading order. Events generated with are hadronised with [13], which in turn is interfaced via [14] to model final-state radiation and
[15, 16] to simulate τ decays. The Higgs boson p
Tspectrum is reweighted to the calculation of Ref. [17], which provides QCD corrections up to next-to-leading order and QCD soft-gluon resumma- tions up to next-to-next-to-leading logarithms. The small contribution from Z boson decay to τ leptons is also included in the simulation.
The Higgs boson production cross sections and decay branching ratios [18–21], as well as their uncer-
tainties, are taken from Refs. [8, 22]. The cross sections for gluon-fusion processes have been calculated
at next-to-next-to-leading order (NNLO) in QCD [23–28]. In addition, QCD soft-gluon resummations
up to NNLL are applied for the gluon fusion process [29]. The NLO electroweak (EW) corrections are
applied [30, 31]. These results are compiled in Refs. [32–34] assuming factorisation between QCD and
the production cross section due to the choice of the QCD scale is
+−812% for the gluon fusion process and
±1% for the vector-boson fusion process [8, 22]. The uncertainty in the production cross section due to uncertainties in the parton distribution function (PDF) and α
sis ± 8% for the gluon-initiated process and
±4% for quark-initiated processes [39–43]. The Higgs boson decay branching ratio to the four-fermion final state is predicted by 4 [19, 20], which includes the complete NLO QCD + EW corrections, interference effects between identical final-state fermions, and leading two-loop heavy Higgs boson cor- rections to the four-fermion width. The combined production cross section and decay branching ratio for the H → ZZ → `
+`
−q q ¯ channel ranges from 140 ± 20 fb for m
H= 200 GeV to 10 ± 2 fb for m
H= 600 GeV.
The cross section calculations do not take into account the width of the Higgs boson, which is im- plemented through a relativistic Breit-Wigner line shape applied at the event generator level. It has been suggested [22, 44–46] that effects related to off-shell Higgs boson production and interference with other SM processes may become sizeable for the highest masses (m
H> 400 GeV) considered in this search.
Currently, in the absence of a full calculation for the di ff erent production mechanisms, a conservative estimate of the possible size of such e ff ects is included as a signal normalisation systematic uncertainty following a parametrisation as a function of m
H: 150% × m
3H[TeV], for m
H≥ 300 GeV [22].
Background processes are modelled with several event generators. The generator [47], inter- faced to [48] for parton showers and hadronisation, is used to simulate Z + light-jets events, while
[49] is used for Z + heavy-flavour events. The @ generator [50], interfaced to for parton showers and hadronisation and¡ [51] for the simulation of underlying events, is used for top quark and diboson production; the normalisation of the t¯ t component of top quark production is calcu- lated at NNLO using [52]. The event generator is used to produce alternative samples of Z + jets events to study systematic uncertainties.
The SM ZZ process is an irreducible background for H → ZZ. The q q ¯ → ZZ process (also WZ and WW ) is modelled using , interfaced to and . Alternative samples using and
@ are available for systematics studies: and use only leading-order matrix elements, but they can generate o ff -shell vector bosons, while @ generates only on-shell bosons. The q q ¯ → ZZ production cross section has been calculated up to next-to-leading order in QCD [53]. Due to the large gluon flux at the LHC, next-to-next-to-leading order gluon pair quark-box diagrams (gg → ZZ) are significant and the cross section is increased by 6% to account for this additional contribution [54].
3 Event selection
The ATLAS detector [55] has a forward-backward symmetric cylindrical geometry
1. An inner tracking detector [56] immersed in a 2 Tesla axial magnetic field covers |η| < 2.5 with a combination of silicon detectors and straw tubes. The liquid-argon electromagnetic calorimeter [57] is divided into barrel (|η| <
1.475), endcap (1.375 < |η| < 3.2), and forward (3.2 < |η| < 4.9) regions. The hadronic calorimeters [58]
(using liquid argon or scintillating tiles as active materials) surround the electromagnetic calorimeter and cover |η| < 4.9. The muon spectrometer [59] measures the deflection of muon tracks in the field of three large toroidal magnets and covers |η| < 2.7. A three-level trigger system [60] selects events to be recorded for offline analysis.
The offline selection starts with the reconstruction of either a Z → ee or a Z → µµ pair. Both electron and muon candidates must satisfy p
T> 20 GeV and |η| < 2.5, in addition to standard ATLAS quality requirements [61–63], and must also be isolated from surrounding tracks. Electrons closer than
1
ATLAS uses a right-handed coordinate system with its origin at the nominal interaction point (IP) in the centre of the
detector and the
z-axis coinciding with the axis of the beam pipe. Thex-axis points from the IP to the centre of the LHC ring,and the
y-axis points upward. Cylindrical coordinates (r,φ) are used in the transverse plane,φbeing the azimuthal angle around
the beam pipe. The pseudorapidity is defined in terms of the polar angle
θas
η=−ln tan(θ/2).
∆ R ≡ p
(∆ η)
2+ (∆ φ)
2< 0.2 to a muon are rejected. Two muons in a pair must have opposite charge, but this is not required for electrons because larger energy losses from bremsstrahlung lead to higher charge misidentification probabilities, and also because a muon with mismeasured charge has a very large momentum uncertainty. The pair’s invariant mass must lie within the range 83 < m
``< 99 GeV, and any events with more than two selected electrons or muons are rejected to reduce background from WZ decay.
H → ZZ → `
+`
−q q ¯ candidates also contain a pair of jets from Z → q q ¯ decay and no high-p
Tneutrinos. At least two jets with E
T> 25 GeV and |η| < 2.5 are required; jets are reconstructed with an anti-k
talgorithm [64] with a radius parameter R = 0.4 and are calibrated using energy- and η-dependent correction factors based on Monte Carlo simulation and validated on data [65]. Jets within ∆ R < 0.4 of an electron or with less than 75% of the momentum of its associated tracks originating from the primary vertex are rejected. The missing transverse momentum, E
Tmiss, is calculated by summing the transverse momenta of all calorimeter energy clusters with |η| < 4.5 and all identified muons and must satisfy E
missT< 50 GeV. This latter requirement reduces mostly background from t¯ t production.
Jets which originate from b-quarks can be discriminated from other jets (“tagged”) based on the relatively long lifetime (cτ ≈ 450 µm) of hadrons containing b-quarks. This is important for this analysis since about 21% of signal events contain b-jets from Z → b b ¯ decay, while a b-jet pair is produced less often (∼ 2%) in the dominant Z + jets background. A jet is tagged by considering the set of tracks associated with the jet and looking for either a secondary vertex or for tracks that have a significant impact parameter with respect to the primary event vertex [66]. This information is combined into a single discriminating variable using multivariate techniques, and a cut applied that gives an e ffi ciency of about 70% for identifying real b-jets with a light-quark jet rejection of about 140. To optimise the expected sensitivity, the analysis is divided into a “tagged” subchannel, containing events with two b- tags, and an “untagged” subchannel, containing events with less than two b-tags. Events with more than two b-tags (< 1% of the data sample with ≥ 2 jets) are rejected.
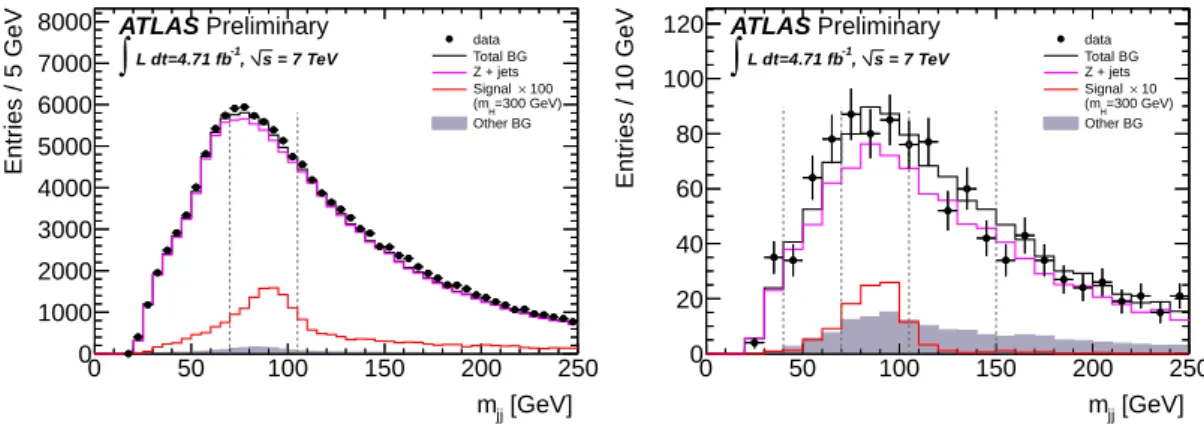
Events are then required to have at least one candidate Z → q q ¯ decay with dijet invariant mass satisfying 70 < m
j j< 105 GeV in order to be consistent with a Z boson decay. This cut is asymmetric around the Z boson mass since there are non-Gaussian tails extending to lower masses. Candidates are also required to have ∆ R
j j> 0.7, in order to exclude regions of phase space that are poorly modelled by Monte Carlo simulation. For untagged events, all pairs of jets formed from the three leading p
Tjets are considered. All such pairs are retained with unit weight, leading to the possibility of multiple candidates per event (the fraction of untagged events with more than one pair retained is 13–16% (2–5%) for the low-m
H(high-m
H) selection defined below). For tagged events, the two tagged jets are used to form the dijet invariant mass; their energies are corrected to take into account the average energy scale difference between heavy- and light-quark jets. Dijet invariant mass distributions before the m
j jrequirement are shown in Fig. 1.
This defines the “low-m
H” selection. For larger Higgs boson masses, the Z bosons from H → ZZ decay have large momenta in the laboratory reference frame, decreasing the opening angles between their decay products. A “high-m
H” selection is defined by the following additional requirements: (1) the two jets must have p
T> 45 GeV, and (2) ∆ φ
``< π/2 and ∆ φ
j j< π/2. This selection is applied when searching for a Higgs boson with m
H≥ 300 GeV, for which it improves the sensitivity.
Following this event selection, an H → ZZ → `
+`
−q q ¯ signal is expected to appear as a peak in the
invariant mass distribution of the `` j j system, with m
``j jaround m
H. To improve the Higgs boson mass
resolution, the energies of the jets forming each dijet pair are scaled by a single multiplicative factor to
set the dijet invariant mass m
j jto the nominal mass of the Z boson. The total e ffi ciency for the selection
of signal events is about 8% over most of the mass range.
[GeV]
mjj
0 50 100 150 200 250
Entries / 5 GeV
0 1000 2000 3000 4000 5000 6000 7000 8000
data Total BG Z + jets
× 100 Signal
=300 GeV) (mH Other BG
ATLAS Preliminary
= 7 TeV s
-1, L dt=4.71 fb
∫
[GeV]
mjj
0 50 100 150 200 250
Entries / 10 GeV
0 20 40 60 80 100
120 data
Total BG Z + jets
× 10 Signal
=300 GeV) (mH Other BG
ATLAS Preliminary
= 7 TeV s
-1, L dt=4.71 fb
∫
Figure 1: Distributions of the invariant mass of selected dijet pairs, m
j j, for the data and the MC simula- tion, for the untagged (left) and tagged (right) samples. The signal has been scaled up by a factor of 100 (10) in the untagged (tagged) case to make it more visible. The vertical lines show the range of the m
j jselection.
4 Background estimates
The principal background to this analysis is Z boson production in association with jets (Z + jets). The shape of this background is taken from Monte Carlo simulations and checked against data, while the normalisation is derived directly from data. The Z +light-jet component of the background is modelled using , while the Z + heavy-flavour component is modelled using . The Monte Carlo is initially split into samples with at least one true b-jet, at least one true c-jet, and all light jets. Scale factors for each sample are derived by comparing the distribution of the b-tagging discriminant between data and Monte Carlo for a sample of Z + 2 jets events. The Z + b jets scale factor is determined from a fit to the b-tagging discriminant distribution of one jet after requiring a b-tag from the other. The Z + c-jets and Z +light-jets scale factors are then determined from a fit to the b-tagging discriminant distribution formed from both jets. This is used to fix the relative contributions of Z + c-jet, Z + b-jet, and Z + light-jets.
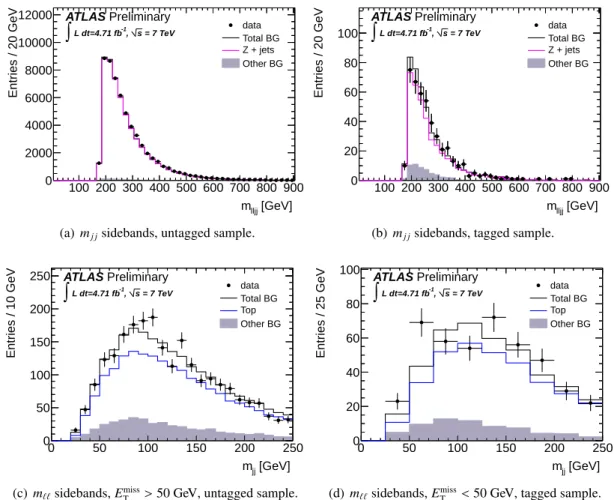
To set the overall normalisation, the m
``j jdistribution after the jet and E
missTrequirements is compared between data and Monte Carlo for events with the dijet invariant mass in sidebands of the Z boson mass, 40 < m
j j< 70 GeV or 105 < m
j j< 150 GeV; see Figs. 2(a,b). The Monte Carlo gives a good description of the shape, but predicts about 5% more events than are seen in the data. The numbers of events in the sidebands, after subtraction of the small contribution from other background sources, are used to derive scale factors to correct the normalisation of the Z + jets Monte Carlo to that observed in the data. The scale factors are determined for the untagged channel separately for the low- and high-m
Hselections;
the results are statistically compatible. In the tagged channel, there are too few events in the sidebands to determine the scale factor for the high-m
Hselection, hence the low-m
Hscale factor is used for both selections. The scale factors for the tagged and untagged channels agree within statistical uncertainties.
The next most significant background to this analysis is top quark production, which is most impor- tant in the tagged channel. As for Z + jets, the shape is taken from Monte Carlo and the normalisation set from data, using the sidebands 60 < m
``< 76 GeV or 106 < m
``< 150 GeV of the dilepton mass dis- tribution. Figures 2(c,d) show the m
j jdistributions for these sidebands, both for the untagged selection (with the E
Tmissselection reversed) and the tagged selection; good agreement is found after scaling up the Monte Carlo prediction by about 10%.
As in Ref. [9], the small irreducible background from diboson production is estimated directly from
Monte Carlo simulation. The background due to multijet events in which jets are misidentified as isolated
electrons is estimated from data using a sample of events containing electron candidates that fail the
[GeV]
mlljj
100 200 300 400 500 600 700 800 900
Entries / 20 GeV
0 2000 4000 6000 8000 10000 12000
data Total BG Z + jets Other BG
ATLAS Preliminary
= 7 TeV s
-1, L dt=4.71 fb
∫
(a)
mj jsidebands, untagged sample.
[GeV]
mlljj
100 200 300 400 500 600 700 800 900
Entries / 20 GeV
0 20 40 60 80
100 dataTotal BG
Z + jets Other BG
ATLAS Preliminary
= 7 TeV s
-1, L dt=4.71 fb
∫
(b)
mj jsidebands, tagged sample.
[GeV]
mjj
0 50 100 150 200 250
Entries / 10 GeV
0 50 100 150 200 250
data Total BG Top Other BG
ATLAS Preliminary
= 7 TeV s
-1, L dt=4.71 fb
∫
(c)
m``sidebands,
EmissT >50 GeV, untagged sample.
[GeV]
mjj
0 50 100 150 200 250
Entries / 25 GeV
0 20 40 60 80 100
data Total BG Top Other BG
ATLAS Preliminary
= 7 TeV s
-1, L dt=4.71 fb
∫
(d)
m``sidebands,
ETmiss<50 GeV, tagged sample.
Figure 2: Distributions from the background control samples, after application of scale factors. Top
row: the `` j j invariant mass for 40 < m
j j< 70 GeV or 105 < m
j j< 150 GeV after the jet and E
missTrequirements, for (a) the untagged and (b) the tagged sample. Bottom row: the invariant mass of the j j
system for events with 60 < m
``< 76 GeV or 106 < m
``< 150 GeV for (c) the untagged sample with
the additional requirement E
missT> 50 GeV and (d) the tagged sample with E
Tmiss< 50 GeV.
selection requirements but pass loosened requirements. The multijet background to the muon channel was found to be negligible. The background from W + jets production was also found to be negligible.
5 Systematic uncertainties
The theoretical uncertainties on the Higgs boson production cross section compiled in Refs. [8, 22] are 15–20% for the gluon fusion process and 3–9% for the vector-boson fusion process, depending on the Higgs boson mass. As mentioned in Section 2, an additional uncertainty ∝ m
3His applied for m
H>
300 GeV. The uncertainty on the selection e ffi ciency due to the modelling of the signal kinematics is estimated by varying parameters of the signal MC simulation, including the amount of initial- and final-state radiation, the factorisation and normalisation scales, and the underlying event model. Signal samples generated with instead of are used as a further comparison. This results in a 3%
(12%) uncertainty for the low- (high-) m
Hselection.
The uncertainty in the normalisation of the Z + jets background from the procedure described in Sec- tion 4 is evaluated by comparing the scale factors obtained from the upper or lower sideband separately.
It is taken as the di ff erence between the scale factors or the statistical uncertainty, whichever is larger.
This gives 2.1% for the low-m
Huntagged selection, 2.4% for the high-m
Huntagged selection, and 5.9%
for both tagged selections. The uncertainty on the shape of the Z + jets background is estimated by reweighting the Monte Carlo m
j jdistribution to agree with the data in the sidebands, and then applying this reweighting within the signal region. A similar procedure is used to estimate an uncertainty from the shape of the Z boson transverse momentum distribution. The uncertainty in the normalisation of the t¯ t background is derived from the statistical uncertainties on the normalisation scale factors. It is found to be 2.5% for the untagged selection and 3.6% for the tagged selection. The diboson backgrounds, which are estimated directly from Monte Carlo, have a combined 5% scale and 6.6 PDF uncertainty on the cross section; adding an additional 10% uncertainty, corresponding to the maximum di ff erence seen between @ and k-factor scaled results, yields an overall uncertainty of 11%. A 50%
systematic uncertainty is assigned to the normalisation of the multijet background in the electron channel from the procedure described in Section 4 by comparing the result of fitting the m
``distribution before and after the requirement of at least two jets. An overall 3.9% uncertainty from the total integrated lumi- nosity [67] is added to the uncertainties on all Monte Carlo processes that are not normalised from data (i.e., excluding Z + jets and top), correlated across all samples.
There are also systematic uncertainty contributions from detector effects, including the lepton and jet trigger and identification efficiencies, the energy or momentum calibration and resolution of the leptons and jets, and the b-tagging e ffi ciency and mistag rates. The dominant uncertainty on the tagged sample comes from the b-tagging efficiency, which corresponds to an average uncertainty of 14% on the signal.
For the untagged sample, the uncertainties on the jet energy scale and the b-tagging efficiency contribute about 4% each to the uncertainty on the signal.
6 Results
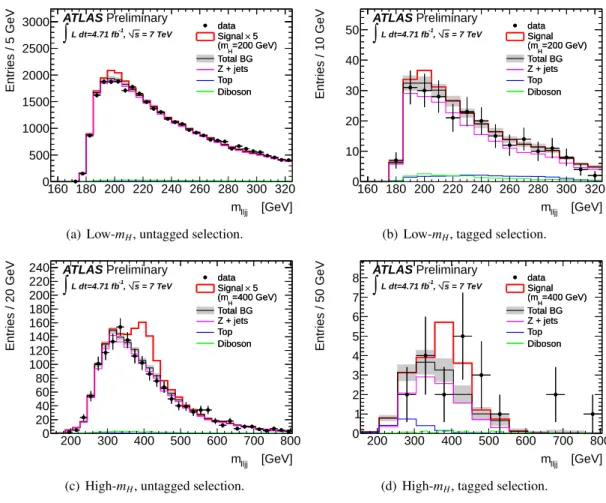
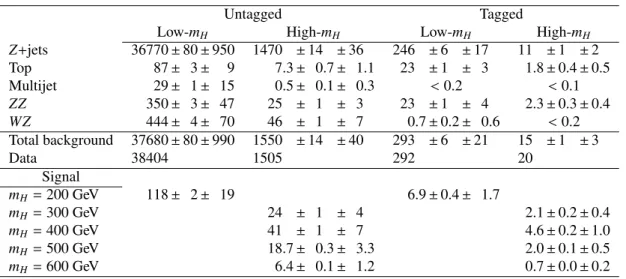
Table 1 shows the numbers of candidates observed in data for each of the four selections compared with the background expectations. Figure 3 shows the m
``j jdistributions for both the tagged and untagged channels for the low- and high-m
Hselections.
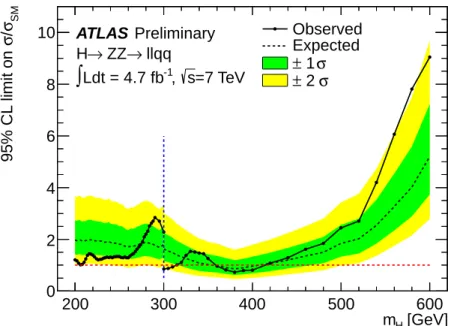
No significant excess of events above the expected background is observed. Upper limits are set on
the SM Higgs boson cross section at 95% CL as a function of mass, using the CL
smodified frequentist
formalism with the profile likelihood test statistic [68, 69]. This is based on a likelihood that compares,
bin-by-bin using Poisson statistics, the observed m
``j jdistribution to either the expected background or
[GeV]
mlljj
160 180 200 220 240 260 280 300 320
Entries / 5 GeV
0 500 1000 1500 2000 2500
3000 data
× 5 Signal
=200 GeV) (mH
Total BG Z + jets Top Diboson
ATLAS Preliminary
= 7 TeV s
-1, L dt=4.71 fb
∫
dataSignal =200 GeV)× 5(mH
Total BG Z + jets Top Diboson
(a) Low-m
H, untagged selection.
[GeV]
mlljj
160 180 200 220 240 260 280 300 320
Entries / 10 GeV
0 10 20 30 40
50 dataSignal
=200 GeV) (mH
Total BG Z + jets Top Diboson
ATLAS Preliminary
= 7 TeV s
-1, L dt=4.71 fb
∫
dataSignal=200 GeV)(mH
Total BG Z + jets Top Diboson
(b) Low-m
H, tagged selection.
[GeV]
mlljj
200 300 400 500 600 700 800
Entries / 20 GeV
0 20 40 60 80 100 120 140 160 180 200 220 240
data
× 5 Signal
=400 GeV) (mH
Total BG Z + jets Top Diboson
ATLAS Preliminary
= 7 TeV s
-1, L dt=4.71 fb
∫
dataSignal =400 GeV)× 5(mH
Total BG Z + jets Top Diboson
(c) High-m
H, untagged selection.
[GeV]
mlljj
200 300 400 500 600 700 800
Entries / 50 GeV
0 1 2 3 4 5 6 7
8 data
Signal
=400 GeV) (mH
Total BG Z + jets Top Diboson
ATLAS Preliminary
= 7 TeV s
-1, L dt=4.71 fb
∫
dataSignal=400 GeV)(mH
Total BG Z + jets Top Diboson
(d) High-m
H, tagged selection.
Figure 3: The invariant mass of the `` j j system for both the untagged (a,c) and tagged (b,d) channels,
for the low-m
H(top row) and high-m
H(bottom row) selections. Examples of the expected Higgs boson
signal for m
H= 200 and 400 GeV are also shown; in the untagged plots (a,c), the signal has been scaled
up by a factor of 5 to make it more visible.
Table 1: The expected numbers of signal and background candidates in the H → ZZ → `
+`
−q q ¯ channel, along with the numbers of candidates observed in data, for an integrated luminosity of 4.7 fb
−1. The first error indicates the statistical uncertainty, the second error the systematic uncertainty.
Untagged Tagged
Low-m
HHigh-m
HLow-m
HHigh-m
HZ + jets 36770 ± 80 ± 950 1470 ± 14 ± 36 246 ± 6 ± 17 11 ± 1 ± 2 Top 87 ± 3 ± 9 7.3 ± 0.7 ± 1.1 23 ± 1 ± 3 1.8 ± 0.4 ± 0.5 Multijet 29 ± 1 ± 15 0.5 ± 0.1 ± 0.3 < 0.2 < 0.1 ZZ 350 ± 3 ± 47 25 ± 1 ± 3 23 ± 1 ± 4 2.3 ± 0.3 ± 0.4 WZ 444 ± 4 ± 70 46 ± 1 ± 7 0.7 ± 0.2 ± 0.6 < 0.2 Total background 37680 ± 80 ± 990 1550 ± 14 ± 40 293 ± 6 ± 21 15 ± 1 ± 3
Data 38404 1505 292 20
Signal
m
H= 200 GeV 118 ± 2 ± 19 6.9 ± 0.4 ± 1.7
m
H= 300 GeV 24 ± 1 ± 4 2.1 ± 0.2 ± 0.4
m
H= 400 GeV 41 ± 1 ± 7 4.6 ± 0.2 ± 1.0
m
H= 500 GeV 18.7 ± 0.3 ± 3.3 2.0 ± 0.1 ± 0.5
m
H= 600 GeV 6.4 ± 0.1 ± 1.2 0.7 ± 0.0 ± 0.2
the sum of the expected background and a mass-dependent hypothesised signal. Systematic uncertainties, with their correlations, are incorporated as nuisance parameters, and the tagged and untagged channels are combined by forming the product of their likelihoods. Figure 4 shows the resulting upper limit on the cross section for Higgs boson production and decay in the channel H → ZZ → `
+`
−q q ¯ relative to the prediction of the Standard Model as a function of the hypothetical Higgs boson mass.
7 Summary
A search for the SM Higgs boson in the decay mode H → ZZ → `
+`
−q q ¯ has been performed in the Higgs mass range 200 to 600 GeV using 4.7 fb
−1of √
s = 7 TeV pp data recorded by the ATLAS experiment at the LHC. No significant excess over the expected background is found. A Standard Model Higgs boson is excluded at a 95% CL within the range 300 ≤ m
H≤ 310 GeV or 360 ≤ m
H≤ 400 GeV.
The corresponding expected exclusion range is 360 ≤ m
H≤ 400 GeV at 95% CL.
References
[1] F. Englert and R. Brout, Broken Symmetry and the Mass of Gauge Vector Mesons, Phys. Rev. Lett.
13 (1964) 321–323.
[2] P. W. Higgs, Broken Symmetries and the Masses of Gauge Bosons, Phys. Rev. Lett. 13 (1964) 508–509.
[3] G. S. Guralnik, C. R. Hagen, and T. W. B. Kibble, Global Conservation Laws and Massless Particles, Phys. Rev. Lett. 13 (1964) 585–587.
[4] LEP Working Group for Higgs boson searches, ALEPH, DELPHI, L3 and OPAL Collaborations, Search for the standard model Higgs boson at LEP, Phys. Lett. B 565 (2003) 61–75,
arXiv:hep-ex/0306033.
[GeV]
m
H200 300 400 500 600
SM
σ / σ 9 5 % C L l im it o n
0 2 4 6 8
10 Observed
Expected σ
± 1 σ
± 2 Preliminary
ATLAS llqq
→
→ ZZ H
=7 TeV s
-1