A TLAS-CONF-2013-010 06 Mar ch 2013
ATLAS NOTE
ATLAS-CONF-2013-010
March 5, 2013
Search for the Standard Model Higgs boson in H → µ + µ − decays with the ATLAS detector
The ATLAS Collaboration
Abstract
An inclusive search for the Standard Model Higgs boson decaying into a muon–antimuon pair has been performed using data with an integrated luminosity of 20.7 fb
−1collected with the ATLAS detector in pp collisions at √
s = 8 TeV at the Large Hadron Collider. No evidence of a signal is observed and upper limits are set on the Higgs boson production as a function of the Higgs boson mass. The observed (expected) limit at the 95% CL for the Higgs boson with a mass of 125 GeV is 9.8 (8.2) times the Standard Model prediction.
c
Copyright 2013 CERN for the benefit of the ATLAS Collaboration.
Reproduction of this article or parts of it is allowed as specified in the CC-BY-3.0 license.
1 Introduction
The Standard Model (SM) of particle physics describes exceptionally well nearly all of experimental particle physics data. In the SM, the Brout-Englert-Higgs (BEH) mechanism [1–3] spontaneously breaks electroweak (EW) gauge symmetry and generates mass terms for the W and Z gauge bosons and also for the fermion fields via Yukawa couplings. As a consequence of the BEH mechanism, the SM predicts the existence of a heavy scalar particle (the Higgs boson, H); the search for this particle is a highlight of the Large Hadron Collider (LHC) physics program.
In the summer of 2012 the ATLAS and CMS collaborations discovered a new particle with a mass of approximately 125 GeV [4, 5] via decays to photon, W and Z boson pairs with rates consistent with those of the SM Higgs boson. There are three experimentally accessible channels at the LHC for detecting Higgs boson decays to fermions: H → b b, ¯ H → τ
+τ
−and H → µ
+µ
−. The branching ratios for these decays are proportional to the squares of the fermion masses with the b b ¯ and τ
+τ
−decay modes dominant for m
H=125 GeV.
The H → µ
+µ
−decay has a clean final-state signature and it is the only channel where the Higgs coupling to second generation fermions can be measured at the LHC. This is a very challenging mea- surement due to the small H → µ
+µ
−branching ratio and high SM backgrounds. The SM branching ratio for the H → µ
+µ
−decays varies from 28 × 10
−5to 6 × 10
−5in the Higgs boson mass range 110–150 GeV [6, 7]. The dominant irreducible SM background is the Z/γ
∗→ µ
+µ
−process with a very high production rate compared to an expected Higgs signal. Possible extensions of the SM, such as the Minimal Supersymmetric extension (MSSM), postulate the existence of additional Higgs boson-like particles with enhanced branching ratios to muons [8–11].
In this document, an inclusive search for the SM Higgs boson in the H → µ
+µ
−decay mode is presented. The di-muon invariant mass range of 110–150 GeV is examined for the presence of a nar- row resonance with the signal width completely dominated by detector resolution e ff ects. An a priori defined signal region is examined only after the analysis is fully developed using simulated signal and background Monte Carlo (MC) samples and validated in data control regions designed to be depleted of signal events.
2 Data and simulated samples
This search is performed on a data sample recorded in 2012 by the ATLAS detector at √
s = 8 TeV at the LHC. The ATLAS detector [12] is a general-purpose particle detector with a cylindrical geometry which consists of several subdetectors surrounding the interaction point and covering almost the full solid angle. The trajectory and momenta of charged particles are measured within the pseudorapidity region
|η| < 2.5 by multi-layer silicon pixel and strip detectors and a transition radiation tracker. The tracking system is immersed in a superconducting solenoid producing a 2 T magnetic field and is surrounded by a high-granularity liquid-argon (LAr) sampling electromagnetic calorimeter with coverage up to |η| <
3.2. An iron and scintillator tile hadronic calorimeter provides coverage in the range |η| < 1.7. In the forward region LAr calorimeters provide both electromagnetic and hadronic measurements and extend the coverage to |η| < 4.9. The calorimeters provide good containment for electromagnetic and hadronic showers and substantially reduce particle punch-throughs into the muon system. The muon spectrometer (MS) surrounds the calorimeters and consists of three large air-core superconducting magnets, each with eight coils, providing an approximately 1 T toroidal field, a system of precision tracking chambers, and fast detectors for triggering; it provides coverage up to |η| < 2.7.
Events are selected with a trigger [13] requiring at least one muon with transverse momentum p
T>
24 GeV. This trigger is approximately 65% e ffi cient for muons with |η| < 1.05 and 90% e ffi cient for
muons with |η| > 1.05. After applying data quality requirements, the total integrated luminosity of the
selected data sample is 20.7 ± 0.7 fb
−1.
At the LHC, SM Higgs boson production is dominated by the gluon fusion (ggF) process with small contributions from the vector boson fusion (V BF) process and production in association with vector bosons (V H ) [6, 7]. The signal MC samples are generated in 5 GeV steps of the Higgs mass from 110 GeV to 150 GeV. The ggF and V BF samples are generated with P owheg [14, 15], using next-to-leading order (NLO) calculations, with the parton showering modeled using Pythia8 [16]. The CT10 [17] parton density function (PDF) is used, with the ATLAS Underlying Event Tune, AU2 [18].
The ggF Higgs boson p
Tspectrum in P owheg is tuned to agree with the prediction from HqT [19]. The V H samples are generated with Pythia8, using AU2 and the CTEQ6 [20] PDF.
The cross section for the ggF process has been calculated to next-to-next-to-leading order (NNLO) [21–26] in QCD and to NLO for electroweak (EWK) processes assuming that the QCD and EWK cor- rections factorize. In addition, QCD soft-gluon resummations have been calculated in the next-to-next- to-leading logarithm (NNLL) approximation and are applied in P owheg . The cross section for the V BF process are calculated with full NLO QCD and EWK corrections [27–29] and approximate NNLO QCD corrections [30]. The cross section for the V H production is calculated at NNLO [31, 32] in QCD, and NLO EWK radiative corrections [33] are applied. The branching fractions for H → µ
+µ
−decays as a function of m
Hare calculated using the H decay [34] program.
The following MC event generators are used to model background processes: A lpgen [35] + H erwig [36]
for W +jets, MC@NLO [37]+Herwig for t¯ t, tW and tb, AcerMC [38]+Pythia for tqb, Powheg+Pythia8 for Z/γ
∗+ jets and q q ¯ → WW , gg2WW [39] + H erwig for gg → WW , P owheg [40] + P ythia for WZ and ZZ and M ad G raph [41, 42] + P ythia for Wγ
∗. WZ decays are defined by requiring min(m
µ+µ−) >7 GeV while Wγ
∗decays are required to have min(m
µ+µ−) <7 GeV. The signal and background MC samples are processed through the ATLAS detector simulation [43] based on G eant 4 [44], followed by the same reconstruction algorithms as used for collision data. The e ff ects from multiple simultaneous collisions (pileup) are included in the MC simulation, matching pileup conditions of the selected data sample.
The simulated samples of the background processes are used to derive an analytical background parametrization. The overall background normalization and background shape parameters are measured directly from data signal regions as explained in Section 4.
3 Event selection
Proton-proton collision events are required to contain at least one reconstructed primary vertex candidate of a pp interaction with at least three associated tracks with p
T,track> 0.4 GeV. The vertex with the largest sum of p
2T,trackis considered to be the primary vertex. Muons are reconstructed by matching tracks in the inner detector to tracks reconstructed in the muon spectrometer [45]. In addition to stringent track quality requirements imposed for muon identification, the muon tracks must also be consistent with originating from the primary vertex. All selected muons are restricted to be within |η| < 2.5. Muon candidates must pass both the track and calorimeter isolation requirements that scale with the p
Tof the muon track.
The isolation is calculated as a scalar sum of the p
Tof additional tracks or calorimeter energy deposits in a cone around of the muon track. Jets are reconstructed using the anti-k
talgorithm [46, 47] with a distance parameter of 0.4. The selected jets must satisfy E
T> 25 GeV and |η| < 4.5. Muon candidates overlapping with the selected jets within a cone ∆ R = p
(∆ φ)
2+ (∆ η
2) < 0.4 are removed from the analysis.
Corrections are applied to simulated MC samples in order to account for differences between data
and MC simulation for the trigger and identification efficiencies and for the muon momentum scale and
resolution. The trigger and reconstruction e ffi ciency corrections are measured using Z events and are
found to be within 2% of unity. The muon momentum corrections are determined by comparing the
reconstructed mass distribution of Z events in data with those from simulated events; these corrections
are within 0.1% of unity.
H → µ
+µ
−candidate events are selected by requiring exactly two oppositely charged muons with transverse momentum p
µT1> 25 GeV and p
µT2> 15 GeV for the leading and sub-leading muons, respec- tively. Selected events must contain at least one muon identified by the trigger system within a cone
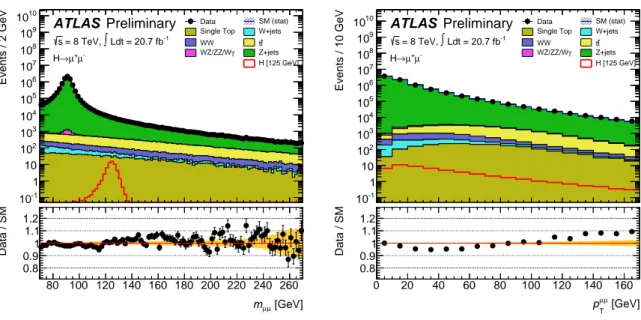
∆ R < 0.15 centered on a reconstructed muon candidate. Fig. 1 shows the distributions of the di-muon invariant mass m
µ+µ−and the di-muon transverse momentum, p
µ+µ−
T
for the selected data and MC events.
The selection efficiencies for the signal events with m
H= 125 GeV after all selection criteria described thus far are 58.1 ± 0.2 % for ggF, 58.1 ± 0.2 % for V BF, 48.0 ± 0.2 % for W H, and 51.5 ± 0.2 % for ZH.
The di-muon transverse momentum p
µ+µ−
T
is required to be greater than 15 GeV in order to sup- press the Drell-Yan background. This selection removes approximately 60% of background events while keeping around 80% of signal events. The di-muon invariant mass m
µ+µ−is examined in the range 105 GeV < m
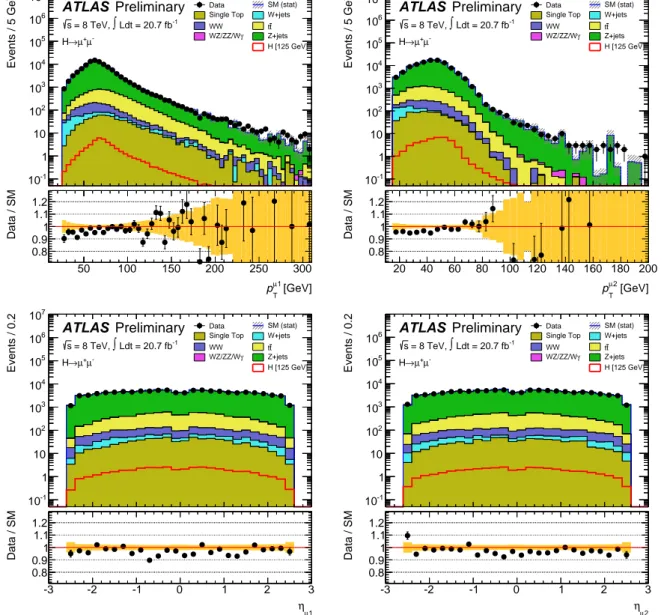
µ+µ−< 160 GeV (the signal region). This range is larger than the 110–150 GeV search window in order to account for the finite signal width. Fig. 2 shows the distributions of the leading and sub-leading muon momentum p
µTand pseudo-rapidity η
µfor the signal region events. The number of expected signal events for m
H= 125 GeV and the number of observed data events in the region from 120 to 130 GeV is shown in Table 1.
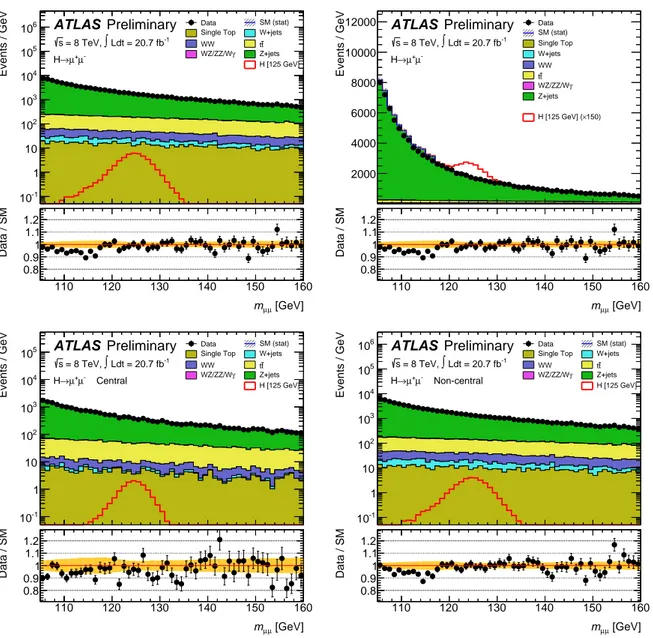
To maximize search sensitivity, the selected events are further subdivided into the central category,
|η(µ
1,2)| < 1, and the non-central category containing all remaining events. The muon momentum mea- surement for the central events is more precise producing a narrower di-muon mass distribution for signal events, as described in Section 4, and thus resulting in a slightly higher overall signal sensitivity. Fig. 3 shows the distribution of the di-muon invariant mass, m
µ+µ−, for the full data sample and separately for the central and non-central events.
Events failing the p
µT+µ−criteria form a control region. Similarly to the signal region, the control region is divided into the central and non-central categories. These two control regions are used to validate a background model as explained in Section 4.
The dominant backgrounds in this search are Z/γ
∗→ µ
+µ
−production, single and pair production of top quarks and di-boson processes. Table 1 also shows the expected MC background contributions as an illustration of typical background composition. W boson production in association with one or more jets (W + jets), where one of the jets is mis-reconstructed as a muon, is a relatively small background source.
The W +jets background contribution is estimated from a data driven control region using like-sign di- muon events where selection criteria for one of the muons are relaxed. A MC derived scale factor is then applied to extrapolate the di-muon invariant mass spectrum from the control region to the signal region.
The MC background estimates and data driven W +jets estimates are only used for plots and tables shown in this section. All SM backgrounds have smooth m
µ+µ−distributions in the search window and the final background estimate is derived from a fit to the data signal regions as described in Sections 4 and 6.
4 Signal and background models
In order to derive the statistical results described in Section 6, a binned maximum likelihood fit is per- formed to the di-muon mass distributions for the central and non-central categories. The fit uses a sum of background and signal probability density functions (pdf). The background pdf is a sum of the Breit- Wigner (BW) and exponential pdfs:
P
BG(x) = f
BW· BW (x, M
Z, Γ
Z) + (1 − f
BW) · P(e
B·x), (1)
where x represents the di-muon invariant mass and f
BWrepresents the fraction of the BW contribution
when both pdfs are normalized to unity. In the fits, the width and the mean of the BW function are
fixed to the world average values for the width and the mass of the Z boson [48]. The MC simulation
Events / 2 GeV
10-1
1 10 102
103
104
105
106
107
108
109
1010 Data SM (stat)
Single Top W+jets
WW tt
WZ/ZZ/Wγ Z+jets H [125 GeV]
ATLAS Preliminary
Ldt = 20.7 fb-1
∫
= 8 TeV, s
µ-
µ+
→ H
[GeV]
µ
mµ
80 100 120 140 160 180 200 220 240 260
Data / SM
0.8 0.9 1 1.1 1.2
Events / 10 GeV
10-1
1 10 102
103
104
105
106
107
108
109
1010 Data SM (stat)
Single Top W+jets
WW tt
WZ/ZZ/Wγ Z+jets H [125 GeV]
ATLAS Preliminary
Ldt = 20.7 fb-1
∫
= 8 TeV, s
µ-
µ+
→ H
[GeV]
µ µ
pT
0 20 40 60 80 100 120 140 160
Data / SM
0.8 0.9 1 1.1 1.2
Figure 1: The distribution of the di-muon invariant mass m
µ+µ−(left), and the di-muon transverse mo- mentum, p
µ+µ−
T
(right) with the requirements on the muon track quality, muon isolation and minimum momentum for both muons applied. The signal is shown for m
H= 125 GeV. The yellow band in the ratio plots shows statistical uncertainty of the MC samples.
|m
H− m
µµ| ≤ 5 GeV Signal [125 GeV] 37.7 ± 0.2
WW 250 ± 4
WZ/ZZ/Wγ 30 ± 1
t¯ t 1374 ± 13
Single Top 151 ± 5
Z +jets 15810 ± 130
W +jets 88 ± 6
Total Bkg. 17700 ± 130
Observed 17442
Table 1: Number of expected signal events for m
H= 125 GeV, number of the expected MC background
events and number of the observed data events within |m
H− m
µ+µ−| ≤ 5 GeV window after all selection
criteria applied. Only statistical uncertainties are given. The numbers shown in this table have been
rounded.
Events / 5 GeV
10-1
1 10 102
103
104
105
106
107
Data SM (stat)
Single Top W+jets
WW tt
γ WZ/ZZ/W Z+jets
H [125 GeV]
ATLAS Preliminary
Ldt = 20.7 fb-1
∫
= 8 TeV, s
µ-
µ+
→ H
[GeV]
µ1
pT
50 100 150 200 250 300
Data / SM
0.8 0.9 1 1.1 1.2
Events / 5 GeV
10-1
1 10 102
103
104
105
106
107 Data SM (stat)
Single Top W+jets
WW tt
γ WZ/ZZ/W Z+jets
H [125 GeV]
ATLAS Preliminary
Ldt = 20.7 fb-1
∫
= 8 TeV, s
µ-
µ+
→ H
[GeV]
µ2
pT
20 40 60 80 100 120 140 160 180 200
Data / SM
0.8 0.9 1 1.1 1.2
Events / 0.2
10-1
1 10 102
103
104
105
106
107
Data SM (stat)
Single Top W+jets
WW tt
γ WZ/ZZ/W Z+jets
H [125 GeV]
ATLAS Preliminary
Ldt = 20.7 fb-1
∫
= 8 TeV, s
µ-
µ+
→ H
µ1
η
-3 -2 -1 0 1 2 3
Data / SM
0.8 0.9 1 1.1 1.2
Events / 0.2
10-1
1 10 102
103
104
105
106
Data SM (stat)
Single Top W+jets
WW tt
γ WZ/ZZ/W Z+jets
H [125 GeV]
ATLAS Preliminary
Ldt = 20.7 fb-1
∫
= 8 TeV, s
µ-
µ+
→ H
µ2
η
-3 -2 -1 0 1 2 3
Data / SM
0.8 0.9 1 1.1 1.2
Figure 2: The distribution of the leading (top left) and sub-leading muon (top right) momentum p
µT,
and the leading (bottom left) and sub-leading muon (bottom right) pseudo-rapidity η
µ, before the muon
momentum resolution categorization requirements applied. The signal is shown for m
H= 125 GeV. The
yellow band in the ratio plots shows statistical uncertainty of the MC samples.
Events / GeV
10-1
1 10 102
103
104
105
106 Data Single Top SM (stat) W+jets
WW tt
γ WZ/ZZ/W Z+jets
H [125 GeV]
ATLAS Preliminary
Ldt = 20.7 fb-1
∫
= 8 TeV, s
µ-
µ+
→ H
[GeV]
µ
mµ
110 120 130 140 150 160
Data / SM
0.8 0.9 1 1.1 1.2
Events / GeV
2000 4000 6000 8000 10000
12000 Data
SM (stat) Single Top W+jets WW
t
t γ
WZ/ZZ/W Z+jets
×150) H [125 GeV] (
ATLAS Preliminary
Ldt = 20.7 fb-1
∫
= 8 TeV, s
µ-
µ+
→ H
[GeV]
µ
mµ
110 120 130 140 150 160
Data / SM
0.8 0.9 1 1.1 1.2
Events / GeV
10-1
1 10 102
103
104
105
Data SM (stat)
Single Top W+jets
WW tt
γ WZ/ZZ/W Z+jets
H [125 GeV]
ATLAS Preliminary
Ldt = 20.7 fb-1
∫
= 8 TeV, s
Central µ-
µ+
→ H
[GeV]
µ
mµ
110 120 130 140 150 160
Data / SM
0.8 0.9 1 1.1 1.2
Events / GeV
10-1
1 10 102
103
104
105
106 Data SM (stat)
Single Top W+jets
WW tt
γ WZ/ZZ/W Z+jets
H [125 GeV]
ATLAS Preliminary
Ldt = 20.7 fb-1
∫
= 8 TeV, s
Non-central µ-
µ+
→ H
[GeV]
µ
mµ
110 120 130 140 150 160
Data / SM
0.8 0.9 1 1.1 1.2
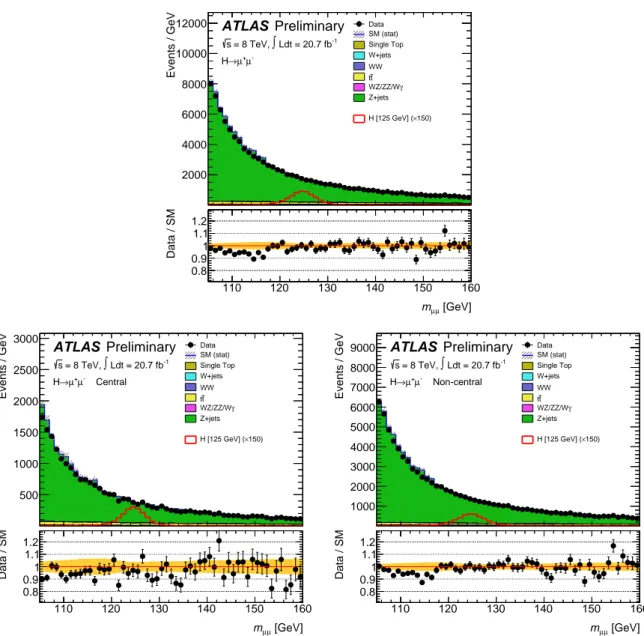
Figure 3: The distribution of the di-muon invariant mass m
µ+µ−for the selected events using logarithmic
scale (top left) and linear scale (top right). In the top right plot the signal for m
H= 125 GeV is added
on top of the expected MC background and scaled by a factor of 150. The two bottom plots show the
distributions of the di-muon invariant mass m
µ+µ−for the central (bottom left) and non-central (bottom
right) categories for the data signal region. The signal is shown for m
H= 125 GeV. The yellow band in
the ratio plots shows statistical uncertainty of the MC samples.
has been used to study effects from detector resolution for the muon momentum measurement. These studies have shown that this background pdf has su ffi cient flexibility to parametrize the reconstructed di- muon invariant mass spectrum in the 105 − 160 GeV range, within statistical uncertainty of the available background MC samples.
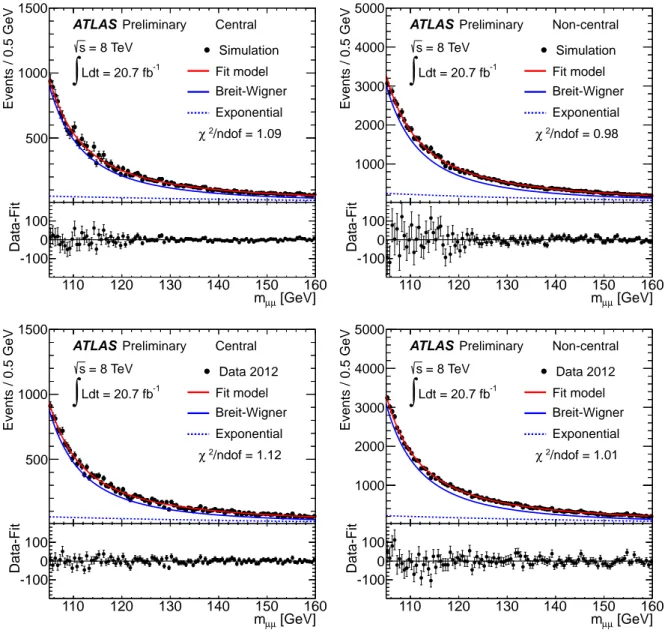
The background pdf is validated by fitting the di-muon invariant mass distributions for di ff erent background MC samples and the data control regions defined in Section 3; no statistically signficant fit biases are observed in any of the tests. The fits to the central and the non-central categories are performed separately and the results of these fits are shown in Fig. 4 for simulated data. Fits to the data signal regions are performed only after the selection of the background pdf; these fits using the background only pdf are shown in Fig. 4.
Di-muon mass [GeV]
110 120 130 140 150 160
Events / 0.5 GeV
500 1000 1500
ATLAS Preliminary = 8 TeV
s
Ldt = 20.7 fb-1
∫
Central Simulation Fit model Breit-Wigner Exponential /ndof = 1.09 χ2
[GeV]
µ
m
µ110 120 130 140 150 160
Data-Fit
-100 0
100
Di-muon mass [GeV]110 120 130 140 150 160
Events / 0.5 GeV
1000 2000 3000 4000 5000
ATLAS Preliminary = 8 TeV
s
Ldt = 20.7 fb-1
∫
Non-central Simulation Fit model Breit-Wigner Exponential /ndof = 0.98 χ2
[GeV]
µ
m
µ110 120 130 140 150 160
Data-Fit
-100 0 100
Di-muon mass [GeV]
110 120 130 140 150 160
Events / 0.5 GeV
500 1000 1500
ATLAS Preliminary = 8 TeV
s
Ldt = 20.7 fb-1
∫
Central Data 2012 Fit model Breit-Wigner Exponential /ndof = 1.12 χ2
[GeV]
µ
m
µ110 120 130 140 150 160
Data-Fit
-100 0
100
Di-muon mass [GeV]110 120 130 140 150 160
Events / 0.5 GeV
1000 2000 3000 4000 5000
ATLAS Preliminary = 8 TeV
s
Ldt = 20.7 fb-1
∫
Non-central Data 2012 Fit model Breit-Wigner Exponential /ndof = 1.01 χ2
[GeV]
µ
m
µ110 120 130 140 150 160
Data-Fit
-100 0 100
Figure 4: The background model fits to the di-muon mass distribution m
µ+µ−for the central (left) and non-central (right) signal categories. The top plots show the fits to the simulated data and the bottom plots show the fits to the data signal regions.
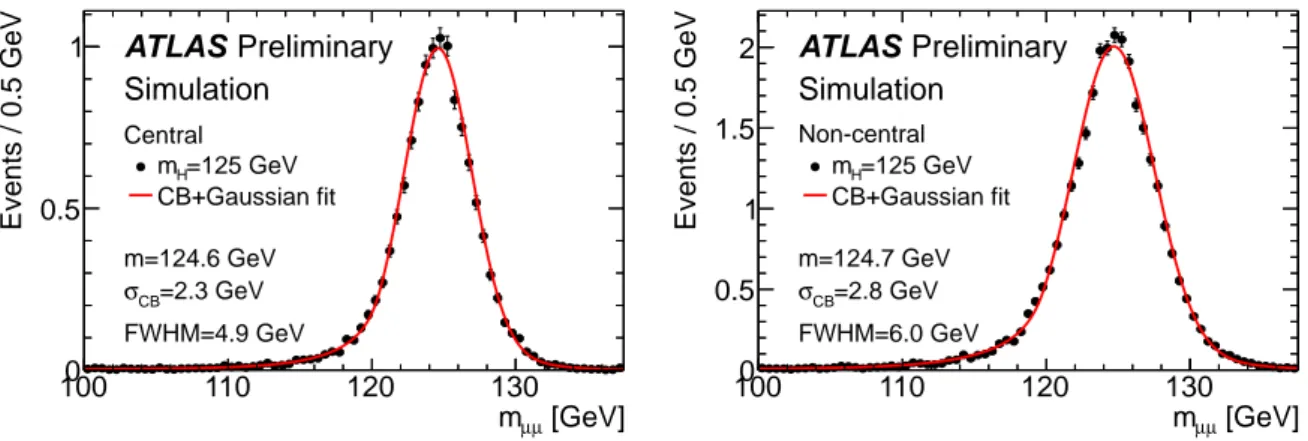
The signal pdf is obtained from simulated Higgs signal samples, where contributions from all four
Higgs production processes are added together, and is parametrized as a sum of the Crystal Ball (CB) and Gaussian (GS) pdfs:
P
S( x) = f
CB· CB( x, m, σ
CB, α, n) + (1 − f
CB) · GS (x, m, σ
G) , (2) where x represents the di-muon invariant mass and f
CBrepresents the fraction of the CB contribution when both pdfs are normalized to unity. The mass value m in the Gaussian distribution is fixed to the mass value in the Crystal Ball distribution. The parameters σ
CBand σ
Gdenote the widths of the Crystal Ball and Gaussian distributions, respectively. The fraction parameter f
CBand the n parameter of the Crystal Ball function are fixed in the fits with f
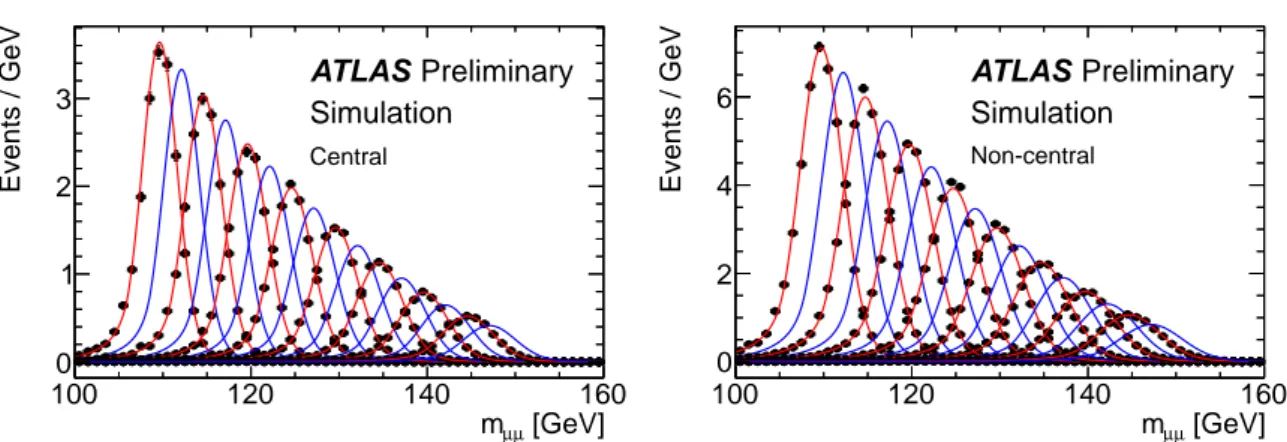
CB= 0.9. The remaining parameters are floating freely in the fits of the di-muon mass distribution for each generated Higgs mass point. This signal pdf is found to describe the expected signal di-muon mass distributions well in both categories as shown in Fig. 5. The free parameters are linearly interpolated in steps of 0.5 GeV between the generated signal samples. All signal pdf parameters are fixed in the mass scans of the data di-muon invariant mass distributions which are described in Section 6. Fig. 6 shows the results of the signal fits and signal interpolations for different Higgs masses.
In addition to the models described here, alternative parametrizations for signal and background models have been studied. The two alternative background models show very similar performance with simulated samples and data control regions. The present background model is selected based on simplic- ity of the parametrization and absence of statistically significant fit biases. The present signal model is selected because it provided the most stable fit results for all simulated Higgs mass points.
[GeV]
µ
m
µ100 110 120 130
Events / 0.5 GeV
0 0.5
1 ATLAS Preliminary Simulation
=125 GeV mH
CB+Gaussian fit Central
m=124.6 GeV
=2.3 GeV σCB
FWHM=4.9 GeV
[GeV]
µ
m
µ100 110 120 130
Events / 0.5 GeV
0 0.5 1 1.5
2 ATLAS Preliminary Simulation
=125 GeV mH
CB+Gaussian fit Non-central
m=124.7 GeV
=2.8 GeV σCB
FWHM=6.0 GeV
Figure 5: The signal model fit to the m
µ+µ−distribution for the central (left) and non-central (right) simulated signal events.
5 Systematic uncertainties
Theoretical sources of uncertainty for the number of the expected signal events include an uncertainty on
the Higgs boson production cross section (∼ 15% for ggF), an uncertainty on the H → µ
+µ
−branching
ratio (7.0% – 3.2% for 110 GeV < m
H< 150 GeV) and an uncertainty on the signal acceptance due to the
applied selection criteria. The signal acceptance uncertainty includes an uncertainty due to the chosen
PDF set, an uncertainty due to the renormalization and factorization scale cutoff (µ
F) and an uncertainty
due to initial- and final-state radiation (ISR/FSR). The uncertainty on the acceptance is defined as a
di ff erence between the nominal acceptance and the acceptance under variation in generator setting. The
scale uncertainty is estimated by simultaneously halving or doubling the µ
Fscale and is found to be less
[GeV]
µ
m
µ100 120 140 160
Events / GeV
0 1 2 3
ATLAS Preliminary Simulation
Central
[GeV]
µ
m
µ100 120 140 160
Events / GeV
0 2 4
6 ATLAS Preliminary
Simulation
Non-central
Figure 6: The invariant mass distribution (solid black circles) for the simulated Higgs samples. The signal model fits (red lines) are shown for the central (left) and non-central (right) categories. Superimposed are the expected signal shapes obtained from the signal interpolation (blue lines) between the simulated samples.
than 1%. The PDF uncertainty is evaluated according to the prescription of the PDF4LHC group [49].
Uncertainties due to ISR/FSR are determined by varying corresponding generator parameters; the largest deviation is found to be less than 3%. These systematic uncertainties are summarized in Tables 2 and 3.
Experimental sources of uncertainty for the number of the expected signal events are shown in Ta- ble 4. The uncertainty on the integrated luminosity is ±3.6%. It is derived following the same method- ology as that detailed in Ref. [50], from a preliminary calibration of the luminosity scale derived from beam-separation scans performed in April 2012.
gluon fusion vector boson fusion BR
m
H[GeV] σ[pb] uncertainty [%] σ[pb] uncertainty [%]
BR(H → µ
+µ
−) uncertainty [%]
up down up down up down
110 25.04 +15.3 -14.9 1.809 +2.7 -3.0 2.76 × 10
−4+7.0 -6.8
115 22.96 +15.0 -14.9 1.729 +2.7 -3.0 2.63 × 10
−4+6.7 -6.6
120 21.13 + 14.8 -14.8 1.649 + 2.8 -3.0 2.44 × 10
−4+ 6.4 -6.3 125 19.52 +14.7 -14.7 1.578 +2.8 -3.0 2.20 × 10
−4+6.0 -5.9
130 18.07 +14.6 -14.6 1.511 +2.8 -2.9 1.90 × 10
−4+5.5 -5.4
135 16.79 + 14.4 -14.7 1.448 + 2.8 -2.9 1.55 × 10
−4+ 5.0 -4.9 140 15.63 +14.3 -14.5 1.389 +2.7 -2.9 1.22 × 10
−4+3.7 -3.8
145 14.59 +14.1 -14.4 1.333 +2.8 -2.8 9.06 × 10
−5+3.4 -3.4
150 13.65 + 14.1 -14.4 1.280 + 2.8 -2.9 6.19 × 10
−5+ 3.1 -3.2
Table 2: SM Higgs production cross sections at 8 TeV and SM Higgs branching ratios BR(H → µ
+µ
−)
with associated uncertainty [6, 7].
Uncertainty Upward [%] Downward [%]
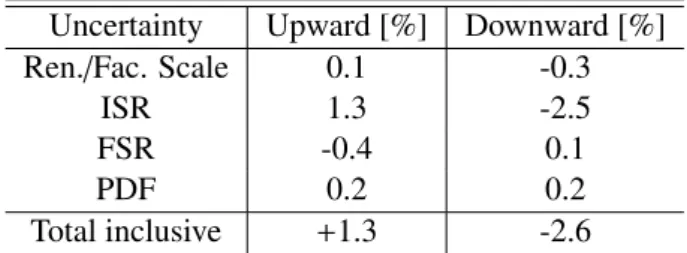
Ren./Fac. Scale 0.1 -0.3
ISR 1.3 -2.5
FSR -0.4 0.1
PDF 0.2 0.2
Total inclusive +1.3 -2.6
Table 3: Summary of signal acceptance uncertainties due to theoretical sources.
Source of Uncertainty Treatment in the analysis
Luminosity 3.6%
Muon Selection Efficiency 0.3-1% as a function of η and p
TMuon Momentum Scale and Resolution < 1%
Muon Trigger < 1%
Muon Track Isolation < 1%
Pile-up reweighting < 1%
Table 4: Summary of signal normalization uncertainties due to experimental sources.
6 Results and conclusions
A binned maximum likelihood fit of the observed di-muon invariant mass distribution is performed using the sum of signal and background pdfs. The fit is done simultaneously in the two signal categories, where both a background only hypothesis and signal plus background hypothesis are tested. The fit results for the background only hypothesis are shown in Fig. 4. No evidence for a narrow peak in the invariant di-muon spectrum is observed.
The statistical procedure used to interpret the data is summarized in Refs. [4, 51]. Upper limits are computed on the signal strength factor µ which acts as a scale factor on the total number of events predicted by the SM for the H → µ
+µ
−signal. The SM prediction is determined using MC simula- tion described in Section 2. This signal strength factor is defined such that µ = 0 corresponds to the background-only hypothesis and µ = 1 corresponds to the SM H → µ
+µ
−signal in addition to the background. The limits are determined using a modified frequentist CL
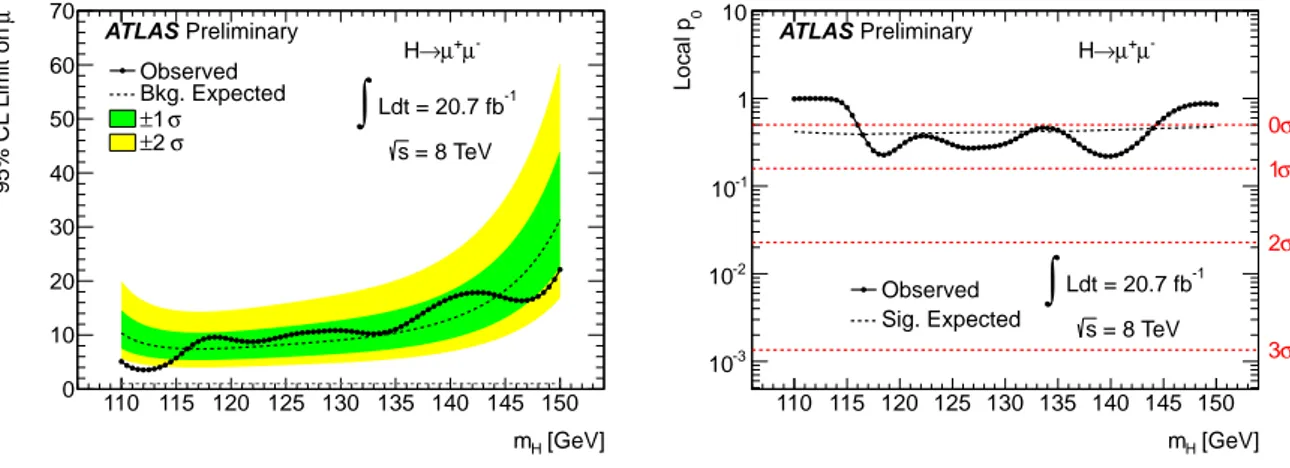
smethod based on a Poisson log-likelihood ratio statistical test [52, 53]. The observed and expected 95% CL limits on the H → µ
+µ
−signal strength and local probability p
0are shown in Fig. 7. The p
0value gives the probability that a background fluctuation is more signal-like than the observed data. Table 5 summarizes the expected and observed limits for different values of m
H. The observed (expected) upper limit varies between 3.5 (7.4) and 22.1 (31.3) times the SM prediction in the mass range 110–150 GeV.
To conclude, an inclusive search for the SM Higgs boson in H → µ
+µ
−decays in pp collisions at
√ s = 8 TeV at the LHC has been performed. The observed data is consistent with the expectation from
the SM backgrounds. No evidence of a signal is observed and upper limits are set on the Higgs boson
production as a function of the Higgs boson mass. The observed (expected) limit at the 95% CL for the
Higgs boson with a mass of 125 GeV is 9.8 (8.2) times the SM prediction.
[GeV]
mH
110 115 120 125 130 135 140 145 150
µ95% CL Limit on
0 10 20 30 40 50 60 70
Observed Bkg. Expected
σ
±1 σ
±2 s = 8 TeV Ldt = 20.7 fb-1
∫
ATLAS Preliminary -
µ µ+
→ H
[GeV]
mH
110 115 120 125 130 135 140 145 150
0Local p
10-3
10-2
10-1
1 10
Observed Sig. Expected
σ 0
σ 1
σ 2
σ 3 = 8 TeV s
Ldt = 20.7 fb-1
∫
ATLAS Preliminary -
µ µ+
→ H
Figure 7: Observed (solid) and expected (dashed) 95% CL upper limits on the H → µ
+µ
−signal strength as a function of m
Hover the mass range 110 GeV < m
H< 150 GeV (left). The green (color online) and yellow regions indicate the ±1σ and ±2σ uncertainty bands on the expected limit, respectively.
Observed (solid line) probability for the background-only scenario as a function of m
H(right). The dashed line shows the expectation for the SM H → µ
+µ
−signal plus the background for that value of m
H.
m
H[GeV] observed limits exp. median exp. + 2σ exp. + 1σ exp. − 1σ exp. − 2σ
110 5.1 10.4 20.0 14.6 7.5 5.6
115 5.7 7.5 14.5 10.6 5.4 4.0
120 9.2 7.6 14.6 10.7 5.5 4.1
125 9.8 8.2 15.9 11.6 5.9 4.4
130 10.8 9.1 17.5 12.8 6.5 4.9
135 11.0 10.4 20.1 14.6 7.5 5.6
140 16.8 12.9 25.0 18.2 9.3 6.9
145 16.9 18.3 35.3 25.7 13.2 9.8
150 22.1 31.3 60.6 44.2 22.6 16.8
Table 5: Observed and expected 95% CL upper limits on the H → µ
+µ
−signal strength together with
the upper and lower 1σ and 2σ uncertainties for di ff erent values of m
H.
References
[1] F. Englert and R. Brout, Broken symmetry and the mass of gauge vector mesons, Phys. Rev. Lett.
13 (1964) 321–323.
[2] P. W. Higgs, Broken symmetries and the masses of gauge bosons, Phys. Rev. Lett. 13 (1964) 508–509.
[3] G. Guralnik, C. Hagen, and T. Kibble, Global conservation laws and massless particles, Phys.
Rev. Lett. 13 (1964) 585–587.
[4] ATLAS Collaboration, Observation of a new particle in the search for the Standard Model Higgs boson with the ATLAS detector at the LHC, Phys. Lett. B716 (2012) 1–29, arXiv:1207.7214 [hep-ex].
[5] CMS Collaboration, Observation of a new boson at a mass of 125 GeV with the CMS experiment at the LHC, Phys. Lett. B716 (2012) 30–61, arXiv:1207.7235 [hep-ex].
[6] LHC Higgs Cross Section Working Group, S. Dittmaier, C. Mariotti, G. Passarino, and R. Tanaka (Eds.), Handbook of LHC Higgs Cross Sections: 1. Inclusive Observables, CERN-2011-002 (CERN, Geneva, 2011), arXiv:1101.0593 [hep-ph].
[7] LHC Higgs Cross Section Working Group, S. Dittmaier, C. Mariotti, G. Passarino, and R. Tanaka (Eds.), Handbook of LHC Higgs Cross Sections: 2. Di ff erential Distributions, CERN-2012-002 (CERN, Geneva, 2012), arXiv:1201.3084 [hep-ph].
[8] S. Dawson, D. Dicus, and C. Kao, Searching for the Higgs bosons of minimal supersymmetry with muon pairs and bottom quarks, Phys. Lett. B545 (2002) 132–138, arXiv:hep-ph/0208063 [hep-ph].
[9] A. Djouadi, The Anatomy of electro-weak symmetry breaking. II. The Higgs bosons in the minimal supersymmetric model, Phys. Rept. 459 (2008) 1–241, arXiv:hep-ph/0503173 [hep-ph].
[10] M. Gomez-Bock, M. Mondragon, M. Muhlleitner, M. Spira, and P. Zerwas, Concepts of Electroweak symmetry breaking and Higgs physics, arXiv:0712.2419 [hep-ph].
[11] A. Dery, A. Efrati, Y. Hochberg, and Y. Nir, What if BR(h → µµ)/BR(h → ττ) does not equal m
2µ/m
2τ?, arXiv:1302.3229 [hep-ph].
[12] ATLAS Collaboration, The ATLAS experiment at the CERN Large Hadron Collider, JINST 3 (2008) S08003.
[13] ATLAS Collaboration, Performance of the ATLAS trigger system in 2010, Eur. Phys. J. C72 (2012) 1849, arXiv:1110.1530 [hep-ex].
[14] S. Alioli, P. Nason, C. Oleari, and E. Re, NLO Higgs boson production via gluon fusion matched with shower in POWHEG, JHEP 0904 (2009) 002, arXiv:0812.0578 [hep-ph].
[15] P. Nason and C. Oleari, NLO Higgs boson production via vector-boson fusion matched with shower in POWHEG, JHEP 1002 (2010) 037, arXiv:0911.5299 [hep-ph].
[16] T. Sjostrand, S. Mrenna, and P. Z. Skands, A brief introduction to PYTHIA 8.1, Comput. Phys.
Commun. 178 (2008) 852–867, arXiv:0710.3820 [hep-ph].
[17] H. L. Lai, M. Guzzi, J. Huston, Z. Li, P. M. Nadolsy, et al., New parton distributions for collider physics, Phys. Rev. D82 (2010) 074024, arXiv:1007.2241 [hep-ph].
[18] ATLAS Collaboration, Summary of ATLAS Pythia 8 tunes, ATL-PHYS-PUB-2012-003 (2012).
[19] D. de Florian et al., Transverse-momentum resummation: Higgs boson production at the Tevatron and the LHC, JHEP 11 (2011) 064, arXiv:1109.2109 [hep-ph]. For Higgs boson p
T> m
H, the calculation is switched from NLO + NLL to NLO.
[20] P. M. Nadolsky et al., Implications of CTEQ global analysis for collider observables, Phys. Rev.
D78 (2008) 013004, arXiv:0802.0007 [hep-ph].
[21] A. Djouadi, M. Spira, and P. Zerwas, Production of Higgs bosons in proton colliders: QCD corrections, Phys. Lett. B264 (1991) 440–446.
[22] S. Dawson, Radiative corrections to Higgs boson production, Nucl. Phys. B359 (1991) 283–300.
[23] M. Spira, A. Djouadi, D. Graudenz, and P. Zerwas, Higgs boson production at the LHC, Nucl.
Phys. B453 (1995) 17–82, arXiv:hep-ph/9504378 [hep-ph].
[24] R. V. Harlander and W. B. Kilgore, Next-to-next-to-leading order Higgs production at hadron colliders, Phys. Rev. Lett. 88 (2002) 201801, arXiv:hep-ph/0201206 [hep-ph].
[25] C. Anastasiou and K. Melnikov, Higgs boson production at hadron colliders in NNLO QCD, Nucl.
Phys. B646 (2002) 220–256, arXiv:hep-ph/0207004 [hep-ph].
[26] V. Ravindran, J. Smith, and W. L. van Neerven, NNLO corrections to the total cross-section for Higgs boson production in hadron hadron collisions, Nucl. Phys. B665 (2003) 325–366, arXiv:hep-ph/0302135 [hep-ph].
[27] M. Ciccolini, A. Denner, and S. Dittmaier, Strong and electroweak corrections to the production of Higgs + 2-jets via weak interactions at the LHC, Phys. Rev. Lett. 99 (2007) 161803,
arXiv:0707.0381 [hep-ph].
[28] M. Ciccolini, A. Denner, and S. Dittmaier, Electroweak and QCD corrections to Higgs production via vector-boson fusion at the LHC, Phys. Rev. D77 (2008) 013002, arXiv:0710.4749
[hep-ph].
[29] K. Arnold, M. Bahr, G. Bozzi, F. Campanario, C. Englert, et al., VBFNLO: A Parton level Monte Carlo for processes with electroweak bosons, Comput.Phys.Commun. 180 (2009) 1661–1670, arXiv:0811.4559 [hep-ph].
[30] P. Bolzoni, F. Maltoni, S.-O. Moch, and M. Zaro, Higgs production via vector-boson fusion at NNLO in QCD, Phys. Rev. Lett. 105 (2010) 011801, arXiv:1003.4451 [hep-ph].
[31] T. Han and S. Willenbrock, QCD correction to the pp → W H and ZH total cross-sections, Phys.
Lett. B273 (1991) 167–172.
[32] O. Brein, A. Djouadi, and R. Harlander, NNLO QCD corrections to the Higgs-strahlung processes at hadron colliders, Phys. Lett. B579 (2004) 149–156, arXiv:hep-ph/0307206 [hep-ph].
[33] M. Ciccolini, S. Dittmaier, and M. Kr¨amer, Electroweak radiative corrections to associated W H
and ZH production at hadron colliders, Phys. Rev. D68 (2003) 073003, arXiv:hep-ph/0306234
[hep-ph].
[34] A. Djouadi, J. Kalinowski, and M. Spira, HDECAY: A Program for Higgs boson decays in the standard model and its supersymmetric extension, Comput. Phys. Commun. 108 (1998) 56–74, arXiv:hep-ph/9704448 [hep-ph].
[35] M. L. Mangano, M. Moretti, F. Piccinini, R. Pittau, and A. D. Polosa, ALPGEN, a generator for hard multiparton processes in hadronic collisions, JHEP 0307 (2003) 001,
arXiv:hep-ph/0206293 [hep-ph].
[36] G. Corcella, I. Knowles, G. Marchesini, S. Moretti, K. Odagiri, et al., HERWIG 6: An Event generator for hadron emission reactions with interfering gluons (including supersymmetric processes), JHEP 0101 (2001) 010, arXiv:hep-ph/0011363 [hep-ph].
[37] S. Frixione, P. Nason, and B. R. Webber, Matching NLO QCD and parton showers in heavy flavor production, JHEP 0308 (2003) 007, arXiv:hep-ph/0305252 [hep-ph].
[38] B. P. Kersevan and E. Richter-Was, The Monte Carlo event generator AcerMC version 2.0 with interfaces to PYTHIA 6.2 and HERWIG 6.5, arXiv:hep-ph/0405247 [hep-ph].
[39] T. Binoth, M. Ciccolini, N. Kauer, and M. Kramer, Gluon-induced W-boson pair production at the LHC, JHEP 0612 (2006) 046, arXiv:hep-ph/0611170 [hep-ph].
[40] T. Melia, P. Nason, R. Rontsch, and G. Zanderighi, W
+W
−, WZ and ZZ production in the POWHEG BOX, JHEP 1111 (2011) 078, arXiv:1107.5051 [hep-ph].
[41] J. Alwall et al., MadGraph / MadEvent v4: The New Web Generation, JHEP 0709 (2007) 028, arXiv:0706.2334 [hep-ph].
[42] J. Alwall, M. Herquet, F. Maltoni, O. Mattelaer, and T. Stelzer, MadGraph 5 : Going Beyond, JHEP 06 (2011) 128, arXiv:1106.0522 [hep-ph].
[43] ATLAS Collaboration, The ATLAS simulation infrastructure, Eur. Phys. J. C70 (2010) 823, arXiv:1005.4568 [physics.ins-det].
[44] GEANT4 Collaboration, S. Agostinelli et al., GEANT4: A Simulation toolkit, Nucl. Instrum.
Meth. A506 (2003) 250–303.
[45] ATLAS Collaboration, Muon reconstruction e ffi ciency in reprocessed 2010 LHC proton-proton collision data recorded with the ATLAS detector, ATLAS-CONF-2011-063 (2011).
[46] M. Cacciari, G. P. Salam, and G. Soyez, The anti-k
tjet clustering algorithm, JHEP 0804 (2008) 063, arXiv:0802.1189 [hep-ph].
[47] ATLAS Collaboration, Jet energy measurement with the ATLAS detector in proton-proton collisions at √
s = 7 TeV, arXiv:1112.6426 [hep-ex].
[48] The ALEPH, DELPHI, L3, OPAL, SLD Collaborations, the LEP Electroweak Working Group, the SLD Electroweak and Heavy Flavour Groups, Precision electroweak measurements on the Z resonance, Phys. Rept. 427 (2006) 257–454, arXiv:hep-ex/0509008 [hep-ex].
[49] M. Botje et al., The PDF4LHC working group interim recommendations, arXiv:1101.0538 [hep-ph].
[50] ATLAS Collaboration, Improved luminosity determination in pp collisions at √
s = 7 TeV using
the ATLAS detector at the LHC, arXiv:1302.4393 [hep-ex].
[51] ATLAS Collaboration, Combined search for the Standard Model Higgs boson in pp collisions at
√ s = 7 TeV with the ATLAS detector, Phys. Rev. D86 (2012) 032003, arXiv:1207.0319 [hep-ex].
[52] G. Cowan, K. Cranmer, E. Gross, and O. Vitells, Asymptotic formulae for likelihood-based tests of new physics, Eur. Phys. J. C71 (2011) 1554, arXiv:1007.1727 [physics.data-an].
[53] A. L. Read, Presentation of search results: The CL(s) technique, J. Phys. G28 (2002) 2693–2704.
A Auxiliary plots
Events / GeV
2000 4000 6000 8000 10000
12000 Data
SM (stat) Single Top W+jets WW
t t
γ WZ/ZZ/W Z+jets
×150) H [125 GeV] (
ATLAS Preliminary
Ldt = 20.7 fb-1
∫
= 8 TeV, s
µ-
µ+
→ H
[GeV]
µ
mµ
110 120 130 140 150 160
Data / SM
0.8 0.9 1 1.1 1.2
Events / GeV
500 1000 1500 2000 2500
3000 Data
SM (stat) Single Top W+jets WW
t t
γ WZ/ZZ/W Z+jets
×150) H [125 GeV] (
ATLAS Preliminary
Ldt = 20.7 fb-1
∫
= 8 TeV, s
Central µ-
µ+
→ H
[GeV]
µ
mµ
110 120 130 140 150 160
Data / SM
0.8 0.9 1 1.1 1.2
Events / GeV
1000 2000 3000 4000 5000 6000 7000 8000
9000 Data
SM (stat) Single Top W+jets WW
t t
γ WZ/ZZ/W Z+jets
×150) H [125 GeV] (
ATLAS Preliminary
Ldt = 20.7 fb-1
∫
= 8 TeV, s
Non-central µ-
µ+
→ H
[GeV]
µ
mµ
110 120 130 140 150 160
Data / SM
0.8 0.9 1 1.1 1.2
Figure 8: The distribution of the di-muon invariant mass m
µ+µ−for the selected events before the muon momentum categorization (top), for the central (bottom left) and non-central (bottom right) categories.
The signal is shown for m
H= 125 GeV and scaled by a factor of 150. The yellow band in the ratio plots
shows statistical uncertainty of the MC samples.
Di-muon mass [GeV]
110 120 130 140 150 160
Events / 0.5 GeV
500 1000 1500
ATLAS Preliminary = 8 TeV
s
Ldt = 20.7 fb-1
∫
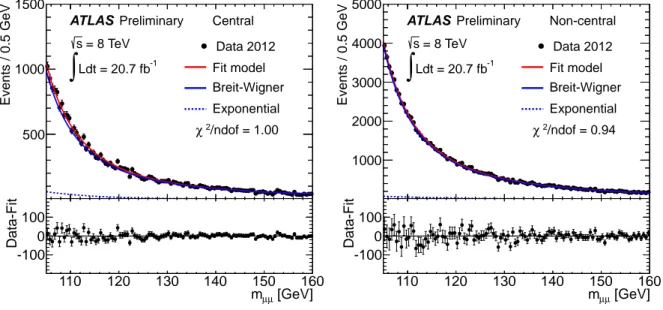
Central Data 2012 Fit model Breit-Wigner Exponential /ndof = 1.00 χ2
[GeV]
µ
m
µ110 120 130 140 150 160
Data-Fit
-100 0
100
Di-muon mass [GeV]110 120 130 140 150 160
Events / 0.5 GeV
1000 2000 3000 4000 5000
ATLAS Preliminary = 8 TeV
s
Ldt = 20.7 fb-1
∫
Non-central Data 2012 Fit model Breit-Wigner Exponential /ndof = 0.94 χ2
[GeV]
µ
m
µ110 120 130 140 150 160
Data-Fit
-100 0 100
Figure 9: The background model fits to the di-muon mass distribution m
µ+µ−for the central (left) and non-central (right) categories. The plots show the fits to the data in the low p
µ+µ−
T