ATLAS-CONF-2012-161 14November2012
ATLAS NOTE
ATLAS-CONF-2012-161
November 13, 2012
Search for the Standard Model Higgs boson produced in association with a vector boson and decaying to bottom quarks with the ATLAS detector
The ATLAS Collaboration
Abstract
This note presents an updated search with the ATLAS experiment for the Standard Model Higgs boson produced in association with a
Wor
Zboson and decaying to
bb¯ using 4.7 fb
−1of LHC proton-proton data at
√s =
7 TeV and 13.0 fb
−1at
√s =
8 TeV. The search is
performed using events containing zero, one or two electrons or muons targeting the three
decay modes
ZH → ν¯νbb¯ ,
W H → ℓνbb¯ and
ZH → ℓ+ℓ−bb. No significant excess is¯
observed. For
mH =125 GeV, the observed (expected) upper 95% confidence level limit
on the cross section times the branching ratio is found to be 1.8 (1.9) times the Standard
Model prediction. A Standard Model Higgs boson with
mH =110 GeV is excluded. As a
validation of the analysis procedure, the production of diboson pairs,
WZand
ZZ, with aZboson decaying to
bb, has been observed with a significance of 4.0 standard deviations and¯
a rate compatible with the Standard Model expectation.
1 Introduction
The search for the Standard Model (SM) [1–3] Higgs boson [4–7] is a central component of the physics program at the Large Hadron Collider (LHC). Recently, the observation of a boson decaying to a pair of photons or massive vector bosons has been reported by the ATLAS [8] and CMS [9] collaborations.
Determining the nature of this boson - whether it is indeed the Standard Model Higgs boson - is now one of the most important questions in particle physics.
An SM Higgs boson with a mass of about 125 GeV would be accessible in both bosonic and fermionic decay channels at the LHC. Observing the decay into fermions is vital in testing whether the new boson is compatible with a SM Higgs boson. In particular, the decay to b-quarks plays an important role since this is expected to be the dominant decay mode at this mass (BR(H
→b b) ¯
≈58% [10]). Therefore an observation in this channel is crucial in order to provide a direct constraint on the largest decay mode.
Experiments at the Tevatron have reported an excess of events in the search for the Higgs boson in the b b ¯ decay mode corresponding to about three standard deviations [11]. The CMS collaboration set expected and observed upper limits on the production cross section times branching ratio of 1.6 and 2.1 times the Standard Model expectation, respectively [9].
This note presents an update of the results reported in Ref. [12] on the search for the Higgs boson decaying to a pair of b-quarks with the Higgs boson produced in association with a W or Z boson, jointly denoted as V, in the decay channels ZH
→ ν¯νbb ¯ , W H
→ ℓνbb ¯ and ZH
→ ℓ+ℓ−b b ¯ , where
ℓrefers to either an electron or a muon. The cross section for associated production with W or Z bosons is lower than that of the dominant gluon fusion process by more than an order of magnitude; however, the signature provided by the leptonic decay modes of the associated vector boson is used to reduce backgrounds. The update reported in this note uses 4.7 fb
−1of data at
√s
=7 TeV delivered by the LHC in 2011 and 13.0 fb
−1of data at
√s
=8 TeV delivered by the LHC in 2012. The analysis is performed for events containing zero, one or two leptons, targeting the three Higgs boson decay channels mentioned above. The 0-lepton channel is most sensitive to ZH production, with a small although not insignificant contribution from W H production. The sensitivity of the 1-lepton channel is dominated by W H production with a small contribution from ZH, whereas the 2-lepton channel is only sensitive to ZH production. The channels are split in further categories, depending on the vector boson transverse momentum and the number of jets.
The analysis has been optimised with respect to Ref. [12] to improve the sensitivity. The most im- portant improvements are a re-optimisation of the topological selection criteria for all three channels, increased lepton identification efficiency, the addition of further categories with different signal to back- ground ratios, and improvements to the di-b-jet invariant mass resolution.
2 The ATLAS Detector
The ATLAS detector consists of four main subsystems. An inner tracking detector is immersed in the 2 T magnetic field produced by a superconducting solenoid. Charged particle position and momentum measurements are made by silicon detectors in the pseudorapidity
1range
|η| <2.5 and also by a straw tube tracker in the range
|η| <2.0. Calorimeters cover
|η|<4.9 with a variety of detector technologies.
The liquid-argon electromagnetic calorimeter is divided into barrel (
|η| <1.475) and endcap (1.375
<|η|<
3.2) sections. The hadronic calorimeters (using liquid argon or scintillating tiles as active materials)
1ATLAS uses a right-handed coordinate system with its origin at the nominal interaction point (IP) in the centre of the detector and thez-axis coinciding with the axis of the beam pipe. Thex-axis points from the IP to the centre of the LHC ring, and they-axis points upward. Cylindrical coordinates (r,φ) are used in the transverse plane,φbeing the azimuthal angle around the beam pipe. The pseudorapidity is defined in terms of the polar angleθasη=−ln tan(θ/2). For the purpose of the fiducial selection, this is calculated relative to the geometric centre of the detector; otherwise, it is relative to the reconstructed primary vertex of each event.
surround the electromagnetic calorimeter and cover
|η| <4.9. The muon spectrometer measures the deflection of muon tracks in the field of three large air-core toroidal magnets, each containing eight superconducting coils. It is instrumented with separate trigger chambers (covering
|η| <2.4) and high- precision tracking chambers (covering
|η|<2.7).
3 Data and Simulation Samples
This analysis uses the full 2011 dataset which consists of 4.7 fb
−1[13,14] of LHC data at
√s
=7 TeV and 13.0 fb
−1of 2012 LHC data at
√s
=8 TeV recorded by the ATLAS detector until September 2012. The data were collected using either lepton or missing transverse energy triggers with quality requirements on the beam conditions and detector performance. The integrated luminosity differs slightly between the different channels due to the availability of the triggers.
Monte Carlo (MC) event samples produced with the full ATLAS detector simulation [15] based on the GEANT4 [16] program, corrected for all known detector effects, are used to model the Higgs boson signal and most backgrounds. The high statistics samples used to model the vector boson plus jet backgrounds were produced using a simulation that includes a full simulation of the inner tracking and muon detectors but uses a fast simulation of the calorimeters based on detailed parametrisations of shower shapes of single particles [17]. The preliminary analysis described here uses a mixture of MC samples from different generators because a consistent set is not yet available.
In the analysis of the
√s
=8 TeV data the W H and ZH signal processes are modelled using P
ythia8 [18], interfaced using CTEQ6L1 [19] parton distribution functions (PDFs) with the AU2 tune [20] for the parton shower, hadronisation and multiple parton interactions. In the analysis of the
√s
=7 TeV data the P
ythia6 [21] event generator, interfaced with the MRST modified leading-order (LO*) [22] PDFs, with the AUET2B tune. The total production cross sections and associated uncertainties, computed at next-to-leading order (NLO), are taken from Ref. [23] with additional NLO corrections as a function of the transverse momentum of the vector boson, p
VT[24, 25]. The decay branching ratios are calculated with H
decay[10].
The t-channel single-top process is simulated with AcerMC, interfaced with P
ythia6, while the s- channel and Wt-channel of single-top quark production and the top-quark pair production are simulated with MC@NLO, relying on CT10 NLO PDFs [26], using H
erwig[27] for hadronisation.
The H
erwiggenerator is used to simulate the diboson (ZZ, WZ and WW ) samples relying on the CTEQ6L1 PDF.
The P
owheg[28–30] generator, in combination with MSTW 2008 NLO PDFs [31] for 2011 data and with CT10 NLO PDFs for 2012 data and interfaced with the P
ythia6 program for the parton shower and hadronisation, is used to simulate W
+b events. For W+c and W+ light jet production the A
lpgengenerator [32] interfaced with the H
erwigprogram [27] is used.
For 2012 data the Z
+b, Z
+c and Z+light jet events are produced with the S
herpagenerator [33], interfaced with CTEQ6L1 PDFs, while at
√s
=7 TeV a combination of A
lpgenand S
herpa, with the same settings, is used: Z
+b, Z
+c are produced with S
herpa, while Z+light jet is produced with A
lpgen. Simulated jets are categorised according to which hadrons lie within a cone of 0.4 around the jet axis.
Simulated V
+jet events are categorised according to the true flavour of the two reconstructed jets that areused to reconstruct the Higgs boson mass:
•
V
+≥1 b events, if at least one of the two jets is a real b-jet
•
V
+≥1 c events, if there is no real b-jet, but at least one of the two jets is a real c-jet
4 Object and Event Selection
Events are sub-divided into three channels depending on whether they contain zero, one or two leptons.
Events in the 0-lepton channel are selected using triggers based on missing transverse energy. Three similar but different trigger configurations were used in the 2012 dataset as the increasing event pile-up necessitated changes to the trigger. Pile-up is the overlapping of events from different proton-proton collisions occurring in the same bunch crossing. Events in the 1- and 2-lepton channels are primarily selected using single lepton triggers. Events selected for the 2-lepton analysis could also be recorded by di-muon or di-electron triggers.
Three categories of leptons are used in the analysis denoted in increasing order of purity as loose, medium and tight leptons. Loose leptons are selected with transverse energy E
T >10 GeV and pass impact parameter and quality requirements. If they are electrons they are required to have
|η| <2.47.
Three types of muons are included in the loose definition to maximise the acceptance: muons recon- structed in both the muon spectrometer and the inner detector cover
|η| <2.5, muons identified in the calorimeter and associated with an inner detector track are accepted for
|η|<0.1, where there is limited muon chamber coverage, and muons without a full inner detector track are accepted for 2.5
<|η| <2.7.
Finally, the sum of the transverse momentum of tracks within an
η−φcone of radius 0.2 centred on the lepton candidate track, but excluding the lepton track, is required to be less than 10% of the transverse momentum of the lepton.
Medium leptons meet the loose identification criteria and have E
T >25 GeV. Medium electrons are required to pass additional quality requirements based on the track quality and the shower shape. Tight leptons require the sum of the calorimetric energy deposits in a cone of radius of 0.3 around the lepton, excluding energy associated with the lepton candidate, to be less than 14% of the lepton energy. Tight electrons are required to pass more stringent quality requirements.
Jets are reconstructed from topological 3D clusters in the calorimeters using the anti
−k
talgorithm [34]
with a radius parameter R
=0.4 and are required to have p
T>20 GeV and
|η|<4.5. Jet energies are cal- ibrated using p
Tand
η-dependent correction factors based on simulation and validated with data [35]. Toremove jets from pile-up vertices, the sum of the p
Tof the tracks from the primary vertex and matched to the jet must be at least 75% (50%) of the total p
Tsummed for all tracks matched to the jet for the
√
s
=7 TeV(
√s
=8 TeV) analysis. The two jets used to reconstruct the Higgs boson candidate are required to satisfy
|η|<2.5. The leading jet is required to have p
1T>45 GeV.
Jets originating from b-quarks are identified using the MV1 b-tagging algorithm [36–39] which com- bines informations from different algorithms based on the use of track impact parameter significances or explicit reconstruction of b-hadron decay vertices. The two b-tagged jets used to reconstruct the Higgs boson candidate are selected with a cut on the output of this algorithm, which, when evaluated on simu- lated t t ¯ events, results in an approximate efficiency of 70% for b-jets and rejection factors of 5 and 150 for c and light jets, respectively.
Simulated jets are categorised according to which hadrons lie within a cone of 0.4 around the jet axis.
Jets with a b-hadron in the cone are denoted b-jets, non b-jets with a c hadron are labelled as c-jets, and non-b or c-jets with a
τas
τ-jets. All other jets are regarded as light jets.The statistical uncertainties on the simulated V
+c and V+light jet backgrounds are reduced by parametrising the response to b-tagging with the measured c- and light-tagging efficiencies and applying these efficiencies to the full V
+c and V+light jet samples to derive the distributions for events containing two tagged jets. A direct cut on the output of the MV1 algorithm is used for simulated events with real b-jets.
The missing transverse energy, E
Tmiss, is measured as the negative vector sum of the transverse mo-
menta associated with cluster energies in the calorimeters with
|η| <4.9. Corrections are applied to
energy associated with reconstructed objects: jets, electrons,
τ-leptons, photons and muons [40]. Atrack-based missing transverse momentum, p
missT, is calculated as the negative vector sum of the trans- verse momenta of tracks associated to the primary vertex.
The event selection is summarised in Tables 1 and 2. Events containing no loose leptons are assigned to the 0-lepton channel. Events containing one tight lepton and no additional loose leptons are considered to be in the 1-lepton channel. Events containing one medium lepton and one additional loose lepton of the same flavour but of opposite charge are studied in the 2-lepton channel. In the zero lepton channel multijet background is suppressed by imposing cuts on E
Tmiss, p
missT, the azimuthal angle between these (∆φ(E
missT ,p
missT)), the azimuthal angle between the E
missTand the nearest jet (Min[∆φ(E
Tmiss,jet)]) and the azimuthal angle between E
Tmissand the 2 b-tagged jets (∆φ(E
missT ,b b)). Cuts are made on ¯ E
Tmissand m
WTin the 1-lepton channel
2to select events consistent with the presence of a W boson. The top background is reduced in the 2-lepton channel by imposing cuts on the di-lepton invariant mass (m
ℓℓ) and E
missT. The transverse momentum of the vector boson, p
VT, is reconstructed as the E
Tmissin the 0-lepton channel, the vector sum of the lepton and the E
missTin the 1-lepton channel (p
WT) and the vector sum of the two leptons in the 2-lepton channel ( p
ZT).
Events containing zero leptons are split into six categories depending on whether they contain two or three jets and on the missing transverse energy: 120
<E
Tmiss ≤160 GeV, 160
<E
missT ≤200 GeV and E
missT >200 GeV. Events containing one or two leptons are divided into five categories of p
VT:
p
VT ≤50 GeV, 50
<p
VT ≤100 GeV, 100
<p
VT ≤150 GeV, 150
<p
VT ≤200 GeV and p
VT >200 GeV.
Topological cuts are applied to enhance the signal and reject backgrounds by exploiting differences in correlations between selected objects. These are outlined in Table 2. These cuts differ between the channels as the different background compositions mandate different selection strategies. The cuts were optimised with respect to Ref. [12] particularly for events with high vector boson transverse momentum.
Cuts on the angular separation between the two b-tagged jets,
∆R(b,b) ¯
= p∆φ(b,
b) ¯
2+ ∆η(b,b) ¯
2, depend on the category. The minimum cut reduces the background from V+jet production, while the maximum cut is tightened with increasing transverse momentum to profit from the increasing collimation between the jets. In the 1-lepton channel an upper cut on m
WTreduces the contamination from the t t ¯ background.
As the multijet background decreases rapidly with increasing p
WT, the lower m
WTcut is removed from events with p
WT >150 GeV, improving the signal acceptance. Vetoes on jets additional to the two b- tagged jets are applied in the 0-lepton and 1-lepton channels to reject background from t t ¯ decays.
Events in the signal region are required to contain exactly two b-tagged jets, which are used to reconstruct the mass of the Higgs boson candidate, m
bb¯. For 3-jet events the leading two jets are required to be b-tagged. The mass resolution is improved by adding the energy from muons within the jet to the total jet energy. A p
T-dependent correction is also applied to account for biases in the response caused by resolution effects of the jets from the Higgs boson decay. The average resolution after these corrections is about 16%.
5 Background Normalisation and Control Samples
The dominant backgrounds are top, W+jet and Z+jet production with Z+jet production the largest for the 2-lepton channel, top and W+jets for the 1-lepton channel and all three making an approximately equal contribution to the 0-lepton channel.
Backgrounds are estimated using a combination of techniques based on the comparison of data and
MC predictions. The shapes of most background distributions are taken from simulation with the nor-
malisation estimated using control regions in data. The two exceptions are the multijet background,
which is estimated using data, and the diboson background for which both the normalisation and shape
Table 1: The basic event selection of the three channels. The details of the cuts on the individual objects are summarised in the text.
Object 0-lepton 1-lepton 2-lepton
Leptons 0 loose leptons 1 tight lepton 1 medium lepton
+0 loose leptons
+1 loose lepton Jets
2 b-tags 2 b-tags 2 b-tags
p
1T >45 GeV p
1T>45 GeV p
1T>45 GeV p
2T >20 GeV p
2T>20 GeV p
2T>20 GeV
+≤1 extra jets
+0 extra jets - Missing E
TE
missT >120 GeV - E
missT <60 GeV
p
missT >30 GeV
∆φ(EmissT ,
p
missT)
< π/2Min[∆φ(E
missT ,jet)]
>1.5
∆φ(ETmiss,
b b) ¯
>2.8
Vector Boson - m
WT <120 GeV 83
<m
ℓℓ <99 GeV
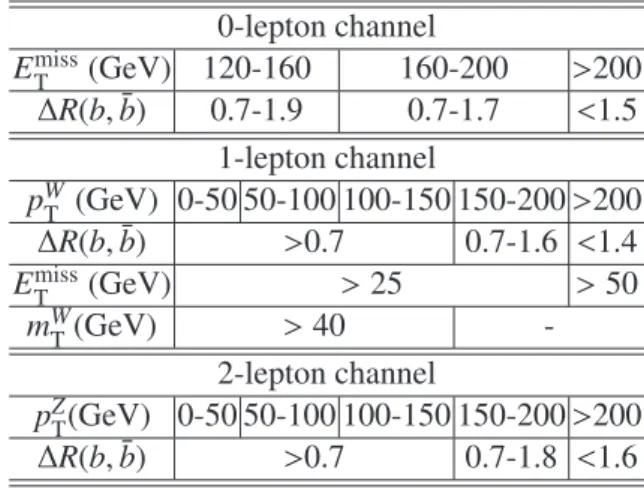
Table 2: Further topological cuts for the three channels in separate p
VTintervals.
0-lepton channel
E
missT(GeV) 120-160 160-200
>200∆R(b,
b) ¯ 0.7-1.9 0.7-1.7
<1.51-lepton channel
p
WT(GeV) 0-50 50-100 100-150 150-200
>200∆R(b,
b) ¯
>0.70.7-1.6
<1.4E
missT(GeV)
>25
>50
m
WT(GeV)
>40 -
2-lepton channel
p
ZT(GeV) 0-50 50-100 100-150 150-200
>200∆R(b,
b) ¯
>0.70.7-1.8
<1.6are taken from simulation.
Control regions are used to obtain the normalisation of the top background from data in the 1- and 2-lepton channels. In the 1-lepton channel the control region is defined by requiring an additional jet, and for the 2-lepton channel by inverting the requirements on m
ℓℓand E
Tmiss. Here top refers to the sum of t¯ t and single top production, which are treated together. The ratio of t¯ t to single top production is taken from the theory prediction and a systematic uncertainty is assigned to it.
Control distributions to study the V+ jets background are made by relaxing the requirement on 2 b-tagged jets. Events are categorised according to the number of b-tagged jets to define the signal and control regions. The 0-tag and 1-tag control regions contain exactly 0 or 1 b-tagged jets. The pre-tag control region is the sum of the 0-tag, 1-tag control regions and 2-tag signal region. Studying these distributions using the high statistics of the
√s
=8 TeV dataset permits more detailed studies of the modelling of several crucial backgrounds. These studies have revealed limitations in the modelling of certain distributions by the Monte Carlo simulation particularly in terms of the vector boson p
Tspectra.
For a number of backgrounds the vector boson p
Tdistribution of the data falls more rapidly than predicted by the Monte Carlo. Therefore corrections were obtained from the high statistics pre-tag regions for both W and Z+jets. The corrections are applied to the V
+jets of all flavours and checked in the 1 tagregion. The result of this correction is to soften the simulated p
VTdistribution so that that the fraction of events in the higher p
VTbins are reduced by
∼5-10%. A similar
∼15% correction is derived for the top background using both the 3-jet and an additional 4-jet control region from the 1-lepton analysis.
Systematic uncertainties for each correction are included.
The multijet background in each channel is estimated from data. It is found to be
∼1% in the 0-lepton channel using an ‘ABCD method’. In this method, the data are divided into 4 regions based on the variables Min[∆φ(E
missT ,jet)] and
∆φ(EmissT ,p
missT), such that three of the regions are dominated by background. The background in the signal region, defined by high Min[∆φ(E
Tmiss,jet)] and low
∆φ(EmissT ,
p
missT) is then evaluated under the assumption that the variables are not correlated. In the 1-lepton channel a multijet template is obtained by reversing the track isolation requirements on the lep- tons and subtracting W, Z and top contaminations. The template for the other background processes is taken from the Monte Carlo simulation. The normalisations of the two templates are allowed to float in a fit to the E
missTdistribution. The multijet background in the 1-lepton channel ranges from 23% to 2% of the total background rapidly decreasing with p
WT. A shape template for the multijet background in the 2-lepton channel is estimated from data by inverting the isolation and relaxing the lepton quality requirements. It is normalised to the signal selection using the m
ℓℓdistribution. The multijet background is found to be
<1% for the 2-lepton channel.
The normalisations of the V
+c and V+light backgrounds are determined by a maximum likelihood fit to control and signal regions in the 1- and 2-lepton channels. Events containing 0, 1 and 2 b-tagged jet and the top control regions of each channel are used. This flavour fit exploits the fact that the b-tagging has very different efficiencies for b, c and light jets, such that the flavour composition varies significantly with the number of b-tagged jets. The normalisations of Z+light, Z
+c, Z
+b, W+light, W
+c, W
+b and top are allowed to float in the fit.
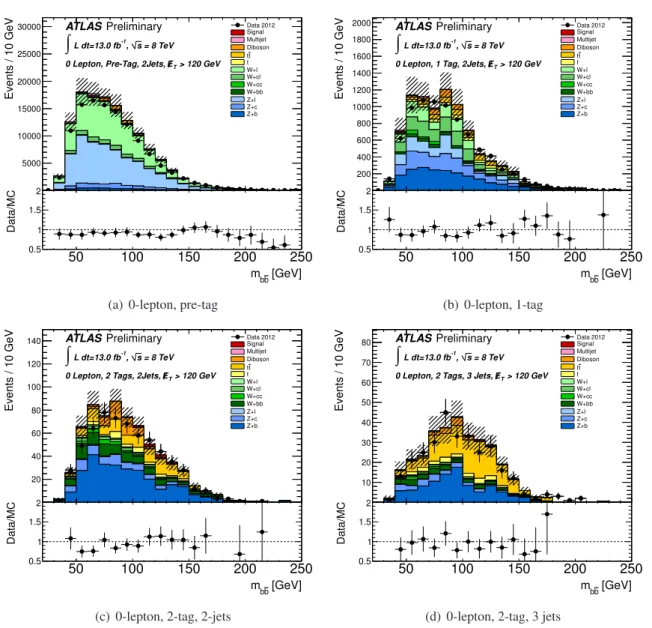
The distributions of the control and signal regions for each of the three channels after having been normalised by the result of the flavour fit are shown in Figs. 1, 2 and 3 for the
√s
=8 TeV data.
As the pre-tag and 0-tag samples are almost identical, only the former are shown. The 1-lepton case
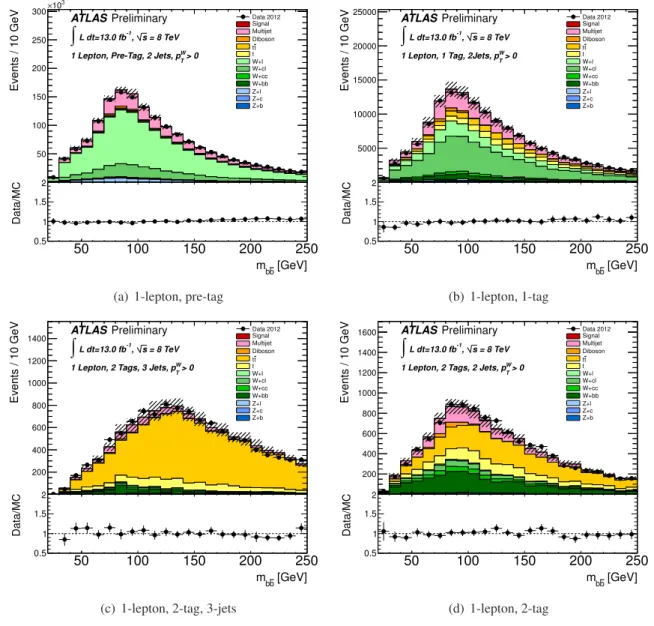
(Fig. 2) is the simplest to fit because the pre-tag region has a high purity of W+light, the 1-tag region
a high purity of W+c and the 2-tag region a high purity of W+b. This means that the constraint on the
W+light background comes mainly from the 0-tag region, the constraint on W+c from the 1-tag region
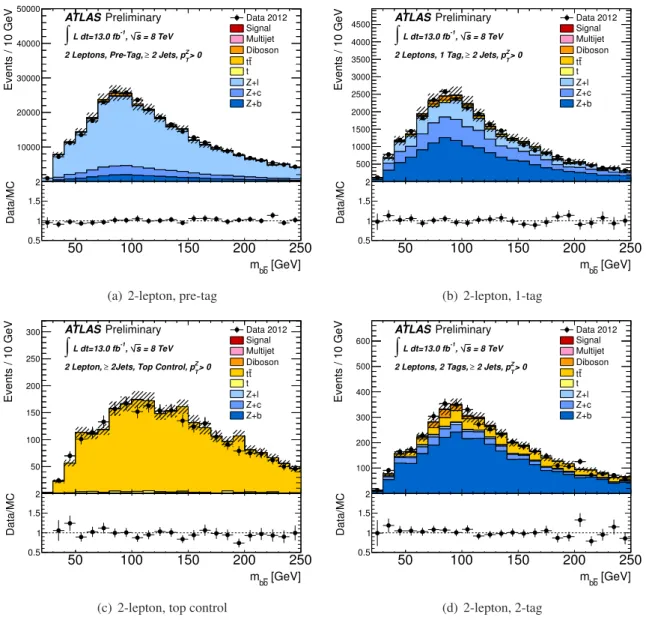
and the W+b from the signal region. The 2-lepton case is more complex because the relative fraction
of events with b-jets to events with c-jets is higher, such that there is already a significant contribution
approximately equal contribution in each control region from W and Z, with the same flavour mixes as the 1- and 2-lepton channels, respectively.
The flavour fit results for V
+c and V+ light jets are shown in Table 3 for both the
√s
=7 TeV and
√s
=8 TeV datasets as scale factors with respect to the predicted Monte Carlo cross sections.
Consistent scale factors are obtained for both datasets except for Z
+c production. This is expected, because the two samples were generated using different programs, ALPGEN and SHERPA. Some of the Z
+c events arise from charm production in the parton shower of Z+light parton events. However, in the ALPGEN samples used for the
√s
=7 TeV datasets, the limited statistics in the Z+light sample meant that the contribution from charm from the shower was suppressed to improve the statistical precision from the MC. As a result, the larger scale factor from the flavour fit compensates for this missing charm component. Due to a possible signal contamination and the impact of systematics on the scale factors, the results of this fit are not used to determine the final top and V
+b background normalisations. These normalisations are determined later in the fit used to calculate the limits as described in section 7.
The systematic uncertainties on the flavour fit scale factors are determined by propagating the changes from all systematic uncertainties as described in Section 6 into the flavour fit and obtaining the varia- tions in the scale factors. Using this method, the uncertainty on the Z
+c and W
+c backgrounds is conservatively determined to be 30%, which is included in the final fit.
Table 3: Rescaling factors obtained from a fit to the data for the V
+light and c-jet backgrounds. The error includes statistical and systematic uncertainties. The numbers for Z
+c are not expected to match between years; see text for details.
√
s
=7 TeV
√s
=8 TeV Z
+c 1.99
±0.51 0.71
±0.23 Z+ light 0.91
±0.12 0.98
±0.11 W
+c 1.04
±0.23 1.04
±0.24 W+ light 1.03
±0.08 1.01
±0.14
6 Systematic Uncertainties
6.1 Theoretical Uncertainties
The W H and ZH signals are normalised to the inclusive cross sections from Refs. [24, 41] evaluated at
√
s
=7 and 8 TeV. For both W H and ZH signals these are the next-to-next-to leading order (NNLO) QCD and NLO EW parton-level computations. The cross sections include inclusive electroweak cor- rection factors
∆EWthat are integrated over the entire V H phase space. The relative uncertainty on the Higgs boson branching ratio to b b ¯ increases with mass and is 3.3% for m
H =125 GeV. The uncertain- ties on the inclusive cross sections include uncertainties on the renormalisation/factorisation scales and PDF. These uncertainties are considered as correlated between W H and ZH production (the initial state is dominantly q q ¯ in both cases).
Fully differential NLO EW+QCD cross sections have been calculated, and the effects of the NLO EW corrections have a strong dependence on the vector boson p
T. The corrections for the differential EW cross sections,
δEW, are therefore applied as a function of p
VTon the LO W H and ZH signals generated with PYTHIA8, after rescaling to the inclusive NNLO QCD
+EW cross section.
Most backgrounds are normalised to data, but the analysis relies on Monte Carlo predictions in
certain key areas. Uncertainties for V+jets are estimated for the modelling of the shape of the m
bb¯and
p
VTdistributions. The sidebands of the m
bb¯distribution (m
bb¯ <80 GeV or m
bb¯ >140 GeV) for the
50 100 150 200 250
Events / 10 GeV
0 5000 10000 15000 20000 25000
30000 Data 2012
Signal Multijet Diboson
t t t W+l W+cl W+cc W+bb Z+l Z+c Z+b
ATLASPreliminary
= 8 TeV s
-1, L dt=13.0 fb
∫
> 120 GeV ET
0 Lepton, Pre-Tag, 2Jets,
[GeV]
b
mb
50 100 150 200 250
Data/MC
0.5 1 1.5 2
(a) 0-lepton, pre-tag
50 100 150 200 250
Events / 10 GeV
0 200 400 600 800 1000 1200 1400 1600 1800
2000 Data 2012
Signal Multijet Diboson
t t t W+l W+cl W+cc W+bb Z+l Z+c Z+b
ATLASPreliminary
= 8 TeV s
-1, L dt=13.0 fb
∫
> 120 GeV ET
0 Lepton, 1 Tag, 2Jets,
[GeV]
b
mb
50 100 150 200 250
Data/MC
0.5 1 1.5 2
(b) 0-lepton, 1-tag
50 100 150 200 250
Events / 10 GeV
0 20 40 60 80 100 120
140 Data 2012Signal
Multijet Diboson
t t t W+l W+cl W+cc W+bb Z+l Z+c Z+b
ATLASPreliminary
= 8 TeV s
-1, L dt=13.0 fb
∫
> 120 GeV ET
0 Lepton, 2 Tags, 2Jets,
[GeV]
b
mb
50 100 150 200 250
Data/MC
0.5 1 1.5 2
(c) 0-lepton, 2-tag, 2-jets
50 100 150 200 250
Events / 10 GeV
0 10 20 30 40 50 60 70
80 Data 2012Signal
Multijet Diboson
t t t W+l W+cl W+cc W+bb Z+l Z+c Z+b
ATLASPreliminary
= 8 TeV s
-1, L dt=13.0 fb
∫
> 120 GeV ET
0 Lepton, 2 Tags, 3 Jets,
[GeV]
b
mb
50 100 150 200 250
Data/MC
0.5 1 1.5 2
(d) 0-lepton, 2-tag, 3 jets
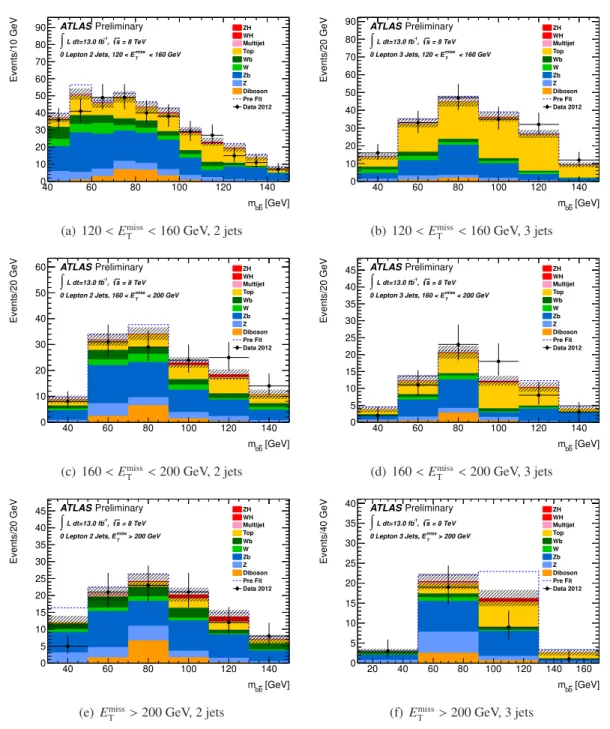
Figure 1: The m
bb¯distributions for the signal and control regions (bottom and top plots respectively) for
the 0-lepton selection integrated over the bins of p
VT. The error bands indicate the size of the combined
statistical and systematic uncertainty before the profile likelihood fit. See text for details of the definition
of the control regions.
50 100 150 200 250
Events / 10 GeV
0 50 100 150 200 250 300
103
×
Data 2012 Signal Multijet Diboson
t t t W+l W+cl W+cc W+bb Z+l Z+c Z+b
ATLASPreliminary
= 8 TeV s
-1, L dt=13.0 fb
∫
> 0
W
1 Lepton, Pre-Tag, 2 Jets, pT
[GeV]
b
mb
50 100 150 200 250
Data/MC
0.5 1 1.5 2
(a) 1-lepton, pre-tag
50 100 150 200 250
Events / 10 GeV
0 5000 10000 15000 20000 25000
Data 2012 Signal Multijet Diboson
t t t W+l W+cl W+cc W+bb Z+l Z+c Z+b
ATLASPreliminary
= 8 TeV s
-1, L dt=13.0 fb
∫
> 0
W
1 Lepton, 1 Tag, 2Jets, pT
[GeV]
b
mb
50 100 150 200 250
Data/MC
0.5 1 1.5 2
(b) 1-lepton, 1-tag
50 100 150 200 250
Events / 10 GeV
0 200 400 600 800 1000 1200 1400
Data 2012 Signal Multijet Diboson
t t t W+l W+cl W+cc W+bb Z+l Z+c Z+b
ATLASPreliminary
= 8 TeV s
-1, L dt=13.0 fb
∫
> 0
W
1 Lepton, 2 Tags, 3 Jets, pT
[GeV]
b
mb
50 100 150 200 250
Data/MC
0.5 1 1.5 2
(c) 1-lepton, 2-tag, 3-jets
50 100 150 200 250
Events / 10 GeV
0 200 400 600 800 1000 1200 1400
1600 Data 2012Signal
Multijet Diboson
t t t W+l W+cl W+cc W+bb Z+l Z+c Z+b
ATLASPreliminary
= 8 TeV s
-1, L dt=13.0 fb
∫
> 0
W
1 Lepton, 2 Tags, 2 Jets, pT
[GeV]
b
mb
50 100 150 200 250
Data/MC
0.5 1 1.5 2
(d) 1-lepton, 2-tag
Figure 2: The m
bb¯distributions for the signal (bottom right) and control (top and bottom left) regions for
the 1-lepton selection integrated over the bins of p
VT. The error bands indicate the size of the combined
statistical and systematic uncertainty before the profile likelihood fit. See text for details of the definition
of the control regions.
50 100 150 200 250
Events / 10 GeV
0 10000 20000 30000 40000 50000
Data 2012 Signal Multijet Diboson
t t t Z+l Z+c Z+b
ATLASPreliminary
= 8 TeV s
-1, L dt=13.0 fb
∫
> 0
Z
2 Jets, pT
≥ 2 Leptons, Pre-Tag,
[GeV]
b
mb
50 100 150 200 250
Data/MC
0.5 1 1.5 2
(a) 2-lepton, pre-tag
50 100 150 200 250
Events / 10 GeV
0 500 1000 1500 2000 2500 3000 3500 4000
4500 Data 2012
Signal Multijet Diboson
t t t Z+l Z+c Z+b
ATLASPreliminary
= 8 TeV s
-1, L dt=13.0 fb
∫
> 0
Z
2 Jets, pT
≥ 2 Leptons, 1 Tag,
[GeV]
b
mb
50 100 150 200 250
Data/MC
0.5 1 1.5 2
(b) 2-lepton, 1-tag
50 100 150 200 250
Events / 10 GeV
0 50 100 150 200 250
300 Data 2012
Signal Multijet Diboson
t t t Z+l Z+c Z+b
ATLASPreliminary
= 8 TeV s
-1, L dt=13.0 fb
∫
> 0
Z
2Jets, Top Control, pT
≥ 2 Lepton,
[GeV]
b
mb
50 100 150 200 250
Data/MC
0.5 1 1.5 2
(c) 2-lepton, top control
50 100 150 200 250
Events / 10 GeV
0 100 200 300 400 500 600
Data 2012 Signal Multijet Diboson
t t t Z+l Z+c Z+b
ATLASPreliminary
= 8 TeV s
-1, L dt=13.0 fb
∫
> 0
Z
2 Jets, pT
≥ 2 Leptons, 2 Tags,
[GeV]
b
mb
50 100 150 200 250
Data/MC
0.5 1 1.5 2
(d) 2-lepton, 2-tag
Figure 3: The m
bb¯distributions for the signal (bottom right) and control (top and bottom left) regions for
the 2-lepton selection integrated over the bins of p
VT. The error bands indicate the size of the combined
statistical and systematic uncertainty before the profile likelihood fit. See text for details of the definition
of the control regions.
2-lepton category are mostly Z
+b events, therefore these uncertainties are estimated by comparing data to simulation in those sidebands. There is no comparably pure control region for W
+b, therefore those modelling uncertainties are estimated from comparisons between different Monte Carlo generators. The uncertainty on the shape of the m
bb¯distribution is parameterised as a linear distortion, correlated between the different p
VTbins. The p
VTuncertainty is treated as five uncorrelated uncertainties in the range between 5 and 10%, one for each p
VTbin. Both are treated separately for W and Z bosons, but correlated between the different lepton channels. The systematic uncertainty applied for the top p
VTcorrection is again applied in five bins with no correlation between the bins.
Uncertainties on the relative composition of the backgrounds are applied. These are an uncertainty of 15% on the ratio of t t ¯ to single top, 30% on the W
+c normalisation and 30% on the Z
+c normalisation.
There is a theoretical uncertainty of 11% on the diboson cross section.
6.2 Experimental Uncertainties
Experimental uncertainties affect both the expected signal and background yields and are associated with the reconstruction efficiency and the energy or momentum scale and resolution of the reconstructed objects in the event. The most significant contributions are from the b-tagging efficiencies and the jet energy scale.
The b-tagging performance for b, c and light jets is measured from data [36–38]. These calibrations are applied as MC-to-data scale factors, which depend on the kinematics of the jet. The uncertainties on the scale factors are the statistical and systematic uncertainties of the calibrations. The uncertainties for b-jets are applied as six uncorrelated components for six jet p
Tbins. The uncertainties on c- and light- jets, which the analysis is less sensitive to, are each accounted for by a single nuisance parameter in the fit used to derive the final limits. The addition of t¯ t events for calibration [39] contributes significantly to the accuracy of the measurement.
The jet energy scale uncertainty is separated into eight uncorrelated components. The uncertainty on the jet energy resolution is also applied. In addition to the propagation of the uncertainties on the individual physics objects to the missing transverse energy, uncertainties on the scale and resolution of the so-called soft components, corresponding to energy clusters that have not been associated with other reconstructed physics objects, are applied. A 5% uncertainty on data/MC differences in the modelling of the efficiency of the missing energy trigger is applied for the 0-lepton category.
The normalisation uncertainty on the multijet background is estimated to be 30% for the 1-lepton channel and 100% for the 0- and 2-lepton channels. The uncertainty on the integrated luminosity of 3.9% (3.6%) for
√s
=7 TeV (
√s
=8 TeV) is applied to the signal and those backgrounds directly estimated from simulation. A 3% uncertainty on MC modelling of the total number of interactions per bunch crossing is applied to the MC samples.
The impact from uncertainties on the leptons is small, but uncertainties on the trigger and reconstruc- tion efficiency, energy scale and resolution were studied.
The most important systematic uncertainties are summarised in Table 4 and 5 which shows their impact on the total background and signal for respectively for the
√s
=8 TeV dataset. Similar results are obtained for the
√s
=7 TeV data.
7 Results
The selection cuts and data analysis procedure were determined without looking at the data in the signal regions. The expected number of signal (m
H =125 GeV) and background events passing the full event selection after the profile likelihood fit are shown for each lepton category, and in bins of p
VT, in Table 6.
Also included in the table is the total expected background with its uncertainty. The uncertainty is
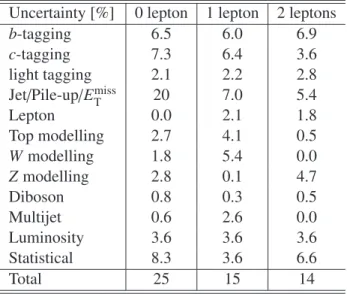
Table 4: A summary of the size of the components of the systematic uncertainty on the total estimated background after all cuts for the three channels of the
√s
=8 TeV analysis. The uncertainties are shown as a percentage and grouped together into broad categories and are averaged over all p
VTbins in each category. The total error is worked out by adding the individual components together in quadrature in each p
VTbin and then averaging.
Uncertainty [%] 0 lepton 1 lepton 2 leptons
b-tagging 6.5 6.0 6.9
c-tagging 7.3 6.4 3.6
light tagging 2.1 2.2 2.8
Jet/Pile-up/E
missT20 7.0 5.4
Lepton 0.0 2.1 1.8
Top modelling 2.7 4.1 0.5
W modelling 1.8 5.4 0.0
Z modelling 2.8 0.1 4.7
Diboson 0.8 0.3 0.5
Multijet 0.6 2.6 0.0
Luminosity 3.6 3.6 3.6
Statistical 8.3 3.6 6.6
Total 25 15 14
Table 5: A summary of the size of the components of the systematic uncertainty on the signal with m
H =125 GeV for the three channels of the
√s
=8 TeV analysis. The dominant signal is shown for the 1 lepton and 2 lepton channels, while for the 0 lepton channel both ZH and W H signals are listed.
The uncertainties are shown as a percentage, grouped together into broad categories and are calculated by summing in quadrature within each p
VTbin and then averaging over all p
VTbins in a channel.
Uncertainty [%] 0 lepton 1 lepton 2 leptons
ZH W H W H ZH
b-tagging 8.9 9.0 8.8 8.6
Jet/Pile-up/E
missT19 25 6.7 4.2
Lepton 0.0 0.0 2.1 1.8
H
→bb BR 3.3 3.3 3.3 3.3
V H p
T-dependence 5.3 8.1 7.6 5.0
V H theory PDF 3.5 3.5 3.5 3.5
V H theory scale 1.6 0.4 0.4 1.6
Statistical 4.9 18 4.1 2.6
Luminosity 3.6 3.6 3.6 3.6
Total 24 34 16 13
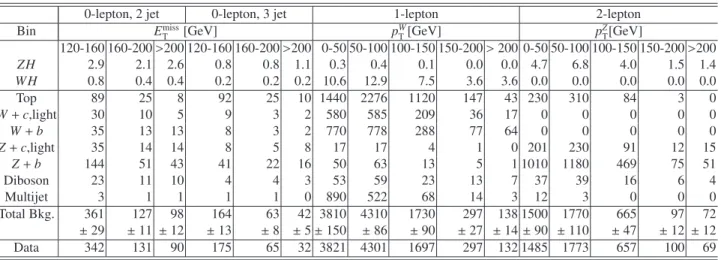
Table 6: The expected numbers of signal and background events for the
√s
=8 TeV data after the profile likelihood fit, as well as the observed number of events, are shown. The expected number of signal events are shown for W H and ZH production separately for m
H =125 GeV. The quoted error on the total background represents one standard deviation of the profiled nuisance parameters incorporating both the systematic and statistical uncertainties.
0-lepton, 2 jet 0-lepton, 3 jet 1-lepton 2-lepton
Bin ETmiss[GeV] pWT[GeV] pZT[GeV]
120-160 160-200>200 120-160 160-200>200 0-50 50-100 100-150 150-200>200 0-50 50-100 100-150 150-200>200 ZH 2.9 2.1 2.6 0.8 0.8 1.1 0.3 0.4 0.1 0.0 0.0 4.7 6.8 4.0 1.5 1.4
W H 0.8 0.4 0.4 0.2 0.2 0.2 10.6 12.9 7.5 3.6 3.6 0.0 0.0 0.0 0.0 0.0
Top 89 25 8 92 25 10 1440 2276 1120 147 43 230 310 84 3 0
W+c,light 30 10 5 9 3 2 580 585 209 36 17 0 0 0 0 0
W+b 35 13 13 8 3 2 770 778 288 77 64 0 0 0 0 0
Z+c,light 35 14 14 8 5 8 17 17 4 1 0 201 230 91 12 15
Z+b 144 51 43 41 22 16 50 63 13 5 1 1010 1180 469 75 51
Diboson 23 11 10 4 4 3 53 59 23 13 7 37 39 16 6 4
Multijet 3 1 1 1 1 0 890 522 68 14 3 12 3 0 0 0
Total Bkg. 361 127 98 164 63 42 3810 4310 1730 297 138 1500 1770 665 97 72
±29 ±11 ±12 ±13 ±8 ±5±150 ±86 ±90 ±27 ±14±90 ±110 ±47 ±12 ±12
Data 342 131 90 175 65 32 3821 4301 1697 297 132 1485 1773 657 100 69
reduced compared with table 4 due to the normalisation procedure described below. The numbers of observed events in data are shown in the last row. After all selection criteria, the dominant backgrounds are Z
+b production for the 2-lepton category, W
+b and top production for the 1-lepton category, and all three contribute significantly for the 0-lepton category. The signal to background ratio improves in each channel with increasing p
VT. The total expected background and its uncertainty is included. The uncertainty is reduced compared with Table 4 due to the normalisation procedure described below.
The statistical analysis of the data employs a binned likelihood function
L(µ, θ) constructed as the product of Poisson probability terms for each category. The categories that enter the profile likelihood fit are the 16 individual 2 b-tag signal regions and the top control regions for the 1- and 2-lepton channels.
A signal strength parameter,
µ, multiplies the expected Standard Model Higgs boson production crosssection in each bin. The dependence of the signal and background predictions on the systematic uncer- tainties is described by nuisance parameters,
θ, which are parametrised by Gaussian or log-normal priors.The expected number of signal and background events in each bin are functions of
θ. The parametrisa-tion is chosen such that the rates in each category are log-normally distributed for a normally distributed
θ. The test statisticq
µis then constructed according to the profile likelihood: q
µ=2ln(
L(µ,
θˆ
µ)/
L( ˆ
µ,θ)),ˆ where ˆ
µand ˆ
θare the parameters that maximise the likelihood (with the constraint 0
≤ µˆ
≤ µ), and ˆθµare the nuisance parameter values that maximise the likelihood for a given
µ. This test statistic is usedto measure the compatibility of the background only model with the observed data and for exclusion intervals derived with the CL
smethod [42, 43]. The normalisation of the top, Z
+b and W
+b back- grounds are allowed to float freely in the fit. The other backgrounds are constrained within their errors as described in section 5. The resulting scale factors from the fit are shown in table 7 for both
√s
=7 TeV and
√s
=8 TeV.
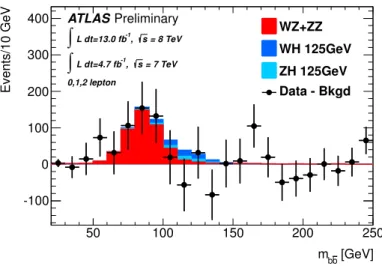
Diboson production with a Z boson decaying to a pair of b-quarks and produced with either a W
or Z boson has a very similar signature but with lower p
ZTand m
bb¯peaking at lower values and with
a cross section
∼5 times larger than Higgs boson associated production. Therefore a separate fit was
made as a validation of the analysis procedure. This fit is performed as described above, except that
Table 7: Rescaling factors obtained from the fit to the data for the V
+b and top backgrounds. The error includes statistical and systematic uncertainties.
√
s
=7 TeV
√s
=8 TeV Top 1.10
±0.14 1.29
±0.16 Z
+b 1.22
±0.20 1.11
±0.15 W
+b 1.19
±0.23 0.79
±0.20
there is no separation in p
VTbins. In the fit the normalisation of the diboson contributions is allowed to vary with a multiplicative scale
µDwith respect to the Standard Model expectation. A Standard Model Higgs boson with m
H =125 GeV is included as a background. Figure 4 shows the distribution in data after subtracting all backgrounds except the diboson contributions. The backgrounds are evaluated after the results of the profile likelihood fit. An excess in the data compared to the background is observed and this excess is located at the expected mass for the vector boson signal. After combining the three channels and including all systematic uncertainties we measure
µD =1.09
±0.20(stat.)
±0.22(syst.).
This corresponds to a significance of 4.0
σand agrees with the Standard Model expectation of
µD=1.
The profile likelihood fit with the Higgs boson signal strength floating is then performed with the diboson contribution fixed to its Standard Model expectation, constrained within an uncertainty of 11%, as discussed above.
[GeV]
b
mb
50 100 150 200 250
Events/10 GeV
-100 0 100 200 300
400 WZ+ZZ
WH 125GeV ZH 125GeV Data - Bkgd ATLASPreliminary
= 8 TeV s
-1, L dt=13.0 fb
∫
= 7 TeV s
-1, L dt=4.7 fb
∫
0,1,2 lepton
Figure 4: The m
bb¯distribution in data after subtraction of all backgrounds except diboson processes in- cluding SM Higgs boson from W H and ZH associated production. The MC backgrounds are normalised according to the results of the global fit. Only statistical uncertainties are shown.
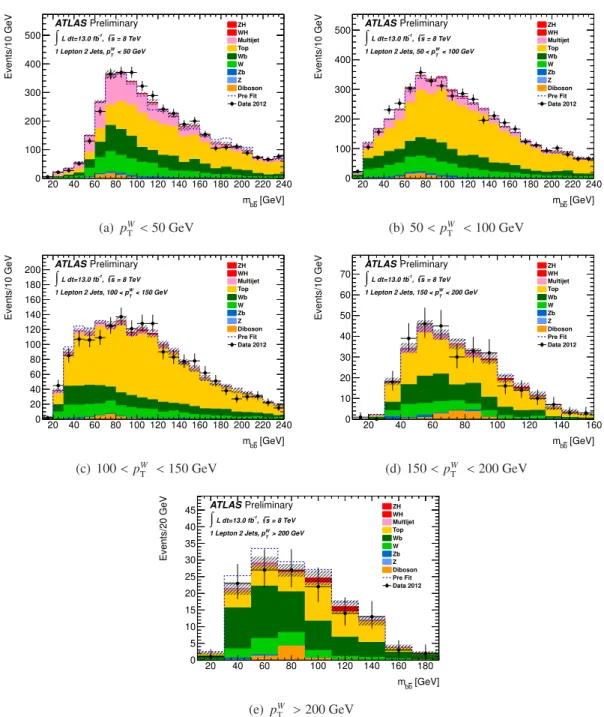
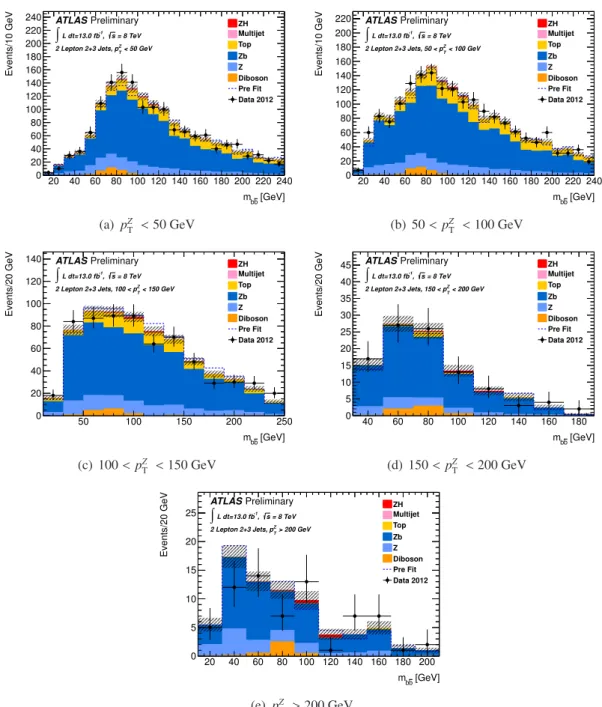
Figures 5, 6 and 7 show the m
bb¯distribution in
√s
=8 TeV data after all selection criteria have been applied for each category. The dashed bands indicate the size of the combination of the statistical and systematic uncertainties on the background processes after the likelihood fit. Agreement between data and background is observed within the systematic uncertainties. The corresponding distributions for
√