A TLAS-CONF-2018-039 25 July 2018
ATLAS CONF Note
ATLAS-CONF-2018-039
25th July 2018
Search for Dark Matter Produced in Association with a Higgs Boson decaying to b b ¯ at √
s = 13 TeV with the ATLAS Detector using 79.8 fb − 1 of
proton-proton collision data
The ATLAS Collaboration
A search for dark matter produced in association with a Higgs boson decaying to b -quarks is performed using pp collisions at a centre-of-mass energy of
√ s = 13 TeV. The dataset has an integrated luminosity of 79.8 fb − 1 and was recorded with the ATLAS detector at the Large Hadron Collider. Selected collision events comprise large missing transverse momentum and either two b -tagged small radius jets or a single large radius jet containing two b -tagged subjets. The reconstruction of these subjets is based on a jet algorithm that uses inner detector tracks as inputs and a radius parameter that decreases as the subjet transverse momentum increases. The observed data are in agreement with the Standard Model predictions. The results are interpreted in the context of a simplified model ( Z 0 -2HDM) which describes the interaction of dark matter and Standard Model particles via new heavy mediator particles.
Masses of the Z 0 are excluded up to 2.8 TeV depending on the choices for other model parameters.
© 2018 CERN for the benefit of the ATLAS Collaboration.
1 Introduction
The particle nature of the dominant matter component in the Universe, called Dark Matter (DM) [1], remains one of the biggest open questions in present-day physics. A compelling hypothesis that accom- modates the observed relic abundance of DM [2, 3] is the existence of an electrically neutral, stable particle χ having weak interactions with the Standard Model (SM) particles in addition to gravitational interactions, and a mass in the range of a few GeV up to several TeV. Such an extension of the SM could result in detectable signatures at the scale of electroweak symmetry breaking [4], and many models predict observable rates for the production of such particles at the Large Hadron Collider (LHC) [5].
The typical signature targeted by collider searches is pair production of DM leading to missing transverse momentum (with magnitude E miss
T ), observed due to the recoil of the DM particles against a visible object, denoted X . Such X + E miss
T signatures have been explored by the LHC experiments for the cases where X is a jet [6, 7], a heavy quark [8–11], a vector boson [7, 12–17] or a Higgs boson [18–21]. In most searches, the object X originates from initial state radiation. However, such a process is Yukawa-suppressed in the case of a Higgs boson, labelled h , and the h + E miss
T signature instead opens an opportunity to directly probe the hard interaction involving the DM particles. This note presents a search for DM production in association with a Higgs boson, exploiting the most frequent decay (with a branching ratio of 57%
according to the SM) of a Higgs boson into two b -quarks, h → b b ¯ . The analysed dataset of pp collisions at
√ s = 13 TeV was recorded by the ATLAS experiment during 2015 to 2017 and corresponds to an integrated luminosity of 79.8 fb − 1 .
In addition to the approximate doubling of the size of the dataset, the sensitivity of this search is enhanced compared to previous results by improvements in the area of object reconstruction and performance, as motivated in the following. The sensitivity of the search relies heavily on the ability to identify both jets from the Higgs decay as b -jets, i.e. as originating from b -quarks, since this is a powerful means of background suppression. This becomes more difficult in the regions of very high energy that are probed in this search, where the Higgs boson is typically boosted and the hadronisation products of the b -quarks from its decay can overlap. In this regime, jets reconstructed from tracks are used for the b -jet identification.
When reconstructed with standard algorithms using a fixed radius parameter these jets cannot always be resolved [22]. In the search presented here, this problem is overcome by the use of variable-radius (VR) track jets, i.e. track jets reconstructed with an algorithm in which the radius parameter decreases with increasing jet transverse momentum ( p T ) [23–25]. This allows the separation and individual b -tagging of the two jets from highly boosted Higgs bosons and thus increases the sensitivity at large E miss
T . In events with lower E miss
T , a background that is difficult to model arises from multijet events in which one of the jets is mismeasured leading to fake E miss
T . A useful quantity when exploring E miss
T signatures is thus a measure of the E miss
T significance, i.e. how likely it is that there is genuine E miss
T from undetectable particles in the event. A new E miss
T significance definition in ATLAS, described in detail in Ref. [26], takes into account the resolutions of objects entering the E miss
T calculation, instead of using event-level quantities only. Within the analysis presented here, this object-based E miss
T significance is used to efficiently reduce the background contribution from multijet events.
The signal model used in the interpretation of the results is the same as in Ref. [19]: a Type-II two-Higgs-
doublet model (2HDM) with an additional U(1) Z
0gauge symmetry, referred to as Z 0 -2HDM. Among the
five physical Higgs bosons resulting from this model is one light scalar h that is identified with the SM
Higgs boson, and a pseudo-scalar A . The process yielding the signature of h +DM is pp → Z 0 → Ah ,
with the subsequent decay of A into χ χ ¯ , as illustrated in Figure 1. The relevant model parameters are
therefore the masses of the involved particles, m A , m Z
0, m χ , as well as the gauge coupling of the Z 0 , g Z
0,
q
¯
q Z
0h
A χ
¯ χ b
¯ b
Figure 1: The leading-order contribution of the production of dark matter and a Higgs boson through a new Z 0 mediator coupled to a new pseudoscalar Higgs boson A , where the latter decays primarily to χ χ ¯ .
and tan β , which denotes the ratio of the vacuum expectation values of the two Higgs fields coupling to the up- and down-type quarks.
The main SM backgrounds with a signature of two b -jets and large E miss
T are the production of top-quark pairs ( t¯ t ) and of vector bosons ( W, Z ) with additional b -jets. This analysis uses data control samples to determine the normalisation of these backgrounds. The control region definitions are made orthogonal to the signal region by different requirements on the number of charged leptons in the events considered. Sub- dominant backgrounds are estimated purely based on Monte Carlo (MC) simulation with no constraints from dedicated control samples, except for QCD multijet events. The multijet contribution is determined in a data-driven way based on ratios between several control samples and employing the object-based E miss
T significance.
The search is performed considering four disjoint E miss
T regions. A simultaneous profile-likelihood fit [27, 28] to the control and signal regions is performed to constrain the backgrounds and extract information about the potential presence of a signal.
2 ATLAS detector
The ATLAS experiment [29] is a multi-purpose detector with a forward-backward symmetric cylindrical geometry and nearly 4 π coverage in solid angle1. The three major sub-components are the tracking detector, the calorimeter, and the muon spectrometer. Charged-particle tracks and vertices are reconstructed by the inner detector (ID) tracking system, comprising silicon pixel and microstrip detectors covering the pseudorapidity range |η| < 2 . 5, and a straw tube tracker that covers |η| < 2.0. Since 2015, the pixel detector comprises an additional inner layer at a radius of 3.2 cm [30, 31]. The ID is immersed in a homogeneous 2 T magnetic field of a solenoid. Electron, photon, jet and τ lepton energies are measured with sampling calorimeters. The calorimeter system covers a pseudorapidity range of |η| < 4 . 9. Within the region |η | < 3 . 2, barrel and endcap high-granularity lead/liquid argon (LAr) electromagnetic calorimeters are deployed, with an additional thin LAr presampler covering |η | < 1 . 8 to correct for energy loss in material upstream of the calorimeters. Hadronic calorimetry is provided by a steel/scintillator-tile
1 ATLAS uses a coordinate system with its origin in the centre of the detector, i.e. at the nominal interaction point (IP). The x -axis points from the IP to the centre of the LHC ring, the y -axis points upward, and the z -axis points along the beam pipe such that a right-handed coordinate system is formed. Cylindrical coordinates ( r, φ ) are used in the transverse plane, φ being the azimuthal angle around the beam pipe. The pseudorapidity is defined as η = − ln tan (θ/ 2 ) , where θ is the polar angle. The quantity ∆R = p
(∆φ ) 2 + (∆η ) 2 is used to define a cone size.
calorimeter, segmented into three barrel structures for |η| < 1 . 7, and two copper/LAr hadronic endcap calorimeters. The forward region (3 . 1 < |η| < 4 . 9) is instrumented by a LAr calorimeter with copper (electromagnetic) and tungsten (hadronic) absorbers. Surrounding the calorimeters is a muon spectrometer (MS) with air-core toroids, a system of precision tracking chambers providing coverage over |η| < 2 . 7, and detectors with triggering capabilities over |η | < 2 . 4 to provide precise muon identification and momentum measurements.
3 Data and simulated events
The search presented here is performed using the pp collision data at
√ s = 13 TeV recorded by the ATLAS detector during 2015, 2016, and 2017. Only data collected with all detector components in good operating conditions are analysed and correspond to an integrated luminosity of 79.8 ± 1 . 6 fb − 1 .
Collision events are retained for further analysis if they are selected by one of the triggers described in the following. Events for samples containing no (signal regions) or one (control regions) lepton are selected by triggering on signatures with large missing transverse energy in the calorimeters. The thresholds increase from 70 GeV for 2015 data to 110 GeV for 2017 data. Since this analysis uses events with E miss
T as low as 150 GeV, where some of the triggers are not fully efficient yet, the trigger efficiencies are measured in data as a function of the E miss
T and correction factors for simulated samples are derived in order to match the efficiencies obtained in data. Events for control samples with two leptons are selected by single-lepton triggers with the lowest unprescaled p T thresholds, which vary with data-taking period. For electrons the thresholds are 24 and 26 GeV, and are supplemented by higher-threshold triggers (up to 300 GeV) with reduced isolation or identification requirements. For the muon triggers, the lowest unprescaled p T thresholds increase over time from 20 GeV to 26 GeV. These triggers include isolation requirements, and further triggers without isolation requirements but higher p T thresholds (up to 60 GeV) are used to preserve trigger efficiency at high p T values.
Events are required to contain at least one reconstructed vertex with more than one associated track with p T > 0 . 4 GeV, and the primary vertex (PV) is selected as the one with the highest Í
(p track
T ) 2 .
Monte Carlo (MC) simulated samples are produced for both the signal and background processes, except for the multijet background that is estimated from data. Significant sources of background are the production of V +jets (with V = W or Z ) and t¯ t events, with further contributions from diboson processes and associated production of a vector boson and a Higgs boson ( V h ).
V +jets events are generated using the Sherpa 2.2.1 event generator [32] with the NNPDF3.0 PDF set [33]
and filters to separate events with light, charm, and bottom jets in the final state. The matrix elements are computed at next-to-leading order (NLO) for up to two partons and at leading order (LO) for up to four partons. They are merged with the Sherpa parton shower using the MEPS@NLO prescription [34].
Details of the generator configurations can be found in Ref. [35]. The normalisations are determined at next-to-next-to-leading order (NNLO) in quantum chromodynamics (QCD) [36].
The diboson background samples use the same Sherpa version with an almost identical setup to the V +jets
samples, the differences being that no flavour filtering is applied and only up to three additional partons
are included in the matrix element, with up to one parton at NLO accuracy. More details are given in
Ref. [37]. No further normalisation is applied to these samples.
Events with single- or pair-production of top-quarks are generated at NLO in QCD using the Powheg-Box v2 [38–41] generator interfaced with Pythia 8 [42, 43] and using the NNPDF3.0 PDF and the A14 set of tuned parameters (tune) [44]. Details on the configurations can be found in Ref. [45]. The t¯ t samples are normalised to a cross-section calculation at NNLO in QCD, including next-to-next-to-leading logarithmic corrections for soft-gluon radiation [46]. The cross-section used to normalise the single-top-quark samples is calculated at NLO in QCD [47–50].
Backgrounds from associated V h production were generated with Powheg-Box v2 interfaced to Pythia 8 using NNPDF3.0 PDFs and the AZNLO tune [51]. The processes considered are quark-induced W h and Z h production as well as gluon-induced Z h production. The event samples are normalised to the best available theoretical predictions [52].
For the signal, the same simulation as for the previous result [19] is used: Signal events based on the Z 0 -2HDM simplified model are produced at tree-level using MadGraph5_aMC@NLO 2.2.3 [5, 53]
interfaced to Pythia 8, using the NNPDF3.0 PDF set and the A14 tune. In this work, the relevant parameters are fixed to tan β = 1 . 0, g Z = 0 . 8, and m χ = 100 GeV, m H = m H
±= 300 GeV, and a branching ratio B(A → χ χ) ¯ = 100% is assumed [5]. The mass of the Z 0 boson is scanned from 400 to 3000 GeV in 200 GeV steps and the mass of the pseudo-scalar A is scanned from 300 to 800 GeV in 100 GeV steps for the relevant regions of phase space where sensitivity to the presence of a h + E miss
T signal is expected.
All simulated samples include the effect of multiple proton-proton interactions per bunch crossing, as well as the effect on the detector response due to interactions from bunch crossings before or after the one containing the hard interaction (pile-up). This is achieved by overlaying inelastic pp collision events simulated using Pythia 8, with the A3 tune [54] and the NNPDF2.3LO PDF set [55]. Simulated events are corrected using per-event weights to describe the distribution of the average number of interactions per bunch crossing as observed in data. All samples are processed with the Geant 4 [56] based ATLAS detector simulation [57].
4 Object reconstruction and selection
Various physics objects are used to categorise events and sort them into different samples used in the analysis. The reconstruction and definition of the objects used in this search is outlined in the following.
4.1 Jets
Jets of particles can be reconstructed from different constituent objects, using either energy depositions in the calorimeter or tracks from the inner detector. As described in the following, this analysis makes use of a number of different jet input objects and algorithms to optimise the search sensitivity over a broad mass range.
4.1.1 Small-radius Jets
Small-radius (small- R ) jets are reconstructed using the anti- k t algorithm [58] with a radius parameter of
0.4 from topological clusters of energy deposits in the calorimeter [59], calibrated to the electromagnetic
scale. The full jet energy scale correction [60] is applied which corrects for the offset of the primary vertex from the detector origin, the non-compensation of the calorimetry, and dead material. The final result is a jet calibrated to the energy scale of stable hadrons. Jets with |η| < 2 . 5 are referred to as central jets and are required to have p T > 20 GeV. In the region |η| < 2 . 4, jets with p T < 60 GeV are further required to be identified as originating from the primary vertex using associated tracks [61] to suppress jets from pile-up interactions. Jets containing b -hadrons ( b -jets) are identified with an algorithm based on multivariate techniques [62, 63], referred to as b -tagging. This search employs the MV2c10 b -tagging discriminant. A working point is chosen at which the b -tagging efficiency for a fixed cut value on MV2c10 is 77% on average for jets originating from a b -quark, as determined with a MC simulation of t t ¯ processes.
The rejection factors for light-flavour jets and charm jets at this working point are approximately 4 and 113, respectively. Jets with 2 . 5 < |η| < 4 . 5 are referred to as forward jets and are required to have p T > 30 GeV.
4.1.2 Large-radius Jets
Large-radius (large- R ) jets are reconstructed using the anti- k t algorithm with a radius parameter of 1.0, as described in Ref. [64]. In this case, topological clusters calibrated with the local calibration weighting scheme [65] are used as inputs. The jets are groomed [65] using the trimming procedure as described in Ref. [66]. Subsequently, their energy and mass are calibrated to the particle-level energy and mass scale.
The calibrated jets are required to have p T > 200 GeV and |η | < 2 . 0. Since the jet mass corresponds to the Higgs-candidate mass it is one of the main discriminants against backgrounds, and it is reconstructed using calorimeter as well as tracking information [67]. The identification of the flavour content of the large- R jet is based on track jets ghost-associated [68] with the ungroomed jet. This is described in more detail in Sec. 4.1.3.
4.1.3 Variable-radius track jets
The VR track jets are reconstructed from inner detector tracks using the anti- k t algorithm. The considered tracks are required to have p track
T > 0 . 5 GeV and |η| < 2 . 5. In addition, the tracks must have at least 7 hits in total in the SCT and pixel detectors, and no more than one hit shared by multiple tracks in the pixel detector. If no hit is observed in an active detector element where one is expected, this is referred to as a missing hit. Tracks are required to have no more than one missing hit in the pixel detector and no more than two missing hits in the SCT detector. The longitudinal impact parameter | z 0 sin (θ)| is required to be less than 3 mm with respect to the primary vertex to reduce the pile-up contribution and to improve the efficiency in selecting tracks from the hard-scatter vertex.
The main feature of the VR jet reconstruction is the p T dependence of the jet radius [23]:
R → R eff (p T ) ≈ ρ
p T (1)
where the parameter ρ determines how the effective jet radius scales with the p T of the pseudo-jet during
the jet finding procedure. Two additional parameters R min and R max are used to set, respectively, a lower
and an upper cut on the jet radius. The optimal values of these three parameters in terms of efficiency for
double b -tagging over a wide mass range have been found to be: ρ = 30 GeV, R min = 0.02 and R max = 0.4
[69].
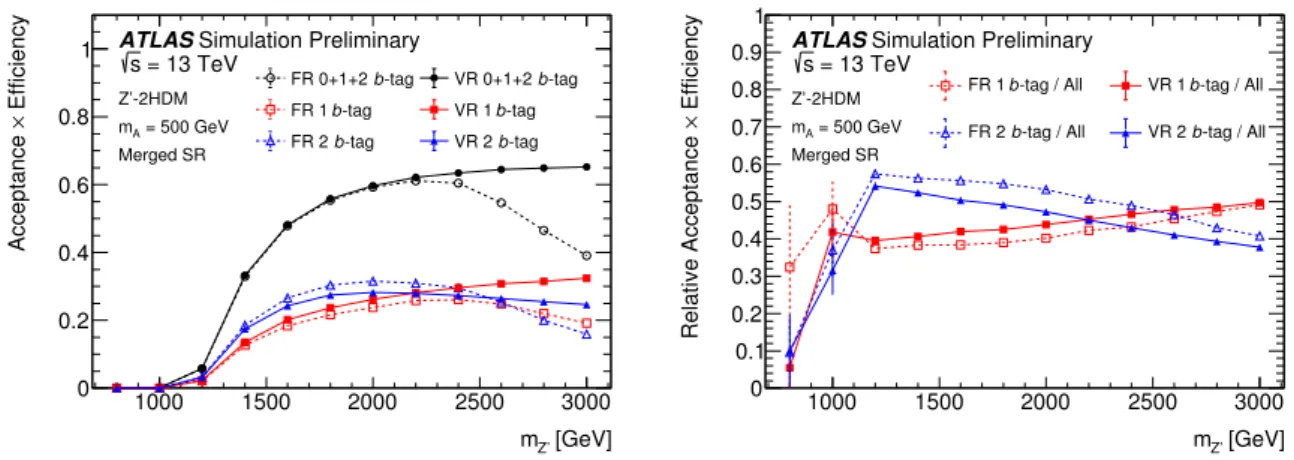
In Figure 2, the gain in selection efficiency for a signal with m A = 500 GeV from using VR track jets is illustrated. Figure 2(a) shows the overall efficiency for the full signal region selection described in Sec. 5 for events with E miss
T > 500 GeV, referred to as the merged region, and with the additional requirement that the mass of the Higgs candidate lies between 70 and 140 GeV, as a function of m Z
0. In particular, this selection requires at least two track jets associated to the large- R jet, and a minimum angular separation of the two leading track jets as described in Sec. 4.2. The efficiency is calculated only considering Higgs decays to b -quarks. Open symbols and dashed lines mark the efficiencies obtained when using fixed-radius (FR) track jets with a radius parameter of 0.2, while filled symbols and solid lines correspond to the use of VR track jets. The effect is shown separately for b -tag multiplicities of 1 (square markers) and 2 (triangular markers). In addition, the combined acceptance from events with 0, 1 or 2 b -tagged jets is drawn with circular markers. It is considerably higher for VR track jets in the region above 2.5 TeV, as events more often fail the requirement of more than one track jet in the case of FR jets. The increase in acceptance for both 1- and 2- b -tag events is also most pronounced for m Z
0above 2.5 TeV, corresponding to the largest boost of the Higgs boson. At m Z
0= 3TeV, it amounts to a factor of about 1.7 for events with two b -tags and 1.8 for events with one b -tag. Figure 2(b) is the relative efficiencies of 1 and 2 b -tagged events normalised by the combined acceptance for the two types of track jets, which shows similar b -tagging efficiencies for VR and FR track jets. Therefore the enhancement in signal acceptance originates from the improved subjet recovery ability with VR track jets, as shown by the combined acceptance (line with filled circular markers) in Figure 2(a),
Below 2.5 TeV, a higher efficiency for identifying two b -jets is obtained with FR track jets. This is due to the fact that in this regime, often more than two jets are reconstructed with the VR jet algorithm, and the two highest- p T jets are not always the b -jets [69]. Thus, when considering only the two highest- p T track jets, the efficiencyis smaller for VR compared to FR track jets. It is possible to recover this signal efficiency by considering the three highest- p T jets [69], but in the search presented here this was found to also increase the background contamination to a level that led to an overall decrease in sensitivity. Therefore, only the two highest- p T VR track jets are used in this analysis. Even though the signal efficiency is higher for FR track jets below 2.5 TeV, the use of the VR algorithm provides a better signal to background ratio.
In particular, including events containing only one b -tagged jet leads only to a marginal improvement in sensitivity when using VR track jets. Since the background modelling in such events is more challenging, they are not included in the result presented here, but are shown for illustration in Figure 2. More detailed studies and the potential inclusion of such events in the search are left for future work.
4.2 b-tagging calibration for VR track jets
For the VR track jets, a working point with average b -tagging efficiency of 77% for a fixed cut on the MV2c10 discriminant is used as well. In order to correct the b -tagging performance in simulation to that observed in data, the b -tagging algorithm needs to be calibrated in data. The calibration results are provided in the form of scale factors (SFs):
SF ≡ ε data b
ε MC b , (2)
where ε data b and ε b MC correspond to the b -tagging efficiency in data and simulation, respectively. The
SFs are measured as a function of the jet p T . The efficiency is estimated from the data set collected
in 2015 and 2016 by analysing a sample of t t ¯ events, in which both the W bosons from the top quarks
1000 1500 2000 2500 3000 [GeV]
m
Z’0 0.2 0.4 0.6 0.8 1
Efficiency × Acceptance
-tag
FR 0+1+2 b VR 0+1+2 b-tag -tag
FR 1 b VR 1 b-tag -tag
FR 2 b VR 2 b-tag
ATLAS Simulation Preliminary = 13 TeV
s
Z’-2HDM = 500 GeV mA
Merged SR
1000 1500 2000 2500 3000
[GeV]
m
Z’0 0.1 0.2 0.3 0.4 0.5 0.6 0.7 0.8 0.9 1
Efficiency × Relative Acceptance
-tag / All
FR 1 b VR 1 b-tag / All -tag / All
FR 2 b VR 2 b-tag / All
ATLAS Simulation Preliminary = 13 TeV
s
Z’-2HDM = 500 GeV mA
Merged SR
Figure 2: (a) Acceptance × efficiency ( A × ε ) for different b -tag multiplicities as a function of m Z
0in a Z 0 -2HDM model with m A = 500 GeV, tan β = 1 . 0, g Z = 0 . 8, m χ = 100 GeV, and m H = m H
±= 300 GeV, for events with E miss
T > 500 GeV (merged SR) when using FR track jets (open symbols, dashed lines) and VR track jets (filled symbols, solid lines). The selection includes a requirement to have at least two track jets associated to the large- R jet, and requires a minimum angular separation of the two leading track jets, as described in Sec. 4.2. The combined A × ε for events with either 0, 1 or 2 b -tagged jets is drawn with circular markers, while triangular and square markers correspond to the individual A × ε for 1 and 2 b -tag(s), respectively. (b) Relative A × ε for different b -tag multiplicities with the same Z 0 -2HDM model and selections. The A × ε for 1 b -tagged and 2 b -tagged events are normalised to the sum of events with either 0, 1 or 2 b -tagged jets (“All”), as obtained for each track jet choice individually.
decay leptonically, using a combinatorial likelihood approach [70]. The VR track jets considered for the calibration are required to have p T > 10 GeV and |η| < 2 . 5.
Moreover, in order to mitigate the effect of applying an ambiguous b -tagging in events where two VR track jets become concentric due to the p T -dependence of their sizes, a cut on the angular separation between the two leading associated VR track jets ∆R( VR 1 , VR 2 ) is applied.
The SFs are derived up to a p T of 250 GeV, above which the event statistics is limited. The uncertainty in the SFs for the p T range below 250 GeV is dominated by uncertainties on the modelling of t¯ t events in the simulation. At high p T , the SFs are fixed to those in the last explicitly calibrated bin, and an additional high- p T uncertainty is assigned to account for effects on the b -tagging performance from possible reconstruction imperfections in the simulation. This is adopted from the procedure applied for calorimeter jets as described in Ref. [71]. Since this is a conservative estimate of the uncertainty, the difference in the p T scale of calorimeter and track jets is not taken into account explicitly.
Similarly to the efficiency for tagging jets originating from b -quarks, the rate of incorrectly tagging jets originating from charm or light-flavour quarks as b -jets has to be calibrated. Since the effect of the mistag uncertainties is subdominant, calibration results of these mistag efficiencies based on calorimeter jets are extrapolated to the case of track jets.
4.3 Leptons
The DM signature sought here does not contain any leptons. Hence, the presence of leptons is used to
veto events in the signal region and to select events for control samples. In the following, the selections
applied in the different cases are outlined for each lepton flavour.
4.3.1 Electrons
Electron candidates are reconstructed from a cluster of energy deposits in the electromagnetic calorimeter matched to a inner detector track [72], and identified through a likelihood-based method that defines several efficiency working points [73]. This analysis imposes loose identification requirements and loose track-based isolation criteria. Only candidates with |η| < 2 . 47 are considered, and their impact parameters are required to be consistent with the primary vertex. The baseline objects used to veto the presence of electrons in certain regions are required to have p T > 7 GeV. For the selection of events containing electrons, a tighter cut of p T > 27 GeV is used. These electrons are referred to as signal electrons in the following.
4.3.2 Muons
The muon reconstruction considers candidates with |η| < 2 . 7 and relies mainly on tracks or track segments from the muon spectrometer and matched inner detector tracks where available ( |η | < 2 . 5) [74]. The impact parameters must be consistent with the primary vertex. A loose muon definition is used for the purpose of vetoing events containing muons in certain regions. The candidates are required to have p T > 7 GeV and to fulfil loose identification and loose, track-based isolation requirements. For the selection of events containing muons, candidates must in addition have a p T exceeding 25 GeV and
|η| < 2 . 5. For single-muon events, tighter identification and isolation requirements are applied. These muons are referred to as signal muons in the following.
4.3.3 Taus
The reconstruction of τ -leptons is described in Refs. [75] and [76]. All candidates are required to have p T > 20 GeV, have one or three tracks, and have |η| < 2 . 5, excluding the region 1 . 37 < |η| < 1 . 52. The identification is based on a boosted decision tree discriminant that combines tracking and calorimeter based information, and in this analysis the loose working point is used. In order to suppress events with a τ from a W decay an additional τ -candidate definition is used: a small- R jet is considered as a τ -candidate if it contains one to four tracks and lies within ∆φ < π
8 of the E miss
T direction.
4.4 Missing transverse momentum
The transverse momentum imbalance is calculated as the negative vector transverse momentum sum of the reconstructed and calibrated physics objects, and an additional soft term [77, 78]. The soft term is built from tracks that are not associated with any reconstructed electron, muon or jet, but which are associated with the primary vertex. Leptons fulfilling the veto-lepton definitions are used in the calculation, as are small- R jets selected as described in Sec. 4.1.1, with the modification that the p T requirement for forward jets is lowered to 20 GeV. The absolute value of the missing transverse momentum is denoted as E miss
T . In order to better identify whether an event contains genuine E miss
T from undetectable particles or whether the reconstructed E miss
T is caused by object mismeasurements, resolution effects, or inefficiencies, an
estimate of the E miss
T significance S is used. This analysis employs a definition of S that takes into account the expected resolution of the objects from which the E miss
T is calculated as well as directional correlations.
Details of this object-based E miss
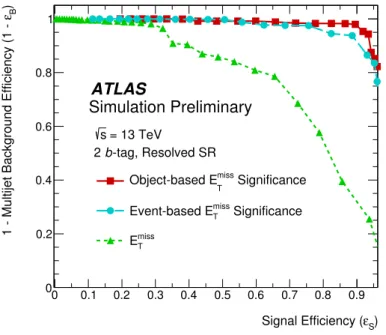
T significance can be found in Ref. [26]. The performance of this variant of S in terms of background rejection and signal efficiency is studied using simulated event samples.
For the background, dijet events generated with Pythia 8 using the A14 set of tuned parameters and the NNPDF2.3 LO PDF set are used. The signal efficiency is determined for a simulation with m Z
0= 400 GeV and m A = 300 GeV, resulting in relatively low E miss
T . The result is shown as the line with square markers in Figure 3. Here, the efficiencies for signal and background are estimated with respect to a selection that requires a minimum angular separation between the E miss
T vector and the leading jets in an event (for details see Sec. 5). With this approach, more than 95% of dijet events can be rejected by introducing a requirement of S > 16, while retaining a signal efficiency close to 90%. For comparison, also the performance of a requirement on an event-based E miss
T significance definition (dashed line with circular markers) and on E miss
T itself (densely-dashed line with triangular markers) is shown in Figure 3, illustrating the significant improvement obtained with the object-based definition employed in this search. For example, for signal efficiencies above 80%, the background rejection factor for the object-based significance is approximately three to four times as high as for the event-based one.
S
) Signal Efficiency ( ε 0 0.1 0.2 0.3 0.4 0.5 0.6 0.7 0.8 0.9 )
Bε 1 - Multijet Background Efficiency (1 -
0 0.2 0.4 0.6 0.8 1
ATLAS
Simulation Preliminary
= 13 TeV s
-tag, Resolved SR 2 b
Significance
miss
Object-based E
TSignificance
miss
Event-based E
T missE
TFigure 3: Performance of the object-based E miss
T significance (line with square markers) in terms of the signal efficiency and background rejection as estimated from a signal simulation with m Z
0= 400 GeV and m A = 300 GeV and a dijet simulation, respectively, in comparison to an alternative definition of the E miss
T significance (dashed line with circular markers) and E miss
T itself (densely-dashed line with triangular markers). Selections on these three variables are applied in addition to a requirement on the angular separation between the E miss
T vector and the leading jets in an event.
4.5 Overlap Removal
Ambiguities in the object identification which arise during reconstruction, i.e. when a reconstructed object
matches multiple object hypotheses, are resolved in several steps that give different priority to the object
types. First, electron candidates are removed if they share a track with another electron candidate that has a higher p T . Next, τ candidates are removed if they are within ∆R = 0 . 2 of an electron or muon candidate.
Electron candidates are then rejected if they share a track with a muon candidate. In the next step, small- R jets are removed that lie within ∆R = 0 . 2 of any remaining electron. Electrons are then removed if they are within ∆R = min ( 0 . 4 , 0 . 04 + 10 GeV /p electron
T ) of a small- R jet. Small- R jets are further removed if they are within ∆R = 0 . 2 of any surviving muon if the jets have fewer than three tracks or if the muon p T is greater than half the jet p T and greater than 70% of the p T sum of the tracks associated to the jet.
Moreover, muons are removed if they are within ∆R = min ( 0 . 4 , 0 . 04 + 10 GeV /p muon
T ) of a small- R jet.
Finally, large- R jets are rejected if they are separated from an electron by less than ∆R = 0 . 1.
5 Event selection
In addition to the data quality, trigger and primary-vertex requirements described in Sec. 3, a number of further selections are made. To suppress non-collision backgrounds, an event is rejected if it contains a jet that fails a number of quality requirements [79]. Events containing a τ -candidate are also rejected. The E miss
T (or an equivalent quantity, depending on the lepton multiplicity as will be described later) is required to be larger than 150 GeV. Multijet background events can pass this selection if the energy of a jet is poorly measured or if semi-leptonic hadron decays occur inside a jet, both leading to sizeable E miss
T . To further suppress this background, additional cuts are introduced: the azimuthal angular difference between the E miss
T and any of the three highest- p T jets (min( ∆φ(E miss
T , jets ) )) is required to be greater than 20 ◦ . In this, forward jets are only considered if there are less than three central jets. The azimuthal angular difference between the direction of the E miss
T and the absolute value p miss
T of the negative vector sum of the transverse momenta of tracks with p T > 500 MeV associated with the primary vertex has to be less than 90 ◦ . Events passing all of the above selections are divided into resolved regions with E miss
T < 500 GeV and a merged region with E miss
T > 500 GeV. The resolved region is further divided into three exclusive regions according to the E miss
T with [150,200) GeV, [200,350) GeV and [350,500) GeV.
In the resolved regions, events with at least two small- R jets are considered. Exactly two of the jets are required to be b -tagged. The Higgs-boson candidate is reconstructed from the two highest- p T b -jets. At least one of these two jets has to have a p T above 45 GeV. The scalar sum of the p T of these two jets and of the highest- p T additional jet, if present, has to be larger than 63% of the scalar p T sum of all jets in the event to reject t t ¯ events. In order to reduce backgrounds from multijet events, the azimuthal separation between the two jets forming the Higgs candidate is restricted to below 140 ◦ and the ∆R between them must be less than 1.8. The Higgs candidate has to be separated from the E miss
T by at least 120 ◦ . The object-based E miss
T significance has to fulfil S > 16. For events with two (three or more) jets, the scalar p T sum of the first two (three) jets has to be greater than 120 (150) GeV. In constructing this scalar p T sum, first all central jets are considered, then forward jets, each set of jets ordered by decreasing p T .
The merged-region selection requires the presence of at least one large- R jet. The two leading VR track
jets associated with the leading large- R jet are required to be b -tagged and pass the minimum angular
separation cut as described in Sec. 4.2. Events that contain one or more b -tagged VR track jets outside
the large- R jet are rejected. The p T of the leading large- R jet is required to be greater than 43% of the
scalar sum of the transverse momenta of the leading large- R jet and all small- R jets outside it, to reduce
the contribution from t¯ t events.
1000 1500 2000 2500 3000 [GeV]
m
Z’0 0.1 0.2 0.3 0.4 0.5 0.6 0.7
Efficiency × Acceptance
-tag Resolved 2 b
-tag Merged 2 b
-tag Resolved + Merged 2 b
ATLAS Simulation Preliminary = 13 TeV
s
Z’-2HDM = 500 GeV m
AVR track jets
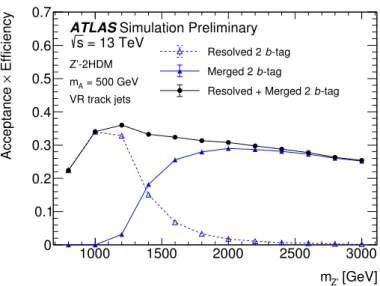
Figure 4: Acceptance × efficiency for events with 2 b -tagged jets as a function of m Z
0, for a fixed mass m A = 500 GeV, tan β = 1 . 0, g Z = 0 . 8, m χ = 100 GeV, m H = m H
±= 300 GeV. The values obtained for the resolved regime are shown in blue with open triangles and a dashed line, the ones for the merged regime with filled triangles and a solid line. The combined selection efficiency is shown in black.
The signal region (SR) selection retains only events that do not contain any loose electrons or muons.
Figure 4 shows the selection efficiency for a signal with m A = 500 GeV as a function of m Z
0for events with two b -jets. The selections applied are the same as in Figure 2, i.e. the full event selection with the additional Higgs-candidate mass window cut of [70, 140] GeV. Again, the branching ratio for the decay into b b ¯ is not included. Figure 4 illustrates the complementarity of the resolved (open triangles, dashed line) and merged (filled triangles, solid line) regimes, leading to an overall efficiency between approximately 20% and 35% in the 2 b -tag category over most of the mass range, as shown in black.
Events containing leptons, on the other hand, are used to define control regions (CRs) to constrain the main background contributions. To estimate the backgrounds from W +jets and t¯ t production, a control sample is defined by requiring exactly one signal muon and no further loose muons or electrons, referred to as the 1 µ -CR. In order to mimic the way these processes can contribute in the signal region, the muon momentum is added to the missing momentum vector. The almost purely calorimeter-based missing transverse energy obtained in this way is labelled E miss, no µ
T . To constrain the Z (νν) +jets background contribution, events containing exactly two same-flavour signal leptons and no further loose electrons or muons are used both in the muon and in the electron channel. These regions are referred to as the 2 e -CR, the 2 µ -CR or, collectively as the 2 ` -CR. In the muon channel, the two muons are required to have opposite charge. The electron (muon) pair must have an invariant mass of 83 GeV < m ll < 99 GeV (71 GeV < m ll < 106 GeV). In order to reduce the t t ¯ and single top background, the ratio of E miss
T to
the square root of the scalar sum of lepton and jet transverse momenta in the event is required to be less than 3.5
√
GeV. The p T of the dilepton system, labelled p ``
T , corresponds to the p T of the Z boson and as such serves as a proxy for the E miss
T , in analogy to Z(νν) +jets events where the E miss
T from the neutrinos also corresponds to the boson p T . The full event selection is summarised in Table 1.
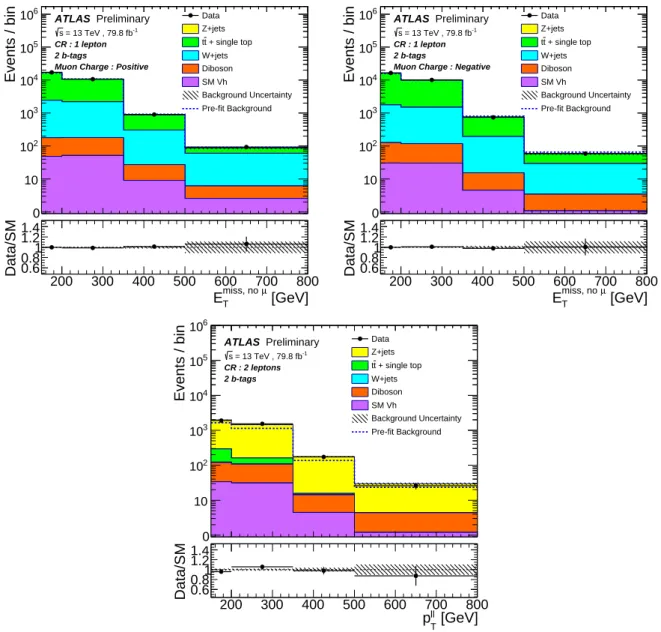
Figure 5 shows the distribution of the variable used to mimic E miss
T in the control regions. The E miss , no µ
T
variable is shown at the top for events in the 1 µ -CR with a positively charged muon on the left and with a
negatively charged muon on the right. This separation of events is motivated by the fact that in t t ¯ events
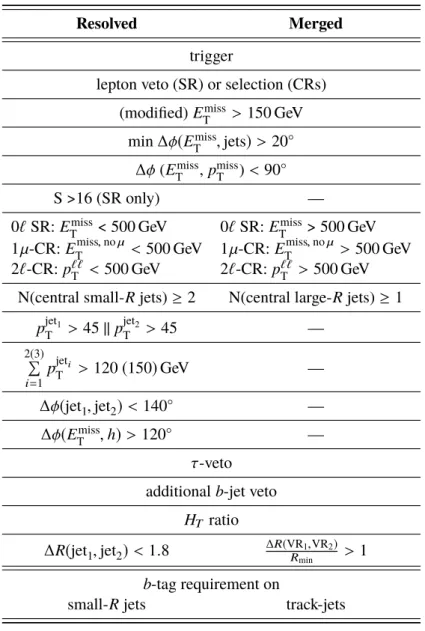
Table 1: Summary of the resolved and merged event selections in the signal and control regions. S denotes the object based E miss
T significance. The H T ratio requirement refers to the selections on the ratio of the p T of the leading jet(s) to the sum of all jet p T .
Resolved Merged
trigger
lepton veto (SR) or selection (CRs) (modified) E miss
T > 150 GeV min ∆ φ(E miss
T , jets ) > 20 ◦
∆φ ( E miss
T , p miss
T ) < 90 ◦
S >16 (SR only) —
0 ` SR: E miss
T < 500 GeV 0 ` SR: E miss
T > 500 GeV 1 µ -CR: E miss , no µ
T < 500 GeV 1 µ -CR: E miss , no µ
T > 500 GeV 2 ` -CR: p ``
T < 500 GeV 2 ` -CR: p ``
T > 500 GeV N(central small- R jets) ≥ 2 N(central large- R jets) ≥ 1
p jet
1T > 45 || p jet
2T > 45 —
2 ( 3 )
Í
i =1 p jet
iT > 120 ( 150 ) GeV —
∆ φ( jet 1 , jet 2 ) < 140 ◦ —
∆φ(E miss
T , h) > 120 ◦ —
τ -veto additional b -jet veto
H T ratio
∆R( jet 1 , jet 2 ) < 1 . 8 ∆R( VR R
min1, VR
2) > 1 b -tag requirement on
small- R jets track-jets
equal numbers of W bosons with positive and negative charge are produced, while the direct production in pp collisions yields more positively than negatively charged W bosons. Thus, the purity in W and t¯ t events is increased slightly by this separation. The bottom figure shows the p ``
T distribution in the
2 ` -CR, combining the electron and muon channel. The filled histograms correspond to the background
prediction after the combined fit described in Sec. 8, while the dashed blue line indicates the total
background expectation before the fit. The post-fit predictions agree with the data (black points) within
the uncertainties (grey shaded areas). The various sources of uncertainties considered are discussed in
Sec. 7. Additional event samples are selected for the estimation of the multijet background, described in
more detail in Sec. 6.
Events / bin
1 10 10
210
310
410
510
6 DataZ+jets + single top t t W+jets Diboson SM Vh
Background Uncertainty Pre-fit Background
Preliminary
ATLAS
= 13 TeV , 79.8 fb-1s CR : 1 lepton 2 b-tags
Muon Charge : Positive
0
[GeV]
µ miss, no
E
T200 300 400 500 600 700 800
Data/SM 0.6 0.8
1.2 1 1.4 0
Events / bin
1 10 10
210
310
410
510
6 DataZ+jets + single top t t W+jets Diboson SM Vh
Background Uncertainty Pre-fit Background
Preliminary
ATLAS
= 13 TeV , 79.8 fb-1s CR : 1 lepton 2 b-tags
Muon Charge : Negative
0
[GeV]
µ miss, no
E
T200 300 400 500 600 700 800
Data/SM 0.6 0.8
1.2 1 1.4 0
Events / bin
1 10 10
210
310
410
510
6Data Z+jets
+ single top t t W+jets Diboson SM Vh
Background Uncertainty Pre-fit Background
Preliminary
ATLAS
= 13 TeV , 79.8 fb-1s CR : 2 leptons 2 b-tags
0
[GeV]
ll
p
T200 300 400 500 600 700 800
Data/SM 0.6
0.8 1 1.2 1.4
0
Figure 5: Distributions of E miss, no µ
T in the 1 µ -CR (top) and p ``
T in the 2 ` -CR (bottom). The distribution of the 1 µ -CR
is shown for events with positively (left) and negatively (right) charged muons separately. The distributions in the
the 1 µ -CR are separated by the muon charge because the fit uses the muon charge as the discriminating variable to
separate the t t ¯ process from the W +jets process, as described in Sec. 8. The upper panels show a comparison of
data to the SM expectation before (dashed lines) and after the background-only fit (solid histograms). The bottom
panel displays the ratio of data to SM expectations after the background-only fit, with its systematic uncertainty
considering correlations between individual contributions indicated by the hatched band. The rightmost bin includes
overflows.
6 Background estimation
The dominant backgrounds after all SR event selections are applied are Z (νν) +jets, W +jets, and t¯ t production. The acceptance of these backgrounds is estimated using MC simulation, and their modelling is constrained using the two control regions described in Sec. 5: the 1 µ -CR is designed to constrain the t¯ t and W +jets backgrounds, and the 2 ` -CR constrains the Z +jets background. The backgrounds are also constrained by the sidebands of the fit variable in the SR, the invariant mass of the Higgs boson candidate m h . Details about the statistical fit can be found in Sec. 8.
The multijet background originating from pure strong interactions is one of the sub-dominant backgrounds in the resolved SR. For the merged SR and the two CRs, the multijet background has been found previously to be negligible [19]. It is challenging to model by MC simulation, and therefore a data-driven method is developed for the SR. A multijet-enriched CR is defined by inverting the minimum of the azimuthal angle separation between E miss
T and the three highest- p T jets (min( ∆φ ( E miss
T ,jets))<20 ◦ ), and inverting the requirement on the object-based E miss
T significance ( S < 16). In this CR, the shape of m j j distribution of the data is scaled to model the multijet background in the SR (min( ∆φ ( E miss
T ,jets))>20 ◦ , S > 16), assuming the distribution of min( ∆φ ( E miss
T ,jets)) is independent of S . The absence of correlation between these two variables has been studied and is confirmed within statistical uncertainties.
The result of the multijet estimation is shown in Table 2. Due to the new requirement S > 16, the multijet background contribution is reduced significantly compared to the previous analysis based on the 2015 and 2016 pp collision data [19]. For the probed Z 0 -2HDM signals, a selection efficiency of at least 95% is maintained. The estimated multijet yield is substantially smaller than the statistical uncertainty from data, and thus it is neglected for the resolved SR in the statistical analysis described in Sec. 8 as well.
Table 2: Predicted numbers of multijet background events in each region.
Region 150 GeV< E miss
T < 200 GeV 200 GeV< E miss
T < 350 GeV 350 GeV< E miss
T < 500 GeV
Multijet yield prediction 38 ± 17 14 ± 22 0 . 1 ± 81
7 Systematic uncertainties
Dominant sources of experimental systematic uncertainty arise from the calibration of the b -tagging efficiency, the integrated luminosity, as well as the scale and resolution of the energy and the mass of the jets. The uncertainties on the b -tagging efficiency originate mainly from the uncertainties on the measurement of the flavour tagging efficiency in t t ¯ events [62, 63], and from the extrapolation to high- p T jets as described in Sec. 4.1.3. The uncertainty in the combined 2015-2017 integrated luminosity is 2.0%. It is derived following a methodology similar to that detailed in Ref. [80] from calibrations of the luminosity scale. The small- R and the large- R jets are calibrated separately, with a series of simulation- based corrections and in situ techniques, taking account of differences between MC and real data [60, 67].
Another main source is the uncertainties on E miss
T trigger efficiencies, which was determined inclusively for all b -tagged jet multiplicities. An uncertainty on the E miss
T soft-term resolution and scale is also taken into account [81]. Other uncertainties which have a smaller impact are the uncertainties on the lepton energy and momentum scales, and the lepton identification and trigger efficiencies [72–74].
Dominant sources of theoretical systematic uncertainty originate from the number of MC events, the
modelling of the signal and the background processes listed in the following: t t ¯ , V + jets, associated
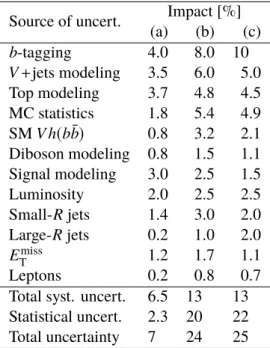
Table 3: Dominant sources of uncertainty for three representative Z 0 -2HDM scenarios after the fit to simulated data including the signal: (a) (m Z
0, m A ) = ( 0 . 6 TeV , 0 . 3 TeV ) , (b) (m Z
0, m A ) = ( 1 . 4 TeV , 0 . 6 TeV ) , and (c) (m Z
0, m A ) = ( 2 . 6 TeV , 0 . 3 TeV ) . The effect is expressed as the relative uncertainty on the signal strength, assuming total cross- sections of (a) 452 fb, (b) 3.75 fb, and (c) 2.03 fb. The three Z 0 -2HDM scenarios are chosen to represent kinematics from resolved to merged regions, and they are close to the expected exclusion limit. The total uncertainty is the quadrature sum of statistical and total systematic uncertainties.
Source of uncert. Impact [%]
(a) (b) (c)
b -tagging 4.0 8.0 10
V +jets modeling 3.5 6.0 5.0
Top modeling 3.7 4.8 4.5
MC statistics 1.8 5.4 4.9 SM V h(b b) ¯ 0.8 3.2 2.1 Diboson modeling 0.8 1.5 1.1 Signal modeling 3.0 2.5 1.5
Luminosity 2.0 2.5 2.5
Small- R jets 1.4 3.0 2.0 Large- R jets 0.2 1.0 2.0 E miss
T 1.2 1.7 1.1
Leptons 0.2 0.8 0.7
Total syst. uncert. 6.5 13 13 Statistical uncert. 2.3 20 22 Total uncertainty 7 24 25
production of the SM Higgs boson decaying to b b ¯ ( V h(b b) ¯ ), and diboson production. The evaluation of the theory uncertainties follows the same strategy described in Ref. [82].Signal acceptance uncertainties are evaluated by varying the parameters of the MC samples, and comparing the results by applying the analysis selection at generator level. Generator tuning, variations of parton distribution functions, and scale uncertainties are taken into account. Leading background ( V + jets and t t ¯ ) processes are normalised to the data in the final likelihood fit by using dedicated CRs, and other backgrounds are constrained by the theory uncertainties on the overall cross-section of the background [83]. Shape uncertainties on the p T distributions of the W/Z boson and the reconstructed dijet mass spectra are evaluated by comparing samples obtained with different MC generator settings, as well as comparison to dedicated Z control region data. An overall normalisation uncertainty is used for the SM V h(b b) ¯ background [82]. Table 3 quantifies the dominant sources of uncertainties in terms of the relative uncertainty on the signal strength, defined as the ratio of the measured signal yield to the theory prediction, after the fit to simulated data including the signal assuming three representative Z 0 -2HDM-scenarios. This search is statistically limited for highly-boosted signatures.
8 Results
A fit to the invariant mass of the Higgs boson candidate m h is used to search for a signal, where m h is
represented by the dijet invariant mass m j j of the two leading small- R jets in the resolved SR, and the
leading large- R jet mass m J in the merged SR. The fit is based on a binned likelihood approach, and
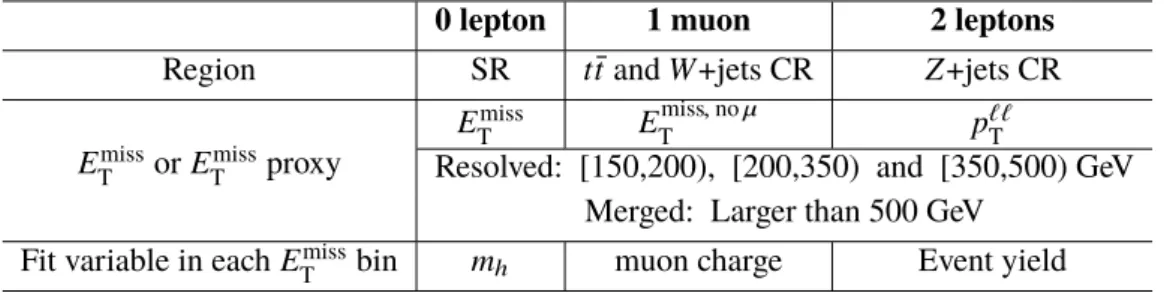
Table 4: Event categories used in the fit.
0 lepton 1 muon 2 leptons
Region SR t t ¯ and W +jets CR Z +jets CR
E miss
T or E miss
T proxy
E miss
T E miss, no µ
T p ``
T
Resolved: [150,200), [200,350) and [350,500) GeV Merged: Larger than 500 GeV
Fit variable in each E miss
T bin m h muon charge Event yield
systematic uncertainties are included in the likelihood function as nuisance parameters with Gaussian or log-normal constraints and profiled [82]. To account for changes in the background composition and to benefit from a higher signal sensitivity with increasing E miss
T , the data in the SR and the two CRs are split into four ranges in E miss
T ( E miss , no µ
T in 1 µ -CR, and p ``
T in 2 ` -CR) that are fit simultaneously:
[ 150 GeV , 200 GeV ) , [ 200 GeV , 350 GeV ) , [ 350 GeV , 500 GeV ) , and [ 500 GeV , ∞) . In the 1 µ -CR, the fit uses the electric charge of the µ as the discriminating variable to separate the t t ¯ process from the W +jets process, since t¯ t provides an equal number of µ + and µ − , while a prevalence of µ + is expected from W +jets. In the 2 ` -CR, the fit uses only the total event yield due to limited data statistics. Table 4 summarises the event categories used in the fit.
The V +jets background in the SR is dominated by jets containing b - or c -quarks, denoted as heavy flavour (HF) jets. The normalisations of t¯ t , W + HF, and Z + HF processes are free parameters in the fit. For V +jets, the flavour composition of the two jets being bb , bc, b and LF (LF = light-flavour quark), and cc are subject to systematic uncertainties. The post-fit normalisation factors of t¯ t , W + HF, and Z + HF are scaled to 1 . 10 ± 0 . 08, 1 . 51 ± 0 . 22, and 1 . 42 ± 0 . 10, respectively. The normalisations of other backgrounds modelled using MC simulations are constrained to the theory predictions within uncertainties, as detailed in Ref. [83].
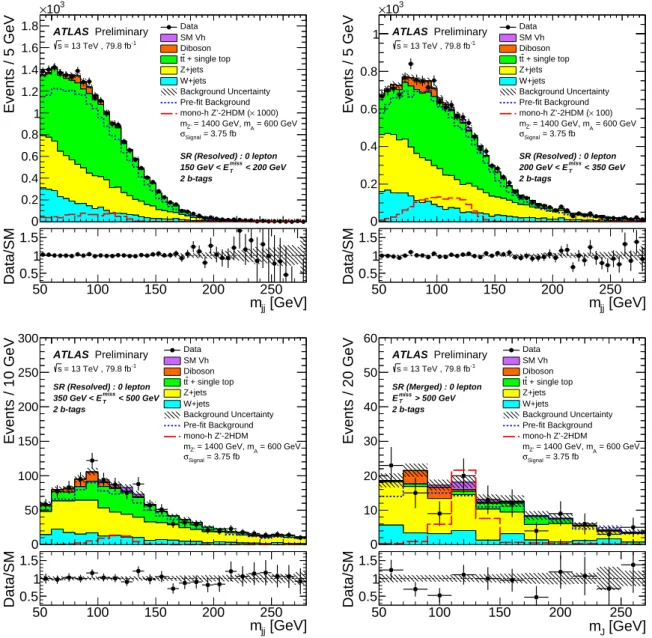
The distributions of m j j or m J for the SR are shown in the four E miss
T regions in Figure 6. The E miss
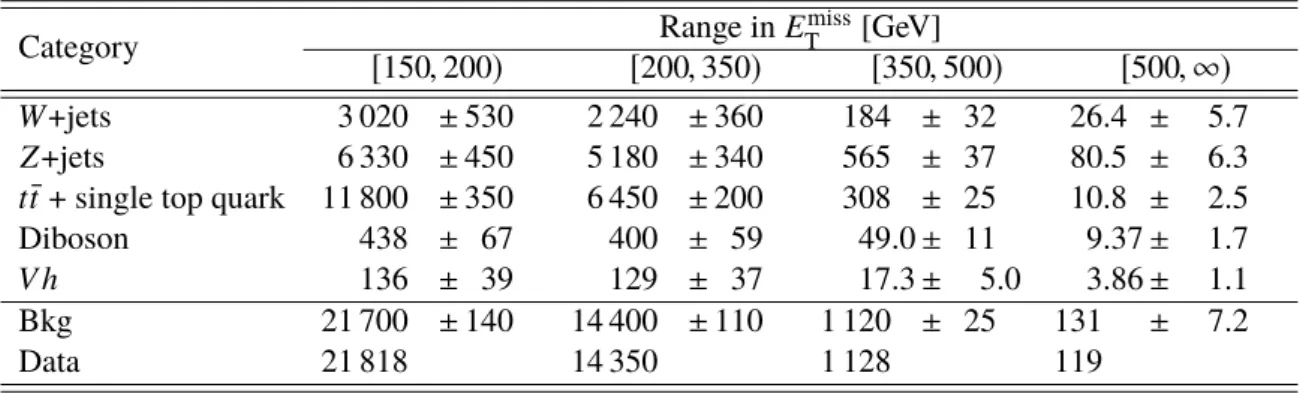
T dis- tribution for all SR regions combined is shown in Figure 7. The number of expected background events for each process after the fit, as well as the observed number of data events in each E miss
T region, are summarised in Table 5. No significant deviation from the SM expectation is found. The statistical model is further validated by replacing the signal with the Z Z → ννb b ¯ process, and the signal strength of Z Z production extracted from the fit agrees with the SM prediction.
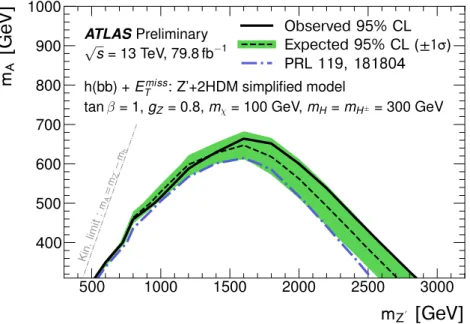
The results are interpreted as exclusion limits at 95% confidence level (CL) on the production cross- section of h + DM events σ h +DM times the branching ratio B(h → b b) ¯ with the CL s formalism [84]
using a profile likelihood ratio test statistic. Exclusion contours in the (m Z
0, m A ) space in the Z 0 -2HDM scenario are presented in Figure 8. The improvement from using VR track jets instead of jets with a fixed cone size of 0 . 2 (FR) is shown in Figure 9, which compares the expected upper limits on the signal strength µ , using the same luminosity in the 2 b -tagged region. Other differences between the two analyses include the suppression of the multijet background using the object-based E miss
T significance,
and reduced uncertainties from the MC statistics and the calibration of the b -tagging efficiency in the VR
analysis. For signals with highly boosted Higgs bosons, the results with VR track jets show significant
improvement of up to 200%. Figure 14 in the Appendix compares the expected upper limits on µ against
the previous iteration (scaled to 79.8 fb − 1 ) performed with FR track jets and both one and two b -tagged
events included in the SR [19]. The analysis based on VR track jets outperforms the predecessor based on FR track jets considerably, justifying the strategy of using only events with two b-tagged jets as described in Sec. 4.1.3.
Table 5: Numbers of expected background events for each background process after the background-only profile likelihood fit, the sum of all background components after the fit, and observed data yields for events with two b -tags in the resolved and merged channels for each E miss
T region. The multijet background is negligible and not included in the fit. Statistical and systematic uncertainties are combined. The uncertainties in the total background take into account the correlation of systematic uncertainties among different background processes. The uncertainties on the total background can be smaller than those on individual components due to anti-correlations between nuisance parameters.
Category Range in E miss
T [GeV]
[ 150 , 200 ) [ 200 , 350 ) [ 350 , 500 ) [ 500 , ∞)
W +jets 3 020 ± 530 2 240 ± 360 184 ± 32 26.4 ± 5.7
Z +jets 6 330 ± 450 5 180 ± 340 565 ± 37 80.5 ± 6.3
t t ¯ + single top quark 11 800 ± 350 6 450 ± 200 308 ± 25 10.8 ± 2.5
Diboson 438 ± 67 400 ± 59 49.0 ± 11 9.37 ± 1.7
V h 136 ± 39 129 ± 37 17.3 ± 5.0 3.86 ± 1.1
Bkg 21 700 ± 140 14 400 ± 110 1 120 ± 25 131 ± 7.2
Data 21 818 14 350 1 128 119
Events / 5 GeV
0 0.2 0.4 0.6 0.8 1 1.2 1.4 1.6 1.8
10
3×
Data SM Vh Diboson
+ single top t t Z+jets W+jets
Background Uncertainty Pre-fit Background
1000)
× mono-h Z’-2HDM (
= 600 GeV = 1400 GeV, mA
mZ’
= 3.75 fb
Signal
σ
Preliminary ATLAS
= 13 TeV , 79.8 fb-1
s
SR (Resolved) : 0 lepton < 200 GeV
miss
150 GeV < ET
2 b-tags
0
[GeV]
m
jj50 100 150 200 250
Data/SM 0.5
1 1.5 0
Events / 5 GeV
0 0.2 0.4 0.6 0.8 1
10
3×
Data SM Vh Diboson
+ single top t t Z+jets W+jets
Background Uncertainty Pre-fit Background
100)
× mono-h Z’-2HDM (
= 600 GeV = 1400 GeV, mA
mZ’
= 3.75 fb
Signal
σ
Preliminary ATLAS
= 13 TeV , 79.8 fb-1
s
SR (Resolved) : 0 lepton < 350 GeV
miss
200 GeV < ET
2 b-tags
0
[GeV]
m
jj50 100 150 200 250
Data/SM 0.5
1 1.5
0
Events / 10 GeV
0 50 100 150 200 250 300
Data SM Vh Diboson
+ single top t t Z+jets W+jets
Background Uncertainty Pre-fit Background mono-h Z’-2HDM
= 600 GeV = 1400 GeV, mA
mZ’
= 3.75 fb
Signal
σ
Preliminary ATLAS
= 13 TeV , 79.8 fb-1
s
SR (Resolved) : 0 lepton < 500 GeV
miss
350 GeV < ET
2 b-tags
0
[GeV]
m
jj50 100 150 200 250
Data/SM 0.5
1 1.5 0
Events / 20 GeV
0 10 20 30 40 50 60
Data SM Vh Diboson
+ single top t t Z+jets W+jets
Background Uncertainty Pre-fit Background mono-h Z’-2HDM
= 600 GeV = 1400 GeV, mA
mZ’
= 3.75 fb
Signal
σ
Preliminary ATLAS
= 13 TeV , 79.8 fb-1
s
SR (Merged) : 0 lepton > 500 GeV
miss
ET
2 b-tags
0
[GeV]
m
J50 100 150 200 250
Data/SM 0.5
1 1.5
0
Figure 6: Distributions of the invariant mass of the Higgs boson candidates m h = m j j , m J with two b -tagged jets in the SR for the four E miss
T categories that are used as inputs to the fit. The upper panels show a comparison of data to the SM expectation before (dashed lines) and after the fit (solid histograms) with no signal included. The lower panels display the ratio of data to SM expectations after the background-only fit, with its systematic uncertainty considering correlations between individual contributions indicated by the hatched band. The expected signal from a representative Z 0 -2HDM model is also shown (long-dashed line), and it is scaled up by a factor of 1000 and 100 for the lowest two E miss
T bins [ 150 GeV , 200 GeV ) and [ 200 GeV , 350 GeV ) , respectively.
Events / bin
1 10 10 2
10 3
10 4
10 5
10 6
10 7 Data
Z+jets + single top t
t W+jets Diboson SM Vh
Background Uncertainty Pre-fit Background mono-h Z’-2HDM
= 600 GeV = 1400 GeV, m
Am
Z’= 3.75 fb
Signal