ATLAS-CONF-2013-074 18July2013
ATLAS NOTE
ATLAS-CONF-2013-074
July 16, 2013
Search for a dijet resonance produced in association with a leptonically decaying W or Z boson with the ATLAS detector at √
s = 8 TeV
The ATLAS Collaboration
Abstract
A search for a dijet resonance with an invariant mass in the range between 130 and 300 GeV is performed in the processes pp
→W j j+X with W
→ℓ±νand pp
→Z j j+X with Z
→ ℓ+ℓ−(ℓ
=e, µ). The data used correspond to 20.3 fb
−1of pp collision data recorded at
√s
=8 TeV with the ATLAS detector at the CERN Large Hadron Collider. The resultsare interpreted in terms of constraints on the Low Scale Technicolor model. No significant deviation from the Standard Model background prediction is observed. Upper limits on the production cross section times branching fraction are set for a hypothetical technipion produced in association with a W or Z boson from the decay of a technirho particle.
c Copyright 2013 CERN for the benefit of the ATLAS Collaboration.
Reproduction of this article or parts of it is allowed as specified in the CC-BY-3.0 license.
1 Introduction
Resonant production of two high transverse momentum (p
T) jets in association with a Standard Model (SM) electroweak gauge boson is an interesting signature to probe the existence of various new physics scenarios beyond the SM, for example extra dimensions, technicolor and little Higgs models. In many cases the V j j state (V denoting a W or Z boson and j a jet) could be produced from the decay of a new massive particle. Resonant diboson (VV) production, e.g. from the decay of a graviton in the scenario of extra dimensions with warped bulk geometry, results in the V j j final state when one of the gauge bosons decays hadronically. In view of the recent discovery of a Higgs particle, the V j j search is also expected to be sensitive to the V H final state, including additional Higgs-like particles in, e.g. two Higgs doublet models.
In this report, a search for resonant dijet production in W j j
→ℓνj j and Z j j
→ℓℓj j (ℓ
=e, µ) events collected with the ATLAS detector at the LHC using pp collision data at
√s
=8 TeV corresponding to an integrated luminosity of 20.3 fb
−1is described. The analysis requires the presence of a leptonically decaying W or Z boson to suppress multijet background.
The Low Scale Technicolor (LSTC) model is used as the benchmark to interpret the analysis result.
In the LSTC model a spin 1 vector particle called technirho (ρ
T) can decay into a lighter technimeson called technipion (π
T) and a SM W or Z boson (depending on the electric charge of the
ρT) if the
ρTmass is larger than the sum of the
πTand gauge boson masses [1, 2]. The CDF collaboration reported [3] a significant excess of events with a dijet invariant mass of about 160 GeV in W
+two jet events recorded in ¯pp collisions at the Fermilab Tevatron. Prompted by this result, similar searches were performed by the D0 collaboration at the Tevatron [4] and the CMS collaboration [5] in pp collisions at
√s
=7 TeV at the CERN Large Hadron Collider, neither of which confirmed the CDF observation. Recently, CDF updated the analysis with the full Tevatron Run II data and reported that the data agrees well with the SM background prediction [6].
2 ATLAS Detector
The ATLAS experiment [7] is a multipurpose particle detector with forward-backward symmetric cylin- drical geometry
acovering the pseudorapidity range
|η| <2.5 for measurement of charged particles and
|η| <
4.9 for all particles except for neutrinos. The inner tracking detector (ID) consists of a silicon pixel detector, a silicon microstrip detector, and a straw-tube transition radiation tracker. The ID is surrounded by a thin superconducting solenoid, providing a 2 T magnetic field, and then by a high- granularity liquid-argon (LAr) sampling electromagnetic (EM) calorimeter. A steel and scintillator tile calorimeter is located outside the LAr EM calorimeter and provides hadronic coverage in the central rapidity range. The end-cap and forward regions are instrumented with LAr calorimetry with copper or tungsten as the absorber for electromagnetic and hadronic measurements. The muon spectrometer (MS) surrounds the calorimeters and consists of three large superconducting toroid systems (each with eight coils) together with multiple layers of trigger and tracking chambers, providing precision track measurement for
|η|<2.7 and triggering for
|η|<2.4.
aATLAS uses a right-handed coordinate system with its origin at the nominal interaction point (IP) in the center of the detector and the z-axis coinciding with the axis of the beam pipe. The x-axis points from the IP to the center of the LHC ring, and they-axis points upward. Cylindrical coordinates (r, φ) are used in the transverse plane,φbeing the azimuthal angle around the beam pipe. The pseudorapidityηis defined in terms of the polar angleθasη=−ln[tan(θ/2)].
3 Data and Simulated Event Samples
The analysis uses 20.3 fb
−1of data collected with the ATLAS detector in pp collisions at
√s
=8 TeV.
Events are selected with single-lepton triggers with two different p
Tthresholds, 24 and 36 GeV for muons, and 24 and 60 GeV for electrons. The lower threshold trigger requires a candidate lepton to be isolated to reduce trigger rates. Inefficiency associated with the isolation requirement is recovered by adding the higher threshold trigger at high p
Twithout isolation requirement. For the Z j j analysis, a logical OR of the single-lepton triggers and dilepton triggers that require the presence of at least two same-flavor leptons with p
Tthresholds of 12 (13) GeV for electrons (muons) is taken to increase signal acceptance. Stringent data quality requirements are imposed.
Signal and most background processes are modelled using Monte Carlo (MC) simulations. The multijet background is estimated directly from data. The LSTC signal events of
ρ±T,0→W
±π0,T∓and
ρ±T →Zπ
±Tare generated using PYTHIA6 [8] with MSTW2008LO [9] for the parton distribution functions (PDFs), and processed with PYTHIA8 [10] by transferring events in Les Houches Event Format [11]
for parton showering and hadronization. This production procedure is used because the LSTC model is not implemented in PYTHIA8. These signal samples are produced for
ρTwith masses between 250 and 500 GeV and
πTbetween 130 and 300 GeV, maintaining the mass relation m
ρT <2m
πT, where m
ρT(m
πT) is the
ρT(π
T) mass, and the branching ratio to W/Zπ
Tis close to 100%. The width of the
ρTis
<1 GeV and therefore negligible compared to the mass resolution (from 20 GeV raising for higher masses).
Among background processes, vector boson production in association with jets (W/Z+jets) represents the dominant contribution to the background. The W/Z+jets events are generated using SHERPA 1.4 [12]
with CT10 [13] PDFs. The cross sections are scaled to the next-to-leading order (NLO) inclusive cross sections. Samples of t¯t events are produced using MC@NLO v3.41 [14, 15] with CT10 [13] PDFs interfaced to HERWIG [16] for parton showering and JIMMY [17] for the underlying event. The cross section is scaled to the approximate next-to-next-to-leading order (NNLO) [18]. Single top events are generated using MC@NLO [19, 20] or AcerMC [21, 22, 23, 24]. Diboson events are generated using HERWIG and normalized to the NLO cross sections computed by MCFM [25].
The response of the ATLAS detector is modelled [26] using either a GEANT4 simulation [27] for background samples or for signal samples, a faster simulation that combines the GEANT4 simulation for the ID tracking and muon reconstruction with a fast simulation of calorimeter shower development. For both detector simulations the MC samples are processed using the same reconstruction chain as used for collision data. The simulated samples include a realistic modelling of the pile-up conditions observed in the data.
4 Event Selection
Events selected by the triggers described in Sec. 3 are required to contain a primary pp collision vertex reconstructed from at least three charged-particle tracks, each with p
T >400 MeV. In events where multiple vertices are reconstructed, the vertex with the largest
Σp2Tof the associated tracks is defined as the primary vertex.
Electron candidates are formed by matching electromagnetic calorimeter energy clusters to tracks
reconstructed in the inner detector [28]. Tighter matching criteria are used for electrons in the W j j
channel than the Z j j channel to reduce background from jets faking electrons. The transverse energy
(E
T), calculated from the cluster energy and the track direction, must be greater than certain thresholds
chosen separately for the V j j channels and the leading/sub-leading leptons in the Z j j channel as de-
scribed below. Candidates are accepted if they lie in the region
|η|<2.47, excluding the transition region
(1.37
< |η| <1.52) between the barrel and endcap electromagnetic calorimeters. The longitudinal and
transverse shapes of the energy cluster must be consistent with those of an electromagnetic shower. For
the electron-candidate track, the significance of the transverse impact parameter (d
0) measured relative to the primary vertex must be smaller than 6. The longitudinal impact parameter (z
0), measured along the z direction with respect to the primary vertex, is required not to exceed 1 mm. To ensure that the elec- trons are isolated from hadronic activity in events, both calorimetric and tracking isolation criteria are applied to the candidate electrons. The total calorimeter E
Tin a cone of
∆R=0.2
baround the electron candidate, excluding the E
Tof the candidate itself, must be less than 14% of the electron E
T. The scalar sum of the p
Tof tracks (with p
T >1 GeV) within
∆R =0.2 around the electron candidate is required to be less than 13% of the electron p
Tvalue. The E
Tof the calorimeter isolation cone is corrected for contributions from electron energy leakage and additional energy deposited by pile-up interactions.
Muon candidates are identified [29] by matching tracks reconstructed in the muon spectrometer to tracks reconstructed in the inner detector. Muon candidates must satisfy p
T >p
minTand
|η|<2.4, where p
minTtakes the same threshold values as for the electrons. The muon candidates must be consistent with originating from the primary vertex in order to reject muons from cosmic ray interactions and background from heavy flavor decays. Specifically, the d
0significance and
|z
0|of the muon track are required to be less than 3 and 1 mm, respectively. To reduce misidentification and improve the muon momentum resolution, requirements on the minimum number of hits in the ID detectors are applied to the muon tracks. The selected muons are ensured to be isolated by requiring the scalar sum of p
Tof tracks (total calorimeter E
T) within a cone of
∆R=0.2 around the muon candidate to be less than 15% (14%) of the muon p
T.
Jets are reconstructed from three dimensional topological clusters [30], defined at the electromag- netic energy scale, using the anti-k
talgorithm [31] with a distance parameter R
=0.4. The reconstructed jets are then calibrated by subtracting pile-up contributions to the jet and applying a p
Tand
ηdependent correction factor derived from simulation [32]. The calibrated energy scale corresponds to that for jets reconstructed from the final state particles (including muons from hadron decays) before detector simu- lation. As a last step of the calibration, the jet energy is further corrected based on in-situ measurement to reduce the uncertainty on the jet energy scale.
Jets likely to have been produced in pile-up interactions are identified using the Jet Vertex Fraction (JVF). This variable is defined as the ratio of the scalar sum of p
Tof tracks associated with the jet and originating from the primary vertex to the scalar sum of p
Tof all tracks associated with the jet.
For jets with p
T <50 GeV and
|η| <2.4, a jet is considered likely to have originated from pile-up interactions if the JVF value is less than 0.5. Such jets are rejected. Jets are further required to pass quality criteria to suppress contributions from detector noise and beam related backgrounds, and to lie at a distance
∆R >0.3 from selected electrons to avoid double counting the electron as a jet. Only jets having p
T >25 GeV within the pseudorapidity range
|η|<2.8 are considered.
The missing transverse momentum, E
missT, is estimated from reconstructed electrons with
|η|<2.47, muons with
|η| <2.7, jets with
|η| <4.9, and clusters of energy in the calorimeter not included in reconstructed objects with
|η| <4.5 [33]. The clusters are calibrated to the electromagnetic or hadronic energy scale according to cluster classification. The expected energy deposit of identified muons in the calorimeter is subtracted from the cluster energies.
For the Z j j channel, events are required to contain two same-flavor leptons with E
T(p
T) above 20 and 10 GeV. The two leptons must have opposite charges in the case of muons, but no such requirement is made for electrons due to their higher charge misidentification. The dilepton invariant mass m
ℓℓis required to be within 8 GeV of the Z boson mass:
|m
ℓℓ−m
Z| <8 GeV. For the W j j channel, events containing a lepton with E
T(p
T) above 25 GeV, E
Tmiss>30 GeV, and the candidate W boson transverse mass m
WT =q
2p
ℓTE
missT(1
−cos
∆φ) above 40 GeV are selected, where pℓTis the lepton p
Tand
∆φis the azimuthal opening angle between the lepton and E
missT.
bThe angular distance∆R between reconstructed objects is defined as∆R= p
∆φ2+ ∆η2.
Based on kinematic distributions of signal and backgrounds from MC simulations, the following criteria are chosen to define the signal region:
•
p
ℓν(ℓℓ)T >50 GeV for the W j j (Z j j) channel, where the p
ℓν(ℓℓ)Tis the transverse momentum of the lepton and E
missT(dilepton) system,
•
at least two jets with p
T >30 GeV,
• |∆ηjj| <
1.75 and
|∆φjj| >1.6, where
∆ηjjand
∆φjjare the differences in pseudorapidity and azimuthal angle, respectively, between the two jets
c,
•
115
<m
j j <300 GeV.
After having applied these selections to the data, the dijet resonance signal is looked for in the invariant mass m
j jof the two jets.
5 Background Estimation
The estimation of background contributions is performed using the combination of theoretical predictions and estimation from data. The simulated MC samples and theoretical calculations of the cross sections are used for backgrounds containing prompt leptons from the primary vertex, such as t¯t, single-top and diboson processes. A technique based on fits to kinematic distributions using templates derived from the data is used to estimate the multijet background, in which a jet is misidentified as a lepton. The W
+jets (Z
+jets) process is expected to dominate the data samples in the signal region for the W j j (Z j j) channel. The fits used to estimate the multijet background determine the normalization of W
+jets and Z
+jets contributions simultaneously, assuming that the shapes of kinematic distributions used in the fit are properly modelled by the W/Z
+jets MC samples. This assumption is validated using control regions orthogonal to the signal region.
For the data-driven multijet background determination, the lepton criteria are modified. For the muon channel, the control sample is constructed by inverting the transverse impact parameter requirement to
|
d
0/σ(d0)
| >3. The muon track still must be within 1 mm of the primary vertex in z. This sample is composed of muons that do not originate from the primary vertex, as expected for muons produced from heavy-flavor decays in jets. For the electron channel, the electron identification criteria are loosened and the selected electrons are required to fail the standard, tighter criteria to form the control sample. The kinematic variables used in the fits are chosen to be E
missTin the range of E
missT <200 GeV for the W j j channel, and the dilepton invariant mass m
ℓℓfor the Z j j channel. For each kinematic region, a
χ2fit is performed to the E
missTor m
ℓℓdistribution in data using templates of multijet background constructed from the control sample and other backgrounds obtained from MC simulations, in order to determine the normalizations of multijet and W/Z
+jets backgrounds.
5.1 Control Regions
For W/Z
+jets background modelling, two control regions with different boson p
Tcuts are defined.
W/Z Inclusive Control Region
The W/Z inclusive control regions are defined requiring at least two jets with p
T >25 GeV and either a W or a Z boson candidate (see Sec. 4). Although they include the signal region, events in these control regions are completely dominated by background events since no p
ℓνTor p
ℓℓTcut is applied. The
cIn the model we are considering the jets from theπTtend to be back-to-back.
[GeV]
mll
40 60 80 100 120 140 160 180 200
Events / 4 GeV
103
104
105
106 Data
W/Z+jets t WW/WZ, t Multijet
L dt = 20.3 fb-1
∫
s = 8 TeVATLAS Preliminary
2 jets
≥ ee +
→ Z
(a) ee j j channel
[GeV]
mll
40 60 80 100 120 140 160 180 200
Events / 4 GeV
103
104
105
106 Data
W/Z+jets t WW/WZ, t Multijet
L dt = 20.3 fb-1
∫
s = 8 TeVATLAS Preliminary
2 jets
≥ µ + µ
→ Z
(b)µµj j channel
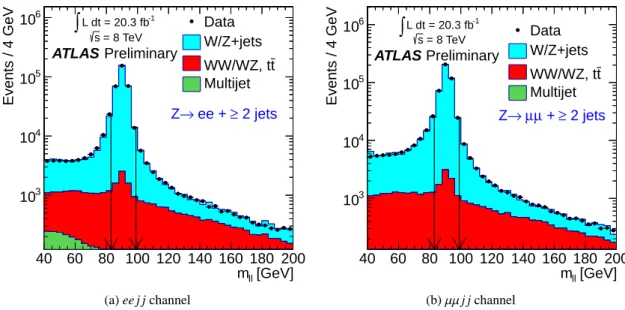
Figure 1: (a) Dielectron and (b) dimuon invariant mass distributions from the data, fitted with the two components of non-multijet background templates obtained from MC simulations and the multijet back- ground template obtained from data using the criteria described in the text, in the Z j j channel. The red arrows show the Z-mass window cuts applied to the m
ℓℓspectra.
signal contamination is expected to be less than 0.1%. For both the W and Z inclusive control regions, the transverse momentum spectrum of gauge bosons reconstructed from the lepton
+E
Tmissor dilepton system is harder in W/Z
+jets MC simulation than in data, which would result in an overestimation of this background at high p
T. To correct for this effect, after subtracting non W/Z
+jets contributions, the ratio of data to MC distributions (electron and muon channels combined) of boson p
Tis fit to a polynominal function to parametrize the p
Tdependence. The parametrized ratio is applied to W/Z
+jets MC events as a function of boson p
Tas an event weight. The systematic uncertainty associated with this event weighting is extracted using different functions to parametrize the ratio, but is found to be negligible in the signal region.
Figure 1 shows the result of a fit to the m
ℓℓdistributions in the inclusive Z
+jets control region (prior to the m
ℓℓmass window requirement). The multijet background in the Z j j channel is negligible after the m
ℓℓwindow cut, and the normalization scale factor for Z
+jets, defined as the ratio of the yield of Z
+jets background that provides a best fit to the nominal yield from theoretical calculation, is found to be 1.05
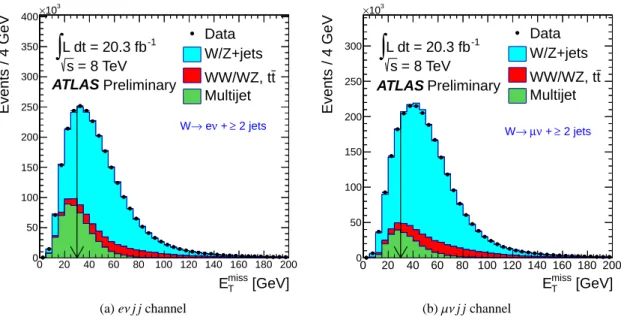
±0.04 for both electron and muon channels. Figure 2 shows the fit to the E
missTspectra for the inclusive W
+jets control regions (prior to the E
Tmisscut). The multijet background is estimated to be about 11% (7%) for the electron (muon) channel at E
Tmiss >30 GeV. A W
+jets normalization scale factor of 0.98
±0.03 is obtained.
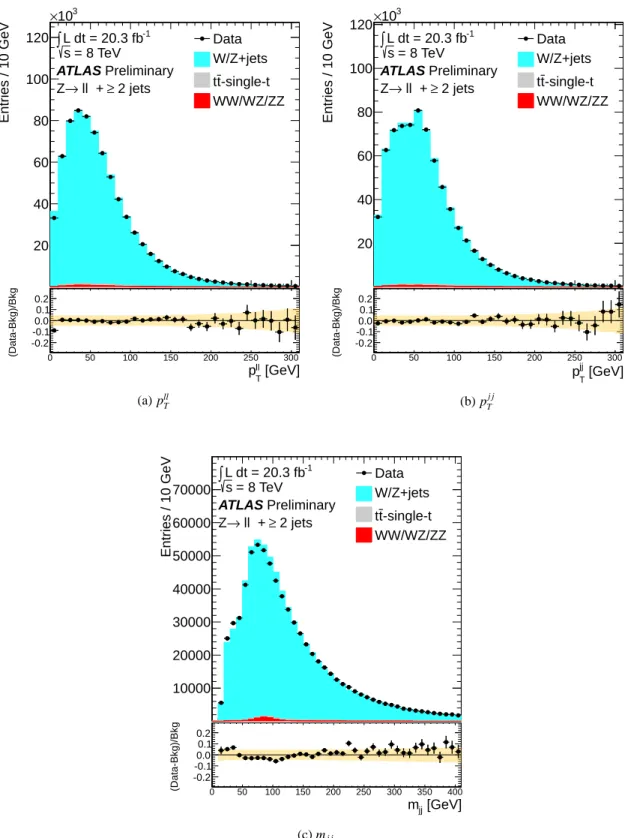
Figures 3 and 4 show the reconstructed boson p
T, dijet system transverse momentum and dijet mass distributions in these control regions after the boson p
Tweighting described above has been applied to the W/Z
+jets MC samples.
W/Z High pTControl Regions
The W/Z high p
Tcontrol regions are defined requiring p
ℓν(ℓℓ)T >50 GeV,
∆φjj>1.6 radian and
∆ηjj<1.5
but excluding the signal region of 115
<m
j j <300 GeV. These control regions are kinematically closer
[GeV]
miss
ET
0 20 40 60 80 100 120 140 160 180 200
Events / 4 GeV
0 50 100 150 200 250 300 350 400
103
×
Data W/Z+jets
t WW/WZ, t Multijet L dt = 20.3 fb-1
∫
s = 8 TeV ATLAS Preliminary2 jets
≥ ν +
→ e W
(a) eνj j channel
[GeV]
miss
ET
0 20 40 60 80 100 120 140 160 180 200
Events / 4 GeV
0 50 100 150 200 250 300
103
×
Data W/Z+jets
t WW/WZ, t Multijet L dt = 20.3 fb-1
∫
s = 8 TeV ATLAS Preliminary2 jets
≥ ν + µ
→ W
(b)µνj j channel
Figure 2: E
missTdistributions from the data, fitted with the two components of non-multijet background templates obtained from MC simulations and the multijet background template obtained from data using the criteria described in the text, in the W j j channel for (a) W
→eν and (b) W
→µν. The red arrowsshow the E
Tmisscut applied to the spectra.
to the signal region and therefore more relevant to background modelling for a boosted W/Z boson with recoiling hadronic jets. The boson p
Tweighting derived above is applied to the W/Z
+jets MC samples in these control regions and other control regions described below. Good agreement is found between data and the expectation in all the main kinematic distributions. Since the cut of p
ℓν(ℓℓ)T >50 GeV is applied, it is checked that the m
j jshape does not significantly change in p
Tregions around the cut and therefore any residual mismodelling in p
ℓν(ℓℓ)Tdoes not bias the m
j jdistribution.
t¯t Control Region
The t¯t control sample is defined by events which contain a single lepton satisfying the criteria for the W j j channel and at least four jets with p
T >25 GeV. This control region is defined only for the W j j channel as the t¯t background is negligible in the Z j j channel. Good agreement is observed between data and the expectation for all the main kinematic variables.
Multijet Control Region
The multijet control region is defined as a sample of events selected with the criteria of
≥2 jets with p
T >25 GeV, E
missT <25 GeV and m
WT >10 GeV. This control region is defined only for the W j j channel as the multijet background is negligible in the Z j j channel. This region is used to extract both normalization and shape uncertainties on the multijet template used in the final fit, as described in Sec. 6.
6 Systematic Uncertainties
The effect of systematic uncertainties on both the normalization and the shape of the dijet invariant mass
distributions is considered. For each signal or background systematic uncertainty source, a template is
0 50 100 150 200 250 300
Entries / 10 GeV
100 200 300 400 500 600
103
×
Data W/Z+jets Multijet
+single-t t t
WW/WZ/ZZ L dt = 20.3 fb-1
∫s = 8 TeV
2 jets
≥ ν +
→ l W
ATLAS Preliminary
[GeV]
ν l
pT
0 50 100 150 200 250 300
(Data-Bkg)/Bkg
-0.2 -0.1 0.0 0.1 0.2
(a) pℓνT
0 50 100 150 200 250 300
Entries / 10 GeV
100 200 300 400 500 600
103
×
Data W/Z+jets Multijet
+single-t t t
WW/WZ/ZZ L dt = 20.3 fb-1
∫s = 8 TeV
2 jets
≥ ν +
→ l W
ATLAS Preliminary
[GeV]
jj
pT
0 50 100 150 200 250 300
(Data-Bkg)/Bkg
-0.2 -0.1 0.0 0.1 0.2
(b) pTj j
0 50 100 150 200 250 300 350 400
Entries / 10 GeV
50 100 150 200 250 300 350 400
103
×
Data W/Z+jets Multijet
+single-t t t
WW/WZ/ZZ L dt = 20.3 fb-1
∫s = 8 TeV
2 jets
≥ ν +
→ l W
ATLAS Preliminary
[GeV]
mjj
0 50 100 150 200 250 300 350 400
(Data-Bkg)/Bkg
-0.2 -0.1 0.0 0.1 0.2
(c) mj j
Figure 3: (a) Reweighted p
ℓνT, (b) p
Tj jand (c ) m
jjdistributions for the inclusive W
+jets control region,
defined by requiring a W boson candidate and at least 2 jets with p
T >25 GeV. The uncertainty band
includes the statistical uncertainty on the MC and the JES uncertainty.
0 50 100 150 200 250 300
Entries / 10 GeV
20 40 60 80 100 120
103
×
Data W/Z+jets
-single-t t t
WW/WZ/ZZ L dt = 20.3 fb-1
∫s = 8 TeV
2 jets
≥ ll +
→ Z
ATLAS Preliminary
[GeV]
ll
pT
0 50 100 150 200 250 300
(Data-Bkg)/Bkg
-0.2 -0.1 0.0 0.1 0.2
(a) pllT
0 50 100 150 200 250 300
Entries / 10 GeV
20 40 60 80 100 120
103
×
Data W/Z+jets
-single-t t t
WW/WZ/ZZ L dt = 20.3 fb-1
∫s = 8 TeV
2 jets
≥ ll +
→ Z
ATLAS Preliminary
[GeV]
jj
pT
0 50 100 150 200 250 300
(Data-Bkg)/Bkg
-0.2 -0.1 0.0 0.1 0.2
(b) pTj j
0 50 100 150 200 250 300 350 400
Entries / 10 GeV
10000 20000 30000 40000 50000 60000 70000
Data W/Z+jets
-single-t t t
WW/WZ/ZZ L dt = 20.3 fb-1
∫s = 8 TeV
2 jets
≥ ll +
→ Z
ATLAS Preliminary
[GeV]
mjj
0 50 100 150 200 250 300 350 400
(Data-Bkg)/Bkg
-0.2 -0.1 0.0 0.1 0.2
(c) mj j
Figure 4: (a) Reweighted p
llT, (b) p
Tj jand (c) m
jjdistributions for the Z
+jets inclusive control region,
defined by requiring a Z boson and at least 2 jets with p
T >25 GeV. The uncertainty band includes the
statistical uncertainty on the MC and the JES uncertainty.
obtained for the m
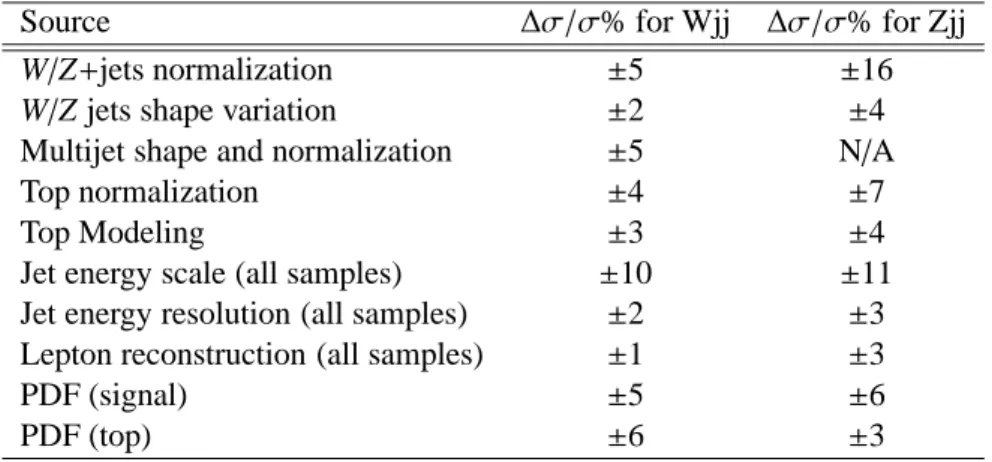
j jdistribution. These templates are used in the statistical analysis fit described in Sec. 7. Systematic effects from the following sources are taken into account: background normalization, MC generator dependence, background modelling. The latter includes PDF choice, luminosity and object modelling such as jet energy scale and resolution, lepton trigger and reconstruction efficiencies and energy scale. Table 1 shows the summary of the systematic uncertainties.
Background Normalization
The W/Z
+jets cross section is assigned an uncertainty of 20% [34]. The uncertainty is larger than the uncertainty for the inclusive W/Z cross section since most of the background from this process is composed of W/Z boson plus two or three jets events that are subject to larger cross section uncertainties.
The combined t¯t and single top cross section is assigned an uncertainty of 10% [35]. The diboson processes WW, WZ and ZZ are assigned a theoretical uncertainty of 5%.
MC Generator
The systematic uncertainty due to modelling the production of W/Z
+jets events is estimated by taking the difference between the SHERPA and ALPGEN predictions. Systematic uncertainties arising from the modelling of the t¯t process are accounted for by comparing the MC@NLO and POWHEG predictions.
The uncertainty on the t¯t background acceptance due to PDFs is computed using the CT10 eigenvectors and the difference between the CT10 and MSTW2008NLO [9] PDF sets and is 7%. Similarly, the signal acceptance uncertainty is considered by taking the difference between CTEQ6L1 and MSTW2008LO PDF sets and amounts to 5%. The PDF uncertainty on W/Z+jets is accounted for since the two generators used (Alpgen and Sherpa) also use different PDFs.
Object Modelling
The systematic uncertainty from the reconstruction and energy calibration of jets, electrons and muons is propagated through the analysis. The main uncertainty arises from the jet energy scale. The jet energy scale is determined from a combination of test beam, simulation, and in-situ measurements [32]. The jet energy scale uncertainty is split into several independent components: calorimeter response, presence of close-by jets, different quark/gluon composition and response, the b-jet energy scale, impact from in-time and out-of-time event pile-up, and forward jet response. The jet energy scale uncertainty for jets with p
T>25 GeV and
|η|<4.5 varies between 1% and 10% depending on jet p
Tand
η. The variations of jetenergy scale and resolution are also propagated to the missing transverse momentum. For electrons and muons, the efficiencies for reconstruction and for the isolation and impact-parameter requirements are studied with W, Z and J/ψ events in data. Differences between data and simulated samples are corrected for in the analysis as scaling factors applied to simulations. The uncertainty on the scaling factors is used to evaluate the systematic uncertainties.
Multijet Background
The systematic uncertainty on the shape and normalization of the multijet background in the W j j channel
is determined from the multijet control region. The differences in event yields and shape of distributions
between the data and MC prediction in the control region are taken as systematic uncertainties. The
uncertainty on the yield amounts to 30%.
Source
∆σ/σ% for Wjj ∆σ/σ% for ZjjW
/Z+jets normalization ±5
±16
W
/Z jets shape variation ±2
±4
Multijet shape and normalization
±5 N/A
Top normalization
±4
±7
Top Modeling
±3
±4
Jet energy scale (all samples)
±10
±11
Jet energy resolution (all samples)
±2
±3 Lepton reconstruction (all samples)
±1
±3
PDF (signal)
±5
±6
PDF (top)
±6
±3
Table 1: Relative statistical and systematic uncertainty contributions (in %) to the total uncertainty on one signal mass point with
πT=180 GeV. Some of the systematic have been combined.Luminosity
The uncertainty on the integrated luminosity is 2.8%. It is derived, following the methodology of Ref. [36]. It uses a preliminary calibration of the luminosity scale derived from beam-separation scans performed in November 2012.
7 Results
The dijet resonance signal is searched for by performing binned maximum likelihood fits to the m
j jdistributions in the signal region. The fits use templates derived from MC simulations for the signal and backgrounds except the multijet background for which the data-driven estimate is used. For both the W j j and Z j j channels, the fit is performed simultaneously in the electron and muon channels. Four components are considered in the fit for the W j j channel : signal, W/Z
+jets, top (t¯t
+single top) and multijet backgrounds. For the Z j j channel the multijet background is negligible and therefore is not included in the fit.
The binned likelihood function of (µ, θ) is constructed as the product of Poisson probability terms for each category. A signal strength parameter,
µ, multiplies the expected LSTC production cross sectionin each bin. The dependence of the signal and background predictions on the systematic uncertainties is described by nuisance parameters,
θ, which are parametrized by Gaussian or log-normal priors. Theexpected number of signal and background events in each bin are functions of
θ. Some of systematicuncertainties, such as the shapes of V+jets, t¯t and multijet backgrounds and the multijet rate, are not allowed to vary in the fit. The effect for those is evaluated generating pseudo experiments based on randomly drawn values of the systematic in question (between
+1σand -1σ).
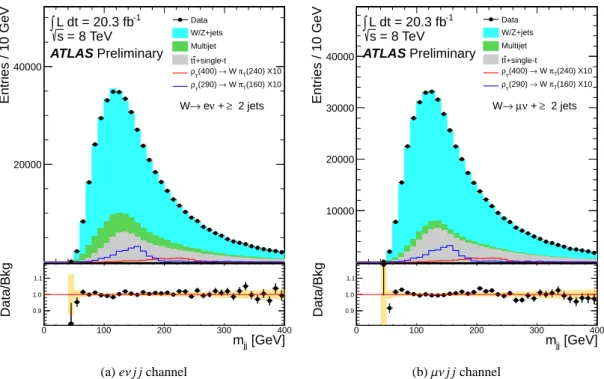
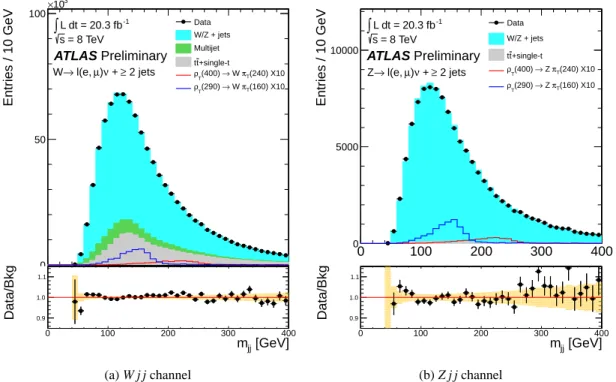
The observed data and the background expectation are in good agreement. Figures 5 and 6 show the fit results in the W j j and Z j j channels, respectively. The electron and muon channel combined plots are shown in Fig. 7. All fitted nuisance parameters are found to have values within the 1σ interval defined by the original uncertainties assigned to the different systematic sources. The nuisance parameters corre- sponding to the normalizations of V
+jets and t¯t are significantly constrained by the fit as expected fromthe use of the full m
jjspectra in the available data. The smallest p-values are 0.03 and 0.08 for m
πT =240 GeV and m
πT =300 GeV, for the
ℓνj j and
ℓℓj j final state respectively.
In the absence of any significant data excess, limits are set on the LSTC technirho production
cross section times branching fraction into a vector boson and technipion using the CLs method. This
0 100 200 300 400
Entries / 10 GeV
20000 40000
Data W/Z+jets Multijet
+single-t t t
(240) X10 πT
→ W (400) ρT
(160) X10 πT
→ W (290) ρT
L dt = 20.3 fb-1
∫s = 8 TeV
2 jets
≥ ν +
→ e W
ATLAS Preliminary
[GeV]
mjj
0 100 200 300 400
Data/Bkg 0.9
1.0 1.1
(a) eνj j channel
0 100 200 300 400
Entries / 10 GeV
10000 20000 30000 40000
Data W/Z+jets Multijet
+single-t t t
(240) X10 πT
→ W (400) ρT
(160) X10 πT
→ W (290) ρT
L dt = 20.3 fb-1
∫s = 8 TeV
2 jets
≥ ν + µ
→ W
ATLAS Preliminary
[GeV]
mjj
0 100 200 300 400
Data/Bkg 0.9
1.0 1.1
(b)µνj j channel
Figure 5: Fit to the dijet mass distribution of the expected background in the signal region for the W j j channel with (a) W
→eν and (b) W
→µν. The bottom part of the figure shows the ratio of data to fit result.
method employs a log-likelihood ratio LLR
=2 ln(L
s+b/Lb) as test-statistic, where L
s+b(L
b) is a binned likelihood function formed as a product of Poisson probabilities to observe the data under the sig- nal+background (background-only) hypothesis. Pseudo-experiments are generated for both hypotheses, taking into account per-bin statistical fluctuations that follow Poisson statistics and systematic uncertain- ties sampled using Gaussian or log-normal distributions for the backgrounds and signal.
Figure 8 shows expected and observed 95% confidence level (CL) cross section upper limits as a function of the technipion mass. For the W j j channel, observed and expected lower mass limits for the charged technipion are 180 and 190 GeV respectively. These can be translated into limits on the cross section times branching ratio assuming the mass relation of m
ρT =3/2
∗m
πT +55 GeV. For the Z j j channel we see an observed lower mass limit for the neutral technipion of 170 GeV while we did not expect to exclude any mass point. The signal selection efficiencies for each of the technipion mass points are given in Table 2 for the W j j selections to
ρT →Wπ
Tand in Table 3 for the Z j j selections for
ρT→Zπ
T.
8 Conclusion
A data-set of 20.3 fb
−1of pp collision data, collected at
√s
=8 TeV using the ATLAS detector, has
been analysed to search for a dijet resonance produced in association with a W or Z boson decaying
leptonically. No significant deviation from the Standard Model background prediction is observed in the
m
j jspectra in W/Z
+≥2 jets events. From the results, 95% confidence level upper limits are set on the
cross section times branching fractions for the technirho decaying into a SM gauge boson and a
technipion, as predicted in the Low Scale Technicolor model. This translates into an observed lower
0 100 200 300 400
Entries / 10 GeV
0 2000 4000
Data W/Z + jets
+single-t t t
(240) X10 πT
→ Z (400) ρT
(160) X10 πT
→ Z (290) ρT
L dt = 20.3 fb-1
∫s = 8 TeV
2 jets
≥ ee +
→ Z
ATLAS Preliminary
[GeV]
mjj
0 100 200 300 400
Data/Bkg 0.9
1.0 1.1
(a) ee j j channel
0 100 200 300 400
Entries / 10 GeV
0 2000 4000 6000
Data W/Z + jets
+single-t t t
(240) X10 πT
→ Z (400) ρT
(160) X10 πT
→ Z (290) ρT
L dt = 20.3 fb-1
∫s = 8 TeV
2 jets
≥ µ + µ
→ Z
ATLAS Preliminary
[GeV]
mjj
0 100 200 300 400
Data/Bkg 0.9
1.0 1.1
(b)µµj j channel
Figure 6: Fit to the dijet mass distribution of the expected background in the signal region for the Z j j channel for (a) Z
→ee and (b) Z
→µµ. The bottom part of the figure shows the ratio of data to fit resultwith no signal.
Table 2: W j j efficiency times acceptance for the LSTC
ρT →Wπ
Tsignal with the
π±Tmass ranging from 130 GeV to 300 GeV. Last two columns show expected and observed upper limit on cross section times branching ratio.
ρT
mass [GeV]
πTmass [GeV]
ǫ×A Expected Upper limit [pb] Observed [pb]
250 130 0.063
±0.002 2.89
±0.28 2.41
270 145 0.085
±0.002 1.93
±0.28 1.92
290 160 0.100
±0.002 1.56
±0.30 1.40
330 180 0.125
±0.002 1.07
±0.32 1.15
400 240 0.162
±0.00 3 0.63
±0.45 1.16
500 300 0.192
±0.003 0.44
±0.51 0.47
0 100 200 300 400
Entries / 10 GeV
0 50 100
103
×
Data W/Z + jets Multijet
+single-t t t
(240) X10 πT
→ W (400) ρT
(160) X10 πT
→ W (290) ρT
L dt = 20.3 fb-1
∫s = 8 TeV
ATLAS Preliminary
2 jets
≥ ν + µ) l(e,
→ W
[GeV]
mjj
0 100 200 300 400
Data/Bkg 0.9
1.0 1.1
(a) W j j channel
0 100 200 300 400
Entries / 10 GeV
0 5000 10000
Data W/Z + jets
+single-t t t
(240) X10 πT
→ Z (400) ρT
(160) X10 πT
→ Z (290) ρT
L dt = 20.3 fb-1
∫s = 8 TeV
ATLAS Preliminary
2 jets
≥ ν + µ) l(e,
→ Z
[GeV]
mjj
0 100 200 300 400
Data/Bkg 0.9
1.0 1.1
(b) Z j j channel
Figure 7: Dijet mass distribution combined for the electron and muon channel for the (a) W j j channel and (b) Z j j after fit of the expected background. The bottom part of the figure shows the ratio of data to fit result.
[GeV]
πT
M
150 200 250 300
BR [pb]×σ
0 2 4 6
L dt = 20.3 fb-1
∫ = 8 TeV s
ATLAS Preliminary
+55 GeV
πT
=3/2*m
ρT
assuming m
± 0,
πT
→ W
±,0
ρT
LSTC
Observed 95% Upper Limit Expected 95% Upper Limit +1 Sigma Uncertainty +2 Sigma Uncertainty
(a) W j j channel
[GeV]
πT
M
150 200 250 300
BR [pb]×σ
0 0.2 0.4 0.6 0.8 1
L dt = 20.3 fb-1
∫s = 8 TeV
ATLAS Preliminary
+55 GeV πT
=3/2*m ρT
assuming m
± πT
→ Z
± ρT LSTC
Observed 95% Upper Limit Expected 95% Upper Limit +1 Sigma Uncertainty +2 Sigma Uncertainty
(b) Z j j channel
Figure 8: Observed and expected 95% CL upper limits on the Vπ
Tcross section as a function of the
mass of the technipion for (a) V
=W in the W j j channel and (b) V
=Z in the Z j j channel. The LSTC
predictions for the
ρTcross section (assuming the mass relation of m
ρT =3/2
∗m
πT +55 GeV) are
also shown in blue. The inner and outer bands on the expected limit represent
±1σ and
±2σ variations,
respectively.
Table 3: Z j j efficiency times acceptance for the LSTC
ρT →Z
πTsignal with the
π0Tmass ranging from 130 GeV to 300 GeV. Last two columns show expected and observed upper limit on cross section times branching ratio.
ρT
mass [GeV]
πTmass [GeV]
ǫ×A Expected Upper limit [pb] Observed [pb]
250 130 0.119
±0.002 0.33
±0.32 0.23
270 145 0.164
±0.003 0.25
±0.33 0.19
290 160 0.197
±0.003 0.19
±0.44 0.14
330 180 0.233
±0.003 0.16
±0.50 0.13
400 240 0.279
±0.004 0.10
±0.68 0.10
500 300 0.321
±0.004 0.06
±0.81 0.09
mass limit of 180 GeV (170 GeV for Z j j) for the technipion at 95% confidence under the assumption of m
ρT =3/2
∗m
πT +55 GeV.
References
[1] E. Eichten, K. Lane, and A. Martin, Technicolor Explanation for the CDF W
j jExcess, Phys.Rev.Lett. 106 (2011) 251803, arXiv:1104.0976 [hep-ph].
[2] E. Eichten, K. Lane, A. Martin, and E. Pilon, Testing the Technicolor Interpretation of the CDF Dijet Excess at the 8-TeV LHC, Phys.Rev. D86 (2012) 074015, arXiv:1206.0186 [hep-ph].
[3] T. Aaltonen et al., CDF Collaboration, Invariant Mass Distribution of Jet Pairs Produced in Association with a W boson in p ¯p Collisions at
√s
=1.96 TeV,
Phys. Rev. Lett. 106 (2011) 171801, arXiv:1104.0699 [hep-ex].
[4] V. Abazov et al. , D0 Collaboration, Bounds on an anomalous dijet resonance in W+jets production in p ¯p collisions at
√s
=1.96 TeV, Phys.Rev.Lett. 107 (2011) 011804, arXiv:1106.1921 [hep-ex].
[5] CMS Collaboration, Study of the dijet mass spectrum in pp
→W+ jets events at
√s
=7 TeV, Phys.Rev.Lett. 109 (2012) 251801, arXiv:1208.3477 [hep-ex].
[6] T. Aaltonen et al., CDF Collaboration, “Invariant Mass Distribution of Jet Pairs Produced in Association with a W boson in p ¯p Collisions at
√s
=1.96 TeV.” CDF Public Note 10973, http://www-cdf.fnal.gov/physics/new/hdg/Results_files/results/w2jet_
130222/DijetMassSpectra.pdf, 2013. [2013].
[7] ATLAS Collaboration, The ATLAS Experiment at the CERN Large Hadron Collider, JINST 3 (2008) S08003.
[8] T. Sjostrand, S. Mrenna, and P. Z. Skands, PYTHIA 6.4 Physics and Manual, JHEP 0605 (2006) 026, arXiv:hep-ph/0603175 [hep-ph].
[9] A. Martin, W. Stirling, R. Thorne, and G. Watt, Parton distributions for the LHC, Eur. Phys. J. C
63 (2009) 189,arXiv:0901.0002 [hep-ph].
[10] T. Sjostrand, S. Mrenna, and P. Z. Skands, A Brief Introduction to PYTHIA 8.1,
Comput.Phys.Commun. 178 (2008) 852–867, arXiv:0710.3820 [hep-ph].
[11] J. Alwall, A. Ballestrero, P. Bartalini, S. Belov, E. Boos, et al., A Standard format for Les Houches event files, Comput.Phys.Commun. 176 (2007) 300–304, arXiv:hep-ph/0609017 [hep-ph].
[12] T. Gleisberg, S. Hoeche, F. Krauss, M. Schonherr, S. Schumann, et al., Event generation with SHERPA 1.1, JHEP 0902 (2009) 007, arXiv:0811.4622 [hep-ph].
[13] Lai, H.L. et al, New parton distributions for collider physics, Phys.Rev.D 82 (2010) 074024, arXiv:1007.2241.
[14] S. Frixione and B. R. Webber, Matching NLO QCD computations and parton shower simulations, JHEP 0206 (2002) 029, arXiv:hep-ph/0204244 [hep-ph].
[15] S. Frixione, P. Nason, and C. Oleari, Matching NLO QCD computations with Parton Shower simulations: the POWHEG method, JHEP 0711 (2007) 070, arXiv:0709.2092 [hep-ph].
[16] G. Corcella, I. Knowles, G. Marchesini, S. Moretti, K. Odagiri, P. Richardson, M. Seymour, and B. Webber, HERWIG 6.5, JHEP 0101 (2001) 010, hep-ph/0011363.
[17] J. Butterworth, J. R. Forshaw, and M. Seymour, Multiparton interactions in photoproduction at HERA, Z.Phys. C72 (1996) 637–646, arXiv:hep-ph/9601371.
[18] M. Aliev, H. Lacker, U. Langenfeld, S. Moch, P. Uwer, et al., HATHOR: HAdronic Top and Heavy quarks crOss section calculatoR, Comput.Phys.Commun. 182 (2011) 1034–1046,
arXiv:1007.1327 [hep-ph].
[19] S. Frixione, E. Laenen, P. Motylinski, B. Webber, C. D. White, Single-top hadroproduction in association with a W boson, JHEP0807:029 (2008), arXiv:0805.3067 [hep-ph].
[20] Frixione, S, and Laenen, E. and Motylinski, P. and Webber, B. R., Single-top production in MC@NLO, JHEP 0603 (2006) 092, arXiv:hep-ph/0512250 [hep-ph].
[21] B. P. Kersevan and E. Richter-Was, The Monte Carlo event generator AcerMC versions 2.0 to 3.8 with interfaces to PYTHIA 6.4, HERWIG 6.5 and ARIADNE 4.1,
Comput.Phys.Commun. 184 (2013) 919–985.
[22] N. Kidonakis, Next-to-next-to-leading-order collinear and soft gluon corrections for t-channel single top quark production, Phys.Rev. D83 (2011) 091503, arXiv:1103.2792 [hep-ph].
[23] N. Kidonakis, NNLL resummation for s-channel single top quark production, Phys.Rev. D81 (2010) 054028, arXiv:1001.5034 [hep-ph].
[24] N. Kidonakis, Two-loop soft anomalous dimensions for single top quark associated production with a W
−or H
−, Phys.Rev. D82 (2010) 054018, arXiv:1005.4451 [hep-ph].
[25] J. Campbell, K. Ellis, and C. Williams, Vector boson pair production at the LHC, JHEP 1107 (2011) 018, arXiv:1105.0020 [hep-ph].
[26] ATLAS Collaboration, The ATLAS Simulation Infrastructure, Eur.Phys.J. C70 (2010) 823–874, arXiv:1005.4568 [physics.ins-det].
[27] GEANT4 Collaboration Nucl.Instrum.Meth. A506 (2003) 250–303.
[28] ATLAS Collaboration, Electron performance measurements with the ATLAS detector using the 2010 LHC proton-proton collision data, Eur. Phys. J. C 72 (2012) 1909,
arXiv:1110.3174 [hep-ex].
[29] ATLAS Collaboration, Measurements of the electron and muon inclusive cross-sections in proton-proton collisions at
√s
=7 TeV with the ATLAS detector,
Phys.Lett. B707 (2012) 438–458, arXiv:1109.0525 [hep-ex].
[30] C. Cojocaru et al., Hadronic calibration of the ATLAS liquid argon end-cap calorimeter in the pseudorapidity region 1.6
<|η|<1.8 in beam tests, Nucl.Instrum.Meth. A531 (2004) 481–514, arXiv:physics/0407009 [physics].
[31] M. Cacciari, G. P. Salam, and G. Soyez, The anti-k
tjet clustering algorithm, JHEP 0804 (2008) 063, arXiv:0802.1189 [hep-ph].
[32] ATLAS Collaboration, Jet energy measurement with the ATLAS detector in proton-proton collisions at
√s
=7TeV, Eur.Phys.J. C73 (2013), arXiv:1112.6426 [hep-ex].
[33] ATLAS Collaboration, Performance of Missing Transverse Momentum Reconstruction in Proton-Proton Collisions at 7 TeV with ATLAS, Eur.Phys.J. C72 (2012) 1844,
arXiv:1108.5602 [hep-ex].
[34] ATLAS Collaboration Collaboration, ATLAS Collaboration, Measurement of the production cross section for W
−bosons in association with jets in pp collisions at
√s
=7 TeV with the ATLAS detector, Phys.Lett. B698 (2011) 325–345, arXiv:1012.5382 [hep-ex].
[35] M. Cacciari, M. Czakon, M. Mangano, A. Mitov, and P. Nason, Top-pair production at hadron colliders with next-to-next-to-leading logarithmic soft-gluon resummation,
Phys.Lett. B710 (2012) 612–622, arXiv:1111.5869 [hep-ph].
[36] ATLAS Collaboration, Improved luminosity determination in pp collisions at
√s
=7 TeV using
the ATLAS detector at the LHC, arXiv:1302.4393 [hep-ex].
A Supporting Material
0 50 100 150 200 250 300
Entries / 10 GeV
0 50 100 150 200 250 300
103
×
Data W/Z+jets Multijet
-single-t t t
WW/WZ/ZZ L dt = 20.3 fb-1
∫s = 8 TeV
2 jets
≥ ν +
→ l W
ATLAS Preliminary
[GeV]
ν l
pT
0 50 100 150 200 250 300
(Data-Bkg)/Bkg
-0.2 -0.1 0.0 0.1 0.2
(a) pℓνT
0 50 100 150 200 250 300
Entries / 10 GeV
0 20 40 60 80 100 120 140 160
103
×
Data W/Z+jets Multijet
-single-t t t
WW/WZ/ZZ L dt = 20.3 fb-1
∫s = 8 TeV
2 jets
≥ ν +
→ l W
ATLAS Preliminary
[GeV]
jj
pT
0 50 100 150 200 250 300
(Data-Bkg)/Bkg
-0.2 -0.1 0.0 0.1 0.2
(b) pTj j
0 1 2 3 4 5 6
Entries / 0.1
0 20 40 60 80 100 120 140 160 180
103
×
Data W/Z+jets Multijet
-single-t t t
WW/WZ/ZZ L dt = 20.3 fb-1
∫s = 8 TeV
2 jets
≥ ν +
→ l W
ATLAS Preliminary
Rjj
0 1 2 3 4 5 ∆ 6
(Data-Bkg)/Bkg
-0.2 -0.1 0.0 0.1 0.2
(c)∆Rj j
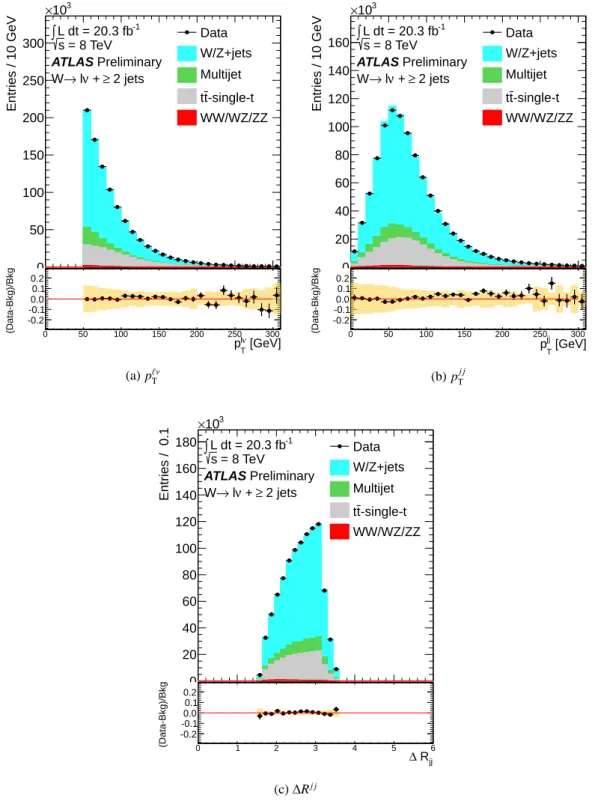
Figure 9: (a) p
ℓνT, (b) p
Tj jand (c)
∆Rjjdistributions in the W j j signal region. The uncertainty band
includes the statistical uncertainty on the MC and the JES uncertainty.
0 50 100 150 200 250 300
Entries / 5 GeV
2000 4000 6000 8000 10000 12000 14000 16000
18000 Data
W/Z+jets -single-t t t
WW/WZ/ZZ L dt = 20.3 fb-1
∫s = 8 TeV
2 jets
≥ ll +
→ Z
ATLAS Preliminary
[GeV]
ll
pT
0 50 100 150 200 250 300
(Data-Bkg)/Bkg
-0.2 -0.1 0.0 0.1 0.2
(a) pℓℓT
0 50 100 150 200 250 300
Entries / 10 GeV
2000 4000 6000 8000 10000 12000 14000 16000 18000 20000
Data W/Z+jets
-single-t t t
WW/WZ/ZZ L dt = 20.3 fb-1
∫s = 8 TeV
2 jets
≥ ll +
→ Z
ATLAS Preliminary
[GeV]
jj
pT
0 50 100 150 200 250 300
(Data-Bkg)/Bkg
-0.2 -0.1 0.0 0.1 0.2
(b) pTj j
0 1 2 3 4 5 6
Entries / 0.1
2000 4000 6000 8000 10000 12000 14000 16000
18000 Data
W/Z+jets -single-t t t
WW/WZ/ZZ L dt = 20.3 fb-1
∫s = 8 TeV
2 jets
≥ ll +
→ Z
ATLAS Preliminary
Rjj
0 1 2 3 4 5 ∆ 6
(Data-Bkg)/Bkg
-0.2 -0.1 0.0 0.1 0.2
(c)∆Rj j