ATLAS-CONF-2016-083 08August2016
ATLAS NOTE
ATLAS-CONF-2016-083
4th August 2016
A Search for Resonances Decaying to a W or Z Boson and a Higgs Boson in the q q ¯ ( 0 ) b b ¯ Final State
The ATLAS Collaboration
Abstract
A search for resonances decaying to a W or Z boson and a Higgs boson in the q q ¯
(0)b b ¯ final state is described. The search uses 13.3 fb
−1of pp collision data at √
s = 13 TeV collected by the ATLAS detector at the CERN Large Hadron Collider in 2015 and 2016. The data are in agreement with the Standard Model background expectation, with the largest excess found at 3 TeV with a local significance of 3.5 σ. The global significance of this excess is
2.5 σ. The results are presented in terms of constraints on a simplified model with a Heavy
Vector Triplet. Upper limits are set on the production cross-section times branching ratio for resonances decaying to a W ( Z) boson and a Higgs boson with values ranging between 0.12 and 0.006 pb (0.26 and 0.008 pb) at 95% confidence level for resonance masses in the range between 1 and 3.5 TeV.
c
2016 CERN for the benefit of the ATLAS Collaboration.
Reproduction of this article or parts of it is allowed as specified in the CC-BY-4.0 license.
1 Introduction
The discovery of the Higgs boson [1, 2] confirms the Standard Model’s (SM) validity in the description of known particle interactions at energies up to a few hundred GeV. However, radiative corrections to the Higgs boson mass drive its value to the model’s validity limit, indicating either extreme fine-tuning or the presence of new physics at an energy scale not far above the Higgs boson mass. It is natural to expect such new physics to manifest itself through significant coupling to the Higgs boson, for example in decays of new particles to a Higgs boson and other SM particles. This Note presents a search for resonances produced in proton-proton collision data at √
s = 13 TeV that decay to a W or Z boson and a Higgs boson. Such resonances are predicted in multiple models of physics beyond the SM, e.g. composite Higgs [3, 4] or Little Higgs [5] models.
This search is conducted in the “all-hadronic” channel, where the W or Z and Higgs bosons decay to quarks. The high mass region, m
VH> 1 TeV (V = W , Z ), where the V and H bosons are highly boosted, is considered. The V and H boson candidates are reconstructed from jets with large radius, using jet substructure techniques and b-tagging to suppress the dominant background from multijet events. The reconstructed V H mass distribution is used to search for a signal and set bounds on the production cross- section times branching fraction for new bosons.
For the interpretation of the results a simplified model [6] is used as a benchmark. This simplified model incorporates a heavy vector triplet (HVT) and allows for the interpretation of the results in a large class of models. The new heavy vector bosons couple to the Higgs boson and SM gauge bosons with coupling strength g
Vc
Hand to the fermions with coupling strength (g
2/g
V) c
F, where g is the SM SU(2)
Lcoupling constant. The parameter g
Vrepresents the strength of the new vector bosons’ interaction, and c
Hand c
Fare expected to be of order unity in most models. Two benchmark models are used: in the first, referred to as Model A, the branching fractions to fermions and gauge bosons are comparable, as in some extensions of the SM gauge group [7]. In Model B, fermionic couplings are suppressed, as for example in a composite Higgs model [8]. The regions of HVT parameter space probed correspond to the production of resonances with an intrinsic width that is narrow relative to the experimental resolution. The latter is roughly 8% of the resonance mass. The sensitivity of the analysis to wider resonances is not tested.
Previous searches for V H resonances V
0have most recently been performed by the ATLAS and CMS collaborations. The ATLAS searches based on data collected at √
s = 8 TeV set a lower limit at the 95%
confidence level (CL) on the W
0( Z
0) mass at 1.47 (1.36) TeV in HVT benchmark Model A with g
V= 1 [9]. Using the HVT benchmark Model A, the ATLAS search based on data collected at √
s = 13 TeV set a 95% CL lower limit on the W
0(Z
0) mass at 1.75 (1.49) TeV [10]. The CMS Collaboration’s all- hadronic searches, based on HVT benchmark Model B with g
V= 3, exclude heavy resonance masses up to 1.1 TeV (Z
0→ Z H), 1.5 TeV (W
0→ W H ), and 1.7 TeV (combined V
0→ V H ) [11] at the 95% CL.
Using the W
0→ W H → `ν b b ¯ channel CMS excludes masses up to 1.5 TeV in the same context [12].
The CMS Collaboration also carried out a search for a narrow resonance decaying to Z H in the τ
+τ
−b b ¯ final state, setting limits on the Z
0production cross-section [13]. Searches for heavy resonances in HVT models have also been carried out in the W W / W Z / Z Z channels by the ATLAS and CMS experiments at √
s = 13 TeV [14–16].
2 ATLAS detector
The ATLAS detector [17] is a general-purpose particle detector used to investigate a broad range of physics processes. It includes inner tracking devices surrounded by a 2.3 m diameter superconducting solenoid, electromagnetic and hadronic calorimeters and a muon spectrometer with a toroidal magnetic field. The inner detector consists of a high-granularity silicon pixel detector, including the insertable B- layer [18] installed after Run 1 of the LHC, a silicon strip detector, and a straw-tube tracker; it is situated inside a 2 T axial magnetic field and provides precision tracking of charged particles with pseudorapidity
|η | < 2.51. The calorimeter system consists of finely segmented sampling calorimeters using lead/liquid- argon for the detection of electromagnetic (EM) showers up to |η| < 3.2, and copper or tungsten / liquid- argon for hadronic showers for 1.5 < |η | < 4.9. In the central region (|η| < 1.7), an steel / scintillator hadronic calorimeter is used. Outside the calorimeters, the muon system incorporates multiple layers of trigger and tracking chambers within a magnetic field produced by a system of superconducting tor- oids, enabling an independent, precise measurement of muon track momenta for |η | < 2.7. The ATLAS detector has a two-level trigger system to select events for offline analysis [19].
3 Data and Simulation Samples
This analysis uses 13.3 fb
−1of LHC pp collisions at √
s = 13 TeV collected in 2015 and through July of 2016. The data are collected during stable beam conditions with all relevant detector systems functional.
Events are selected using a trigger that requires a single anti-k
tjet with radius parameter R = 1.0 with a transverse energy (E
T) threshold of 360 (420) GeV in 2015 (2016). The trigger requirement is >
99% e ffi cient for events passing the o ffl ine selection of a large-R jet with transverse momentum (p
T)
> 450 GeV.
Signal as well as backgrounds from t¯ t, W/Z + jets, and diboson production are modeled with simulated Monte Carlo (MC) events. While multijet MC events are used as a cross-check, the primary multijet background estimation is performed using data as described in Section 6. The signal is modeled using the Heavy Vector Triplet, V
0, from benchmark Model A with g
V= 1. Results derived from this model can be directly applied to benchmark Model B by rescaling the relevant branching ratios. The signal is generated with Madgraph5_aMC@NLO 2.2.2 [20] interfaced to Pythia 8.186 [21] for parton shower and hadronization, with the NNPDF23 LO parton distribution function (PDF) set [22] and the ATLAS A14 tune [23] for the underlying event. The Higgs boson mass is set to 125.5 GeV, and all Higgs decays to quarks are included in the simulation. The V
0→ V H → q q ¯
(0)q
00q ¯
00signal cross-section in Model A ranges from 97 (180) fb for neutral (charged) resonances with a mass of 1 TeV, down to 0.04 (0.08) fb for neutral (charged) resonances with a mass of 4 TeV.
The t¯ t background samples are generated with P owheg -B ox v2 [24] with the CT10 PDF set [25], inter- faced with P ythia 6.428 [26] with the CTEQ6L1 PDF set [27] and the Perugia 2012 tune for the parton shower [28]. The cross-section of the t¯ t process is normalized to NNLO + NNLL in QCD, as calcu- lated by T op++ 2.0 [29]. The P owheg hdamp parameter [30] is set to the top quark mass, taken to be
1ATLAS uses a right-handed coordinate system with its origin at the nominal interaction point (IP) in the centre of the detector and thez-axis along the beam pipe. The x-axis points from the IP to the centre of the LHC ring, and the y-axis points upward. Cylindrical coordinates (r, φ) are used in the transverse plane,φbeing the azimuthal angle around thez-axis. The pseudorapidity is defined in terms of the polar angleθasη=−ln tan(θ/2). The rapidity is also defined relative to the beam axis asy=12lnE+pz
E−pz
.
m
t= 172.5 GeV. The W + jets and Z + jets background samples are generated with S herpa 2.1 [31] inter- faced with the CT10 PDF set [25]. Matrix elements of up to four extra partons are calculated at leading order in QCD. Only the hadronic decays of the W and Z bosons are included. For studies with simulated multijet events, the MC samples are generated with P ythia 8.186 [21], with the NNPDF23LO PDF [22]
and the ATLAS A14 tune [23].
For all simulated events, except those produced using S herpa , E vt G en v1.2.0 [32] is used to model the properties of bottom and charm hadron decays. The detector response is simulated with Geant 4 [33, 34]
and the events are processed with the same reconstruction software as that used for data. All simulated samples include the e ff ects due to multiple pp interactions per bunch-crossing (pileup), and events are reweighted so that the data and simulated sample instantaneous luminosity profiles match.
4 Event Reconstruction
Collision vertices are reconstructed requiring a minimum of two tracks each with p
T> 0.4 GeV. The primary vertex is chosen to be the vertex with the largest P
p
2T, where the sum extends over all tracks associated with the vertex.
The identification and reconstruction of hadronically decaying vector and Higgs boson candidates is per- formed with the anti-k
tjet clustering algorithm [35] with R parameter set at 1.0. These large-R jets [36]
are reconstructed from locally calibrated topological clusters [37] of calorimeter energy deposits. To mitigate the effects of pileup, the large-R jets are trimmed [38]: the jet constituents are reclustered into subjets using the k
talgorithm with R = 0.2, removing those with p
Tsubjet/p
jetT< 0.05, where p
subjetTis the transverse momentum of the subjet and p
jetTis the transverse momentum of the original large-R jet.
Track jets clustered using the anti-k
talgorithm with R = 0.2 are used to aid the identification of b-hadron candidates from the Higgs decay [39]. Track jets are built from charged particle tracks with p
T> 0.4 GeV and |η | < 2.5 that pass a set of hit and impact parameter criteria to make sure that the tracks originate from the primary vertex, thereby minimizing the impact of pileup. Track jets are associated with large-R jets using ghost association [40]. In this method, the large-R jet algorithm is rerun with both the four-momenta of track jets, modified to have infinitesimally small momentum (the "ghosts"), and all topological energy clusters in the event as potential constituents of jets. As a result, the presence of track jets does not alter the large-R jets already found and their association with specific large-R jets is determined by the jet algorithm. b-hadron identification relies on a multivariate tagging algorithm [41] which combines information from several vertexing and impact parameter tagging algorithms. The vertexing and impact parameter tagging algorithms are applied to a set of tracks with loose impact parameter constraints in a region of interest around each jet axis to enable the reconstruction of the b-hadron decay vertex. The b-tagging requirements result in an e ffi ciency of 77% for track jets containing b-hadrons, and a fake rate of ∼ 2% (∼ 24%) for light-flavored (charm) jets, as determined in a sample of simulated t¯ t events.
Muons are reconstructed by combining tracks in the inner detector and muon system, and are required to satisfy tight muon identification criteria [42]. The four-momentum of the closest muon with p
T> 4 GeV and |η | < 2.5 that is within ∆R = p
∆η
2+ ∆φ
2< 0.2 of a track jet is added to the calorimeter jet four-momentum to partially account for the energy carried by leptons in semileptonic b-hadron decays.
Electrons and muons (leptons) are also used in a “veto" to ensure the orthogonality of the analysis se-
lection with respect to other heavy V H resonance searches in non-fully hadronic final states. Electrons
are reconstructed with the “Loose" likelihood selection [43]. Leptons for the veto are required to have p
T> 7 GeV, |η | < 2.5(2.47) for muons (electrons), and their associated tracks must have | d
0/σ
d0| < 5 and |z
0sin θ | < 0.5 mm, where d
0and z
0are the transverse and longitudinal track impact parameters with respect to the beam line, and σ
d0is the uncertainty on d
0. Leptons are also required to pass an isolation criterion, whereby the ratio of the p
Tsum of all tracks with p
T> 500 MeV (excluding the lepton’s) within a cone around the lepton (with radius dependent on the lepton p
T) to the lepton momentum must be less than a p
T- and |η|-dependent threshold I
0. I
0is defined such that a flat e ffi ciency of 99% as a function of p
Tand | η| is obtained for leptons in events with identified Z → `` candidates, where ` denotes an electron or muon.
The missing transverse momentum ( E ~
Tmiss) is calculated as the negative vectorial sum of the transverse momenta of all the muons, electrons, small-R jets, and any inner-detector tracks from the primary vertex not matched to any of these objects [44]. The magnitude of the E ~
Tmissis denoted by E
Tmiss.
5 Event Selection
Events selected for this analysis must contain at least two large-R jets with |η| < 2.0 and invariant mass m
J> 50 GeV, and exactly zero leptons passing the lepton selection for veto. The (sub)leading (in p
T) large-R jet must have p
T> 450 (250) GeV. The two leading p
Tlarge-R jets are used as the Higgs and vector boson candidates, and the invariant mass of the individual jets is used to determine the boson type;
the large-R jet with the larger invariant mass is assigned as the Higgs candidate jet (H-jet), while the lower invariant mass large-R jet is assigned as the vector boson candidate jet (V -jet). This procedure results in the correct assignment 85% of the time after the jet p
T, η, and mass selection, and 99% of the time after the full signal region selections (described below). Further, the rapidity difference, ∆ y
V H= y
V− y
H, between the H-jet and V -jet is required to satisfy |∆ y
V H| < 1.6, exploiting the more central production of the signal compared to the multijet background. To ensure orthogonality with the Z H resonance search in which the Z boson decays to neutrinos, events are rejected if they have E
Tmiss> 150 GeV and
∆φ( E ~
Tmiss, H-jet) < 120 degrees.
The H-jet is further required to satisfy mass and b-tagging criteria consistent with expectations from a Higgs boson [39]. The H -jet mass, m
J,H, must satisfy 75 GeV < m
J,H< 145 GeV, which is 90% efficient for Higgs boson jets. The number of ghost associated b-tagged track jets is then used to categorize events, and H-jets with either one, or two or more associated b-tagged track jets are used in this analysis. H-jets with one associated b-tagged track jets are not required to have more than one associated track jet. The Higgs tagging e ffi ciency for double- (single-) b-tagged H-jets is ∼ 40% (∼ 75%) for H-jets with p
T' 500 GeV and ∼ 25% (∼ 65%) for H-jets with p
T' 900 GeV [45] 2 .
The V-jet must satisfy mass and substructure criteria consistent with a W- or Z-jet, as described by the medium working point in Reference [46]. The V -jet must have a mass m
J,Vwithin ±15 GeV of 83 (93) GeV to be considered a W (Z) candidate. The jet must also satisfy a p
T-dependent D
2β=1[47, 48] selection which depends on whether the desired boson is a W or a Z , as described in Reference [46]. The V -jet tagging efficiency is ∼ 50%.
Four signal regions (SR) are used in this analysis, which di ff er by the number of b-tagged track jets associated to the H-jet and by whether the V -jet passes a Z -tag or W -tag selection. The “1-tag” and
2In Reference [45],H-jets that pass double-b-tagging are not excluded from the singleb-tag category, as is done in this analysis.
“2-tag” SR require exactly one and at least two b-tagged track jets associated to the H-jet, respectively.
The 2-tag signal regions provide the dominant sensitivity for resonances with masses below ∼ 2.5 TeV.
Above 2.5 TeV the 1-tag regions provide higher sensitivity because the Lorentz boost of the Higgs boson is large enough to merge both b-quarks into a single track jet. Events in which the V -jet passes a Z-tag are denoted as the Z H signal region, while events in which the V -jet passes a W -tag are denoted as the W H signal region. While the 1-tag and 2-tag signal regions are orthogonal regardless of the V -jet tag, the W H and Z H selections are not orthogonal within a given b-tag category.
The final event requirement is that the mass of the candidate resonance, m
VH, built from the sum of the V -jet and H -jet candidate four vectors, must be larger than 1 TeV. The full event selection can be found in Table 1. The expected selection efficiency for both W H and Z H resonances of 2 (3) TeV in the HVT benchmark Model A is ∼ 30% (∼ 15%).
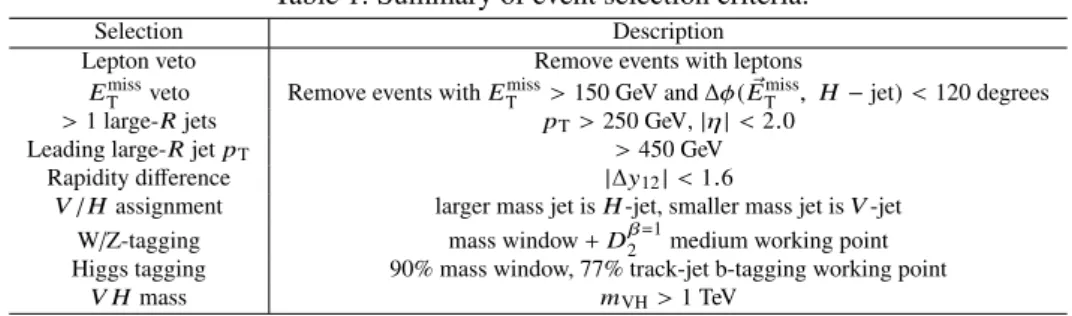
Table 1: Summary of event selection criteria.
Selection Description
Lepton veto Remove events with leptons
ETmissveto Remove events withETmiss>150 GeV and∆φ(E~missT , H−jet)<120 degrees
>1 large-Rjets pT>250 GeV,|η|<2.0
Leading large-RjetpT >450 GeV
Rapidity difference |∆y12|<1.6
V/Hassignment larger mass jet isH-jet, smaller mass jet isV-jet W/Z-tagging mass window+D2β=1medium working point Higgs tagging 90% mass window, 77% track-jet b-tagging working point
V Hmass mVH>1 TeV
6 Background Estimation
After the selection of 1-tag and 2-tag events, ∼ 90% of the background in the signal regions originates from multijet events. The remaining ∼ 10% is predominantly t¯ t with a small contribution from V +jets ( . 1%). The multijet background is modeled directly from data, while other backgrounds are estimated from MC.
Multijet modeling starts from the same trigger and event selection as described above, but the H-jet is required to have zero associated b-tagged track jets. This 0-tag sample, which consists of ∼ 99% multijet events, is used to model the kinematics of the multijet background in the 1-tag and 2-tag SRs. To keep the 0-tag region kinematics close to the 1- and 2-tag regions, H-jets in 0-tag events must contain at least one (two) associated track jets when modeling the 1(2)-tag signal region.
The 0-tag sample is normalized to the 1-tag and 2-tag samples and corrected for kinematic differences between the 0-tag sample and the signal regions. These kinematic di ff erences arise from the b-tagging ef- ficiency variations as a function of p
Tand |η | and because di ff erent multijet processes contribute di ff erent fractions to the 0-, 1-, and 2-tag samples.
The 0-tag sample is normalized to the 1- and 2-tag samples, separately, using a signal-free high mass
sideband of the H-jet defined by 145 GeV < m
J,H< 200 GeV. This sideband (SB) is orthogonal to the
signal region and has similar expected event yield to the signal region. The normalization of the multijet
events is set by scaling the number of events in each region of the 0-tag sample by µ
1(2)−tagMultijet= N
Multijet1(2)−tagN
Multijet0−tag= N
data1(2)−tag− N
t1(2)−tagt¯− N
V1(2)−tag+jetsN
data0−tag− N
t0−tagt¯− N
V0−tag+jets, (1)
where N
data0/1/2−tag, N
0/1/2−tagt¯t
and N
V0/1/2−tag+jetsare the number of events observed in data, and predicted from t t ¯ and V + jets MC in the 0-, 1-, or 2-tag samples, respectively.
Kinematic corrections to the multijet background template are applied by reweighting events in the 0- tag sample. This is done separately for the 1-tag and 2-tag samples. The weights are derived in the sideband region, from third order polynomial fits to the ratio of the total background model to data in the p
Tdistribution of the leading and subleading (in p
T) track jets associated to the H-jet. These distributions are sensitive to kinematic and b-tagging efficiency differences between the 0-tag and 1(2)-tag samples.
The reweighting is performed using 1-D distributions but is iterated so that correlations between the two variables are taken into account. After each reweighting iteration, the value of µ
1(2)−tagMultijetis recomputed to ensure that the normalization is kept fixed.
Due to the small number of events in the background prediction at the m
VHhigh mass tail (above 2 TeV), the background is modeled using a fit between 1.2 and 4 TeV with a power-law function of the form
f ( x) = p
a(1 − x)
pb(x )
pc(2)
where x = m
VH/ √
s, and p
a, p
b, and p
care parameters determined by the fit. This functional form is used as it can model potential changes in the power-law behavior of the background between high and low masses.
The background model is validated in two regions: the signal region-like validation region (VR-SR) in which the V -jet is required to have mass 50 GeV < m
J,V< 70 GeV, and the sideband-like validation region (VR-SB) in which the V -jet is required to have mass 50 GeV < m
J,V< 70 GeV and the H-jet is required to have mass 145 GeV < m
J,H< 200 GeV. Both validation regions are orthogonal, but are kinematically similar, to the signal regions.
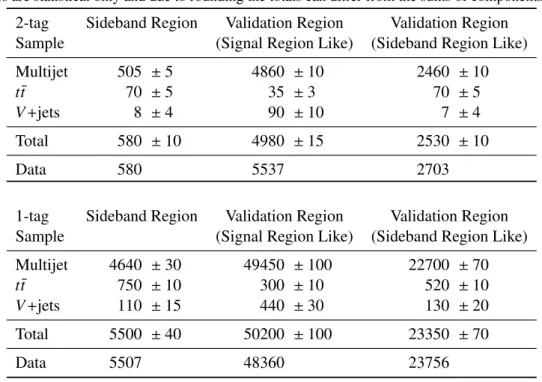
Table 2 compares the observed data yield in the validation regions with the corresponding background estimate. The modeling of the m
V Hdistribution in the signal region-like validation region is shown in Figure 1 for the 1-tag and 2-tag samples. In both cases, the data are well described by the background model in both normalization and m
VHshape. This agreement extends to all other variables.
7 Systematic Uncertainties
Systematic uncertainties in the signal and background predictions arising from experimental and theor- etical sources are considered. These uncertainties include: theoretical uncertainties on the acceptance, uncertainties in the jet energy scale (JES) and resolution (JER), uncertainties on the jet mass scale (JMS) and resolution (JMR), uncertainties in the b-tagging efficiency, and the luminosity uncertainty. The un- certainty on the integrated luminosity is 2.9%, as determined using the methodology described in Refer- ence [49].
The theoretical uncertainties in the signal acceptance take into account factorization and renormalization
scale uncertainties, PDF uncertainties, and modeling of the underlying event, hadronic showers, initial
Table 2: The number of events in data and predicted background events in the sideband and validation regions. The uncertainties are statistical only and due to rounding the totals can differ from the sums of components.
2-tag Sideband Region Validation Region Validation Region Sample (Signal Region Like) (Sideband Region Like)
Multijet 505 ± 5 4860 ± 10 2460 ± 10
t t ¯ 70 ± 5 35 ± 3 70 ± 5
V + jets 8 ± 4 90 ± 10 7 ± 4
Total 580 ± 10 4980 ± 15 2530 ± 10
Data 580 5537 2703
1-tag Sideband Region Validation Region Validation Region Sample (Signal Region Like) (Sideband Region Like)
Multijet 4640 ± 30 49450 ± 100 22700 ± 70
t t ¯ 750 ± 10 300 ± 10 520 ± 10
V + jets 110 ± 15 440 ± 30 130 ± 20
Total 5500 ± 40 50200 ± 100 23350 ± 70
Data 5507 48360 23756
Number of events
−1
10 1 10 102
103
104
105
106
Multijet Other Backgrounds Data Stat. Uncertainty VR-SR, 2-tag
= 13 TeV, 13.3 fb-1 s
ATLAS Preliminary
[GeV]
mVH
1000 1500 2000 2500 3000 3500 4000
Data / Pred. 0.5 1 1.5
Number of events
−1
10 1 10 102
103
104
105
106
107
Multijet Other Backgrounds Data Stat. Uncertainty VR-SR, 1-tag
= 13 TeV, 13.3 fb-1 s
ATLAS Preliminary
[GeV]
mVH
1000 1500 2000 2500 3000 3500 4000
Data / Pred. 0.5 1 1.5
Figure 1: ThemVHdistribution in the signal region-like validation region in the (left) 2-tag (right) 1-tag samples, compared to the predicted background.
and final state radiation. Theoretical uncertainties in the t t ¯ background estimate include uncertainties to account for missing higher order terms in the matrix elements and PDF sets, uncertainties in modeling the hadronic shower and initial and final state radiation, and the uncertainty in the top quark mass. Due to the small contribution of the V + jets backgrounds, their theoretical uncertainties are not considered.
Experimental systematic uncertainties in the signal, as well as the t¯ t and V +jets backgrounds estimated from MC simulation include uncertainties in the JES, JER, JMS, JMR, and b-tagging e ffi ciency. The systematic uncertainties related to the scales of the large-R jet p
T, mass and D
2β=1are derived in situ [50]
and extracted following the technique described in Reference [36], and are of the order of 5%, 6% and 10%, respectively. The resolution of each of these large-R jet observables are evaluated by smearing the jet observable according to the systematic uncertainties of the resolution measurement [36, 46]. For the large-R jet p
Tand mass resolution a 20% uncertainty is assigned, while for the D
2β=1resolution a 10% uncertainty is assigned. The uncertainty in the b-tagging e ffi ciency for track jets is based on the uncertainty in the measured tagging e ffi ciency for b-jets in data following the same methodology as used in Reference [51]. This is measured as a function of b-jet p
Tand ranges between 2 and 12% for track jets with p
T< 250 GeV. For track jets with p
T> 250 GeV the uncertainty in the tagging e ffi ciencies is extrapolated using MC simulation [52] and grows to 20% for track jets with p
T> 600 GeV.
Systematic uncertainties in the normalization and shape of the data-based multijet background model are assessed from the validation regions after the power-law fit. The background predictions in the validation regions agree with the observed data to within ± 4% in the 1-tag sample and ± 11% in the 2-tag sample.
These differences are taken as the uncertainties in the predicted multijet yield.
An additional uncertainty in the shape of the background prediction is assigned by fitting a variety of empirical functions designed to model power-law behavior to the 0-tag m
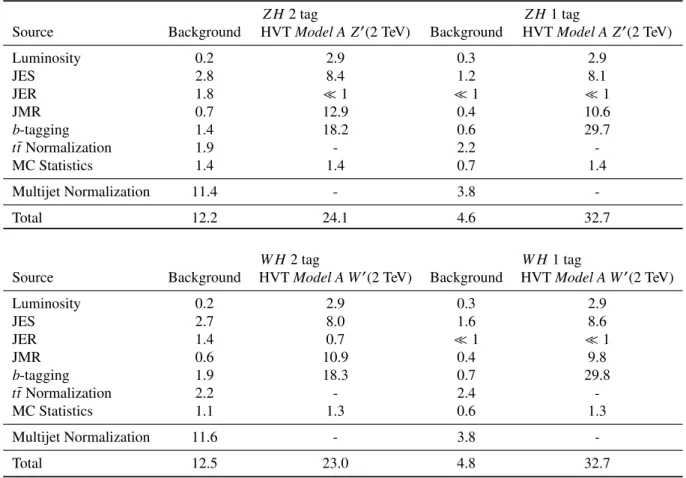
VHdistribution, as described in Reference [53]. The largest di ff erence between the nominal prediction and the alternative fit functions is taken as a systematic uncertainty. Similarly, the fit range of the nominal power-law function is varied, and the largest difference between the nominal prediction and the alternative fit ranges is taken as a systematic uncertainty. The impact of the di ff erent systematic uncertainties is summarized in Table 3.
8 Results
The results are interpreted using the statistical procedure described in Reference [1] and references therein. A test statistic based on the profile likelihood ratio [54] is used to test hypothesized values
of µ, the global signal strength factor, separately for each model tested. The statistical analysis described
below is performed using the m
VHdistribution of the data observed in the signal regions. The system-
atic uncertainties are modeled with Gaussian or log-normal constraint terms (nuisance parameters) in the
definition of the likelihood function. The data distributions from the 1-tag and 2-tag signal regions are
used in the fit simultaneously, treating systematic uncertainties on the luminosity, JES, JER, JMR and
b-tagging as fully correlated between the two signal regions. When performing the fit, the nuisance para-
meters are allowed to vary within their constraints to maximize the likelihood. As a result of the fit, the
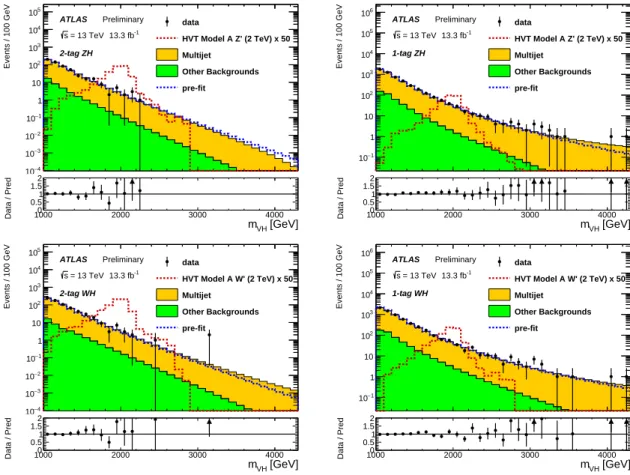
uncertainties on the multijet shape uncertainty are significantly reduced. Fits in the W H and Z H signal
regions are performed separately. The pre- and post-fit m
VHdistributions in the signal regions are shown
in Figure 2.
Table 3: Summary of systematic uncertainties (expressed in percentage yield) in the background and signal event yields in the 1-tag and 2-tag signal regions. The JES, JER, JMR,b-tagging efficiency, luminosity and MC statistics uncertainties do not apply to the multijet contribution, which is determined from data. Uncertainties are provided for a resonance mass of 2 TeV in the context of the HVTModel A, for bothV0 →W HandV0→ Z Hresonances.
Z H2 tag Z H1 tag
Source Background HVTModel A Z0(2 TeV) Background HVTModel A Z0(2 TeV)
Luminosity 0.2 2.9 0.3 2.9
JES 2.8 8.4 1.2 8.1
JER 1.8 1 1 1
JMR 0.7 12.9 0.4 10.6
b-tagging 1.4 18.2 0.6 29.7
t¯tNormalization 1.9 - 2.2 -
MC Statistics 1.4 1.4 0.7 1.4
Multijet Normalization 11.4 - 3.8 -
Total 12.2 24.1 4.6 32.7
W H2 tag W H1 tag
Source Background HVTModel A W0(2 TeV) Background HVTModel A W0(2 TeV)
Luminosity 0.2 2.9 0.3 2.9
JES 2.7 8.0 1.6 8.6
JER 1.4 0.7 1 1
JMR 0.6 10.9 0.4 9.8
b-tagging 1.9 18.3 0.7 29.8
t¯tNormalization 2.2 - 2.4 -
MC Statistics 1.1 1.3 0.6 1.3
Multijet Normalization 11.6 - 3.8 -
Total 12.5 23.0 4.8 32.7
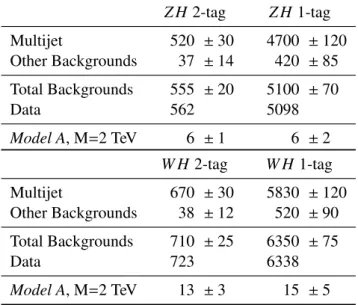
The predicted number of background events in the 1-tag and 2-tag Z H and W H signal regions after the fit, the number of events observed in the data, and the predicted yield for a potential signal are reported in Table 4.
8.1 Statistical Analysis
To determine if there are any statistically significant local excesses in the data, a test of the background- only hypothesis (µ = 0) is done. The significance of an excess is quantified using the local p
0value, the probability that the background could produce a fluctuation greater than or equal to the excess observed in data. A global p
0is also calculated for the most significant discrepancy, using background-only pseudo- experiments to derive a correction for the look-elsewhere effect across the mass range tested [55]. The largest deviation from the background-only hypothesis is in the W H signal region, occurring at m
VH∼ 3.0 TeV with a local significance of 3.5 σ. The global significance of this excess is 2.5 σ. A second excess in the W H signal region, at m
VH∼ 1.6 TeV, has a local significance of 2.6 σ.
The data are used to set upper limits on the cross-sections for the di ff erent benchmark signal processes.
Events / 100 GeV
−4
10
−3
10
−2
10
−1
10 1 10 102
103
104
105
data
HVT Model A Z' (2 TeV) x 50 Multijet
Other Backgrounds pre-fit
ATLAS Preliminary 13.3 fb-1
= 13 TeV s 2-tag ZH
[GeV]
mVH
1000 2000 3000 4000
Data / Pred 00.511.52
Events / 100 GeV
−1
10 1 10 102
103
104
105
106
data
HVT Model A Z' (2 TeV) x 50 Multijet
Other Backgrounds pre-fit
ATLAS Preliminary 13.3 fb-1
= 13 TeV s 1-tag ZH
[GeV]
mVH
1000 2000 3000 4000
Data / Pred 00.511.52
Events / 100 GeV
−4
10
−3
10
−2
10
−1
10 1 10 102
103
104
105
data
HVT Model A W' (2 TeV) x 50 Multijet
Other Backgrounds pre-fit
ATLAS Preliminary 13.3 fb-1
= 13 TeV s 2-tag WH
[GeV]
mVH
1000 2000 3000 4000
Data / Pred 00.51 1.52
Events / 100 GeV
−1
10 1 10 102
103
104
105
106
data
HVT Model A W' (2 TeV) x 50 Multijet
Other Backgrounds pre-fit
ATLAS Preliminary 13.3 fb-1
= 13 TeV s 1-tag WH
[GeV]
mVH
1000 2000 3000 4000
Data / Pred 00.51 1.52
Figure 2: ThemVHdistributions in theV H signal regions for data (points) and background estimate (histograms) after the likelihood fit for events in the (left) 2-tag and (right) 1-tag categories. The pre-fit background expectation is given by the blue dashed line. The expected signal distributions for aV0with 2 TeV mass are also shown.
Exclusion limits are based on the value of the statistic C L
s[56], with a value of µ regarded as excluded at the 95% CL when C L
sis less than 5%.
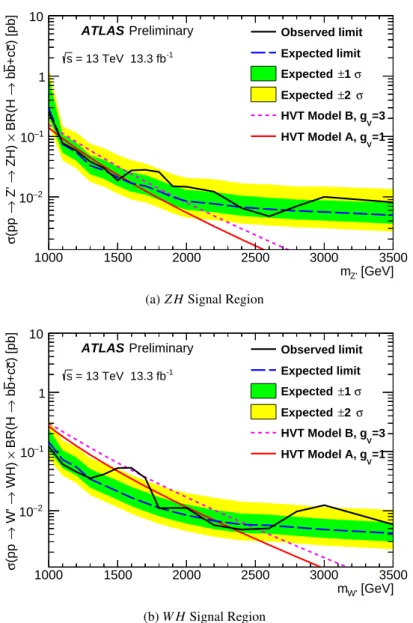
Figure 3 shows the 95% CL upper limits on HVT resonances for both Model A and Model B in the W H and Z H signal regions for masses between 1000 and 3500 GeV. Limits on σ (pp → V
0→ V H → q q ¯
0b b, ¯ c c) are set in the range of 0.12 to 0.006 pb and 0.26 to 0.008 pb in the ¯ W H and Z H signal regions, respectively. These cross-section limits are translated into observed excluded Model B signal mass ranges of 1000 - 1570 GeV and 1680 - 2520 GeV for W H resonances, and 1070 - 1580 GeV for Z H resonances.
The corresponding excluded mass ranges for Model A are 1000 - 1480 GeV and 1750 - 2340 GeV for
W H resonances, and 1090 - 1530 GeV for Z H resonances. In the W H signal region, as opposed to the
p
0values, the limits deviate from the background-only expectation more significantly at m
VH= 1.6 TeV
than m
VH= 3.0 TeV, because the limits test the signal plus background hypothesis, whereas the p
0values
probe the compatibility with the background-only hypothesis.
Table 4: The number of predicted background events in theV H1-tag and 2-tag signal regions after the fit, compared to the data. The "Other Backgrounds" entries include bothtt¯andV+jets. Uncertainties correspond to the total uncertainties in the predicted event yields, and are smaller for the total than for the individual contributions because the latter are anti-correlated. The yields form=2 TeVV0bosons decaying toV H inModel Aare also given. Due to rounding the totals can differ from the sums of components.
Z H 2-tag Z H 1-tag
Multijet 520 ± 30 4700 ± 120
Other Backgrounds 37 ± 14 420 ± 85 Total Backgrounds 555 ± 20 5100 ± 70
Data 562 5098
Model A, M = 2 TeV 6 ± 1 6 ± 2 W H 2-tag W H 1-tag
Multijet 670 ± 30 5830 ± 120
Other Backgrounds 38 ± 12 520 ± 90 Total Backgrounds 710 ± 25 6350 ± 75
Data 723 6338
Model A, M=2 TeV 13 ± 3 15 ± 5
9 Conclusion
A search for resonances decaying to a W or Z boson and a Higgs boson has been carried out in the all-hadronic q q ¯
(0)b b ¯ channel with 13.3 fb
−1of pp collision data collected by ATLAS during the 2015 and through July of the 2016 runs of the LHC at √
s = 13 TeV. Both the vector boson and Higgs boson candidates are reconstructed using large radius jets, and small radius b-tagged track jets are exploited to tag the Higgs boson candidate jet. The background consists mainly of multijet and t¯ t events. The largest excess is observed in the W H channel at m
WH∼ 3.0 TeV with a local significance of 3.5 σ. The global significance of this excess is 2.5 σ. Upper limits on the production cross-section times branching ratio to the q q ¯
(0)b b ¯ final state are set for resonance masses in the range between 1000 and 3500 GeVwith values ranging between 0.12 to 0.006 pb and 0.26 to 0.008 pb (at 95% CL) for W H and Z H resonances, respectively. The corresponding excluded HVT Model B signal mass ranges are 1000 - 1570 GeV and 1680 - 2520 GeV for W H resonances, and 1070 - 1580 GeV for Z H resonances.
References
[1] ATLAS Collaboration, Observation of a new particle in the search for the Standard Model Higgs boson with the ATLAS detector at the LHC, Phys. Lett. B716 (2012) 1,
arXiv: 1207.7214 [hep-ex].
[2] CMS Collaboration,
Observation of a new boson at a mass of 125 GeV with the CMS experiment at the LHC,
Phys. Lett. B 716 (2012) 30, arXiv: 1207.7235 [hep-ex].
[GeV]
mZ'
1000 1500 2000 2500 3000 3500
) [pb]c+cb b→ BR(H × ZH) → Z' →(pp σ
−2
10
−1
10 1 10
Preliminary ATLAS
= 13 TeV 13.3 fb-1
s
Observed limit Expected limit σ
±1 Expected
σ
±2 Expected
V=3 HVT Model B, g
V=1 HVT Model A, g
(a)Z HSignal Region
[GeV]
mW'
1000 1500 2000 2500 3000 3500
) [pb]c+cb b→ BR(H × WH) → W' →(pp σ
−2
10
−1
10 1 10
Preliminary ATLAS
= 13 TeV 13.3 fb-1
s
Observed limit Expected limit σ
±1 Expected
σ
±2 Expected
V=3 HVT Model B, g
V=1 HVT Model A, g
(b)W HSignal Region
Figure 3: The expected and observed upper limits at the 95% confidence level forpp→V0 →V H → qq¯0bb,c¯ c¯ inModel AandModel Bin the (a)Z Hand (b)W Hsignal regions. The red and purple curves show the predicted cross-sections as a function of resonance mass for the models considered.
[3] M. J. Dugan, H. Georgi and D. B. Kaplan, Anatomy of a Composite Higgs Model, Nucl. Phys. B254 (1985) 299.
[4] K. Agashe, R. Contino and A. Pomarol, The Minimal composite Higgs model, Nucl. Phys. B719 (2005) 165, arXiv: hep-ph/0412089 [hep-ph].
[5] M. Schmaltz and D. Tucker-Smith, Little Higgs review, Ann. Rev. Nucl. Part. Sci. 55 (2005) 229, arXiv: hep-ph/0502182 [hep-ph].
[6] D. Pappadopulo et al., Heavy Vector Triplets: Bridging Theory and Data, JHEP 09 (2014) 060,
arXiv: 1402.4431 [hep-ph].
[7] V. D. Barger, W.-Y. Keung and E. Ma, A Gauge Model With Light W and Z Bosons, Phys. Rev. D22 (1980) 727.
[8] R. Contino et al., On the e ff ect of resonances in composite Higgs phenomenology, JHEP 10 (2011) 081, arXiv: 1109.1570 [hep-ph].
[9] ATLAS Collaboration, Search for a new resonance decaying to a W or Z boson and a Higgs boson in the ``/`ν/νν + b b final states with the ATLAS detector, ¯ Eur. Phys. J. C75 (2015) 263, arXiv: 1503.08089 [hep-ex].
[10] ATLAS Collaboration,
Search for a new resonance decaying to a W or Z boson and a Higgs boson in the l
+l
−b b, lνb ¯ b, ¯ and ν νb ¯ b channels with pp collisions at ¯ √
s = 13 TeV with the ATLAS detector, (2016), arXiv: 1607.05621 [hep-ex].
[11] CMS Collaboration, Search for a massive resonance decaying into a Higgs boson and a W or Z boson in hadronic final states in proton-proton collisions at √
s = 8 TeV, JHEP 02 (2016) 145, arXiv: 1506.01443 [hep-ex].
[12] CMS Collaboration,
Search for massive WH resonances decaying into the `νbb final state at √
s = 8 TeV, Eur. Phys. J. C76 (2016) 237, arXiv: 1601.06431 [hep-ex].
[13] CMS Collaboration, Search for Narrow High-Mass Resonances in Proton-Proton Collisions at
√ s = 8 TeV Decaying to a Z and a Higgs Boson, Phys. Lett. B748 (2015) 255, arXiv: 1502.04994 [hep-ex].
[14] ATLAS Collaboration,
Searches for heavy diboson resonances in pp collisions at √
s = 13 TeV with the ATLAS detector, (2016), arXiv: 1606.04833 [hep-ex].
[15] CMS Collaboration,
Search for massive resonances decaying into pairs of boosted W and Z bosons at √
s = 13 TeV, (CMS-PAS-EXO-15-002), url : https://cds.cern.ch/record/2117062.
[16] ATLAS Collaboration, Search for resonances with boson-tagged jets in 3.2 fb
−1of pp collisions at √
s = 13 TeV collected with the ATLAS detector, (ATLAS-CONF-2015-073), url : http://cds.cern.ch/record/2114845.
[17] ATLAS Collaboration, The ATLAS Experiment at the CERN Large Hadron Collider, JINST 3 (2008) S08003.
[18] ATLAS Collaboration, ATLAS Insertable B-Layer Technical Design Report, (ATLAS-TDR-19), url : http://cds.cern.ch/record/1291633, ATLAS Insertable B-Layer Technical Design Report Addendum, (ATLAS-TDR-19-ADD-1),
URL: http://cds.cern.ch/record/1451888.
[19] ATLAS Collaboration, 2015 start-up trigger menu and initial performance assessment of the ATLAS trigger using Run-2 data, (ATL-DAQ-PUB-2016-001),
url : http://cds.cern.ch/record/2136007.
[20] J. Alwall et al., The automated computation of tree-level and next-to-leading order di ff erential cross sections, and their matching to parton shower simulations, JHEP 07 (2014) 079,
arXiv: 1405.0301 [hep-ph].
[21] T. Sjostrand, S. Mrenna and P. Z. Skands, A Brief Introduction to Pythia 8.1,
Comput. Phys. Commun. 178 (2008) 852, arXiv: 0710.3820 [hep-ph].
[22] R. D. Ball et al., Parton distributions with LHC data, Nucl. Phys. B 867 (2013) 244, arXiv: 1207.1303.
[23] ATLAS Collaboration, ATLAS Run 1 Pythia 8 tunes, (ATL-PHYS-PUB-2014-021), url : http://cds.cern.ch/record/1966419.
[24] S. Frixione and B. R. Webber, Matching NLO QCD computations and parton shower simulations, JHEP 0206 (2002) 029, arXiv: hep-ph/0204244 [hep-ph].
[25] H.-L. Lai et al., New parton distributions for collider physics, Phys. Rev. D 82 (2010) 074024, arXiv: 1007.2241.
[26] T. Sjostrand, S. Mrenna and P. Z. Skands, Pythia 6.4 Physics and Manual, JHEP 0605 (2006) 026, arXiv: hep-ph/0603175 [hep-ph].
[27] J. Pumplin et al.,
New generation of parton distributions with uncertainties from global QCD analysis, JHEP 0207 (2002) 012, arXiv: hep-ph/0201195 [hep-ph].
[28] P. Z. Skands, Tuning Monte Carlo Generators: The Perugia Tunes, Phys.Rev. D82 (2010) 074018, arXiv: 1005.3457 [hep-ph].
[29] M. Czakon and A. Mitov,
Top ++ : A Program for the Calculation of the Top-Pair Cross-Section at Hadron Colliders, Compt / Phys. Commun. (2014) 2930, arXiv: 1112.5675 [hep-ph].
[30] ATLAS Collaboration, Comparison of Monte Carlo generator predictions for gap fraction and jet multiplicity observables in top-antitop events, (ATL-PHYS-PUB-2014-005),
url: http://cds.cern.ch/record/1703034.
[31] T. Gleisberg et al., Event generation with SHERPA 1.1, JHEP 0902 (2009) 007, arXiv: 0811.4622 [hep-ph].
[32] D. J. Lange, The EvtGen particle decay simulation package, Nucl. Instrum. Meth. A462 (2001) 152.
[33] S. Agostinelli et al., GEANT4: A Simulation toolkit, Nucl. Instrum. Meth. A 506 (2003) 250.
[34] ATLAS Collaboration, The ATLAS Simulation Infrastructure, Eur. Phys. J. C 70 (2010) 823, arXiv: 1005.4568.
[35] M. Cacciari, G. P. Salam and G. Soyez, The anti-k
tjet clustering algorithm, JHEP 04 (2008) 063, arXiv: 0802.1189.
[36] ATLAS Collaboration, Performance of jet substructure techniques for large-R jets in proton-proton collisions at √
s = 7 TeV using the ATLAS detector, JHEP 09 (2013) 076, arXiv: 1306.4945 [hep-ex].
[37] ATLAS Collaboration,
Topological cell clustering in the ATLAS calorimeters and its performance in LHC Run 1, (2016), arXiv: 1603.02934 [hep-ex].
[38] D. Krohn, J. Thaler and L.-T. Wang, Jet Trimming, JHEP 02 (2010) 084, arXiv: 0912.1342.
[39] ATLAS Collaboration, Expected Performance of Boosted Higgs (→ b b) Boson Identification with ¯ the ATLAS Detector at √
s = 13 TeV, (ATL-PHYS-PUB-2015-035),
url : http://cds.cern.ch/record/2042155.
[40] M. Cacciari and G. P. Salam, Pileup subtraction using jet areas, Phys. Lett. B 659 (2008) 119, arXiv: 0707.1378.
[41] ATLAS Collaboration, Optimisation of the ATLAS b-tagging performance for the 2016 LHC Run, (ATL-PHYS-PUB-2016-012), url : http://cds.cern.ch/record/2160731.
[42] ATLAS Collaboration, Muon reconstruction performance of the ATLAS detector in proton–proton collision data at √
s = 13 TeV, (2016), arXiv: 1603.05598.
[43] ATLAS Collaboration, Electron reconstruction and identification e ffi ciency measurements with the ATLAS detector using the 2011 LHC proton-proton collision data,
Eur. Phys. J. C74 (2014) 2941, arXiv: 1404.2240 [hep-ex].
[44] ATLAS Collaboration, Expected performance of missing transverse momentum reconstruction for the ATLAS detector at √
s = 13 TeV, (ATL-PHYS-PUB-2015-023), url : http://cds.cern.ch/record/2037700.
[45] ATLAS Collaboration,
Boosted Higgs (→ b b) Boson Identification with the ATLAS Detector at ¯ √
s = 13 TeV, (ATLAS-CONF-2016-039), url: http:
//atlas.web.cern.ch/Atlas/GROUPS/PHYSICS/CONFNOTES/ATLAS-CONF-2016-039/.
[46] ATLAS Collaboration, Identification of boosted, hadronically-decaying W and Z bosons in
√ s = 13 TeV Monte Carlo Simulations for ATLAS, (ATL-PHYS-PUB-2015-033), url: http://cds.cern.ch/record/2041461.
[47] A. J. Larkoski, I. Moult and D. Neill, Power Counting to Better Jet Observables, JHEP 12 (2014) 009, arXiv: 1409.6298 [hep-ph].
[48] A. J. Larkoski, I. Moult and D. Neill, Analytic Boosted Boson Discrimination, JHEP 05 (2016) 117, arXiv: 1507.03018 [hep-ph].
[49] ATLAS Collaboration, Improved luminosity determination in pp collisions at √
s = 7 TeV using the ATLAS detector at the LHC, Eur. Phys. J. C 73 (2013) 2518, arXiv: 1302.4393.
[50] ATLAS Collaboration, Measurement of the jet mass scale and resolution uncertainty for large radius jets at √
s = 8 TeV using the ATLAS detector, (ATLAS-CONF-2016-008), url : http://cds.cern.ch/record/2139642.
[51] ATLAS Collaboration, Calibration of b-tagging using dileptonic top pair events in a combinatorial likelihood approach with the ATLAS experiment, (ATLAS-CONF-2014-004), url : http://cds.cern.ch/record/1664335.
[52] ATLAS Collaboration, Performance of b-Jet Identification in the ATLAS Experiment, JINST 11 (2016) P04008, arXiv: 1512.01094.
[53] ATLAS Collaboration, Search for strong gravity in multijet final states produced in pp collisions at √
s = 13 TeV using the ATLAS detector at the LHC, JHEP 03 (2016) 026, arXiv: 1512.02586.
[54] G. Cowan et al., Asymptotic formulae for likelihood-based tests of new physics, Eur. Phys. J. C71 (2011) 1554, [Erratum: Eur. Phys. J.C73,2501(2013)], arXiv: 1007.1727 [physics.data-an].
[55] E. Gross and O. Vitells, Trial factors or the look elsewhere e ff ect in high energy physics, Eur. Phys. J. C 70 (2010) 525, arXiv: 1005.1891.
[56] A. L. Read, Presentation of search results: The CL(s) technique, J. Phys. G 28 (2002) 2693.
Appendix
Resonance Mass [GeV]
1000 1500 2000 2500 3000 3500
Efficiency×Acceptance
0 0.1 0.2 0.3 0.4 0.5 0.6
2-tag SR (WH) 1-tag SR (WH) 2-tag SR (ZH) 1-tag SR (ZH)
ATLAS Simulation Preliminary
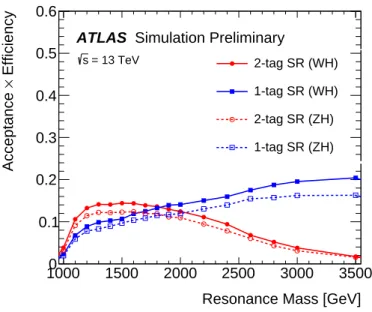
= 13 TeV s
Figure 4: Signal Selection efficiency as a function of resonance mass for the different analysis channels.