Research Collection
Conference Paper
Search for the Higgs boson in the associated vector boson
production mode where the vector boson decays leptonically and the Higgs boson decays to a pair of bottom quarks
Author(s):
Gedia, Krunal Publication Date:
2020-11-12 Permanent Link:
https://doi.org/10.3929/ethz-b-000391212
Originally published in:
PoS: Proceedings of Science 364, http://doi.org/10.22323/1.364.0367
Rights / License:
Creative Commons Attribution-NonCommercial-NoDerivatives 4.0 International
This page was generated automatically upon download from the ETH Zurich Research Collection. For more information please consult the Terms of use.
ETH Library
PoS(EPS-HEP2019)367
boson production mode where the vector boson decays leptonically and the Higgs boson decays to a pair of bottom quarks
Krunal Bipin Gedia∗†
Swiss Federal Institute of Technology in Zurich (ETHZ), Zurich, Switzerland E-mail:gediak@phys.ethz.ch
A measurement of the Higgs-beauty quark coupling through the Higgs boson production asso- ciated with a Z or W boson where the W/Z boson decays leptonically and the Higgs boson to a pair of bottom quarks is presented. The analysis is based on 41.3 fb−1data from proton-proton collisions at√
s=13 TeV collected by CMS in 2017. These results are combined with the results obtained using the 2016 and Run 1 dataset.
European Physical Society Conference on High Energy Physics - EPS-HEP2019 - 10-17 July, 2019
Ghent, Belgium
∗Speaker.
†on behalf of the CMS Collaboration
PoS(EPS-HEP2019)367
Observation of H(bb) in pp¯ →VH(bb) production mode.¯ Krunal Bipin Gedia
1. Introduction
The Standard model (SM) Higgs boson was discovered in 2012 in the bosonic decay channels, H →ZZ∗ and H →γ γ [1][2][3]. Later, observation of the Higgs boson in WW and τ τ decay modes have also been accomplished. The branching ratio of the SM Higgs boson to bottom quarks (H →bb) is predicted to be 58%. However, the¯ H →bb¯ coupling had not been established in Run 1. A precise measurement of this coupling helps to probe the Yukawa coupling between Higgs boson and down-type quarks and also provides a test for the hypothesis that the mass of the charged fermion is generated by the Higgs field.
The dominant production mode of Higgs boson in the p-p collisions, the gluon-gluon fusion, is not sensitive to the H →bb¯ coupling due to the presence of b-quarks from large irreducible QCD background. The most sensitive channel to study theH→bb¯ coupling is the vector boson associated (VH) production mode. The Higgs boson produced in association with the vector boson (W and Z) where the Higgs boson decays to a pair of bottom quarks and the vector boson decays leptonically has been presented [4]. Three channels have been investigated, namely 0, 1 and 2 lepton channels leading to five final states:Z(µ µ)H,Z(ee)H,W(µ ν)H,W(µ ν)H,Z(ν ν)H. In 1 and 2 lepton channel, the presence of charged leptons from W/Z decays provides a tigger for the signal and also helps to suppress the background. The presence of large missing transverse energy makes 0-lepton channel accessible.
The data used corresponds to the p-p collisions at √
s=13 TeV center of mass energy with a total integrated luminosity of 41fb−1measured in 2017 by the Compact Muon Solenoid (CMS) detector at CERN [5].
2. Object reconstruction
The Higgs boson is reconstructed using a pair of jets(j j) with highest b-tag score. The b-tag score is determined using the Charged Secondary Vertex algorithm (deepCSV) based on the Deep Neural Network (DNN) architecture. Of the two jets used in the reconstruction of the Higgs boson, the jet with the highest b-tag score is required to pass tight selection point (0.1% mis-identification probability) while the other jet with the second highest b-tag score is required to pass the loose WP criteria (1% mis-identification probability).t¯tand QCD background is reduced by rejecting events with more than one extra jets forpVT > 30GeV. Anti-QCD cuts requiring the angle between thepmissT and nearest jet to be greater than 0.5 are used in 0-lepton channel to reduce QCD contribution. The mass resolution of dijet invariant mass is about 15% after all the event selection criteria is applied.
A DNN based b-jet energy regression trained on the b-jets from the ttbar events is further used to improve the mass resolution. It provides energy correction for the calibration mis-match, neutrino escaping in the semi-leptonic decay, etc. Further improvements are obtained using the recovery of the final state radiation where the four momenta of jets close to the Higgs boson candidate jets are added to it. SincepmissT in 2-lepton channel is theoretically zero, the mass of dilepton is constrained to the vector boson mass while the total transverse momenta of all the particles in summed to zero.
The vector boson is reconstructed using the two hardest opposite sign leptons or isolated lep- tons and missing transverse energy (MET) or only MET depending upon the channel. The back- ground is further reduced by requiringpmissT > 170 GeV for 0-lepton,pVT> 150 GeV in 1-lepton. For
1
PoS(EPS-HEP2019)367
2-lepton, the analysis region is divided in two parts, pVT < 150 GeV andpVT > 150 GeV. Requiring large value of pVT reduces background significantly.
3. Event selection
The signal region is defined such that the mj j is between 60 GeV and 160 GeV for 0-lepton and between 90 GeV and 150 GeV for 1 and 2 lepton channels. A DNN classifier is trained for each channel using the signal and all background events to distinguish between signal and background events in the signal region. About 14-16 discriminatory inputs (depending on the channel) like mj j, pVT, number of additional jets, deepCSV score are used in training of the DNN classifier.
Different control regions are defined to be enriched in various background process. Three control regions are used corresponding to those enriched int¯tproduction (TT), W or Z boson production in association with either heavy flavor (HF) or light flavour (LF) jets. These control regions are used in the combined fit to obtain the scale factors (normalization with respect to data) of major background processes.
4. Analysis strategy
The signal strength is defined as the measured production cross section times branching frac- tion divided by the expected SM value. The signal strength is extracted from a simultaneous max- imum likelihood binned fit to all the signal and control regions. In each of the signal region, the DNN score is used as the fitted variable. For TT and LF control region, only the yield is used in the fit (since they are pure in corresponding background processes). For HF control region, a multi- class DNN classifier (DNNHF) is trained to distinguish between different background processes.
The score of DNNHF is used as the fitted variable for HF control region in the simultaneous fit for 0 and 1 lepton. For 2-leptons, only two bins of deepCSV score is used as the fitted variable for the HF control region. The profile likelihood asymptotic approximation is used to obtain the observed excess of events in the simultaneous fit.
As a cross-check to this methodology, VZ process is treated as signal and all other processes including VH (at predicted SM cross section) are used as background. VZ(bb) has similar fi- nal kinematics but different dijet invariant mass. Thus, signal region was defined to be in range [60,160] GeV in all there channels. Same control regions were used as defined in the VH(bb) anal- ysis. The observed (expected) significance for the excess of events from production of combined WZ and ZZ process is 5.2σ (5.0σ). The observed signal strength was 1.05±0.22.
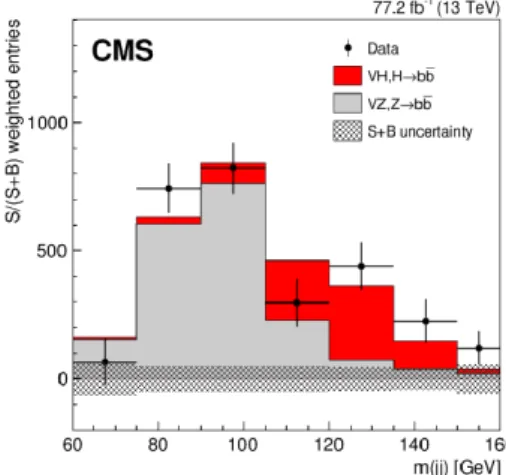
In another cross-check analysis, the dijet invariant mass (mj j) is the fitted variable in the signal region instead of the DNN score. The DNN is trained with same input variables except those corre- lated withmj jare fixed to their mean values. The events are categorised in four bins of increasing signal to background ratio according to their DNN score and are used as the fitted variable of the signal region in each of the channels. This along with the same control regions are used in the fit to extract the signal and background yield. The fittedmj j distribution are then combined and weighted by S/(S+B) where S is the Higgs boson signal yield while B is the sum of all the back- ground processes taking fitted normalisation into account. The resulting combinedmj jdistribution is shown in Fig. 1after background subtraction. The VH(bb) signal and VZ(bb) background are
PoS(EPS-HEP2019)367
Observation of H(bb) in pp¯ →VH(bb) production mode.¯ Krunal Bipin Gedia
Figure 1:The fitted dijet invariant mass distribution with events weighted by S/(S+B), where S is the Higgs boson signal yield and B is the sum of all the background yields taking fitted normalisation into account.
The fitted VH signal is shown in red, VZ background in grey while all other backgrounds are subtracted.
The error bars indicate 1σpre-subtraction statistical uncertainty while the grey hatching represents 1σtotal uncertainty on the signal and all background components [4].
shown in the red and grey histogram respectively. This analysis is performed using only 2016 and 2017 datasets.
5. Results
The observed (expected) significance for the SM Higgs boson above background-only hy- pothesis is 3.3σ (3.1σ). The corresponding signal strength is 1.08±0.34 (stats + sys). The major sources of the systematic uncertainties are background normalization, simulated sample size, b- tagging efficiency and mis-identification rates, and V+jets modeling. The impact of the major un- certainties on the signal strength (∆µ) is: statistical (±0.26), experimental (+0.16,−0.15; majorly due to b-tagging efficiency, V+jets modeling, jet energy scale and resolution), MC sample size (±0.12) and theoretical (+0.11,−0.09) giving a total of +0.35,−0.33 uncertainty on the signal strength.
The results from 2017 dataset were combined with the 2016 dataset to obtain an observed (expected) signal significance of 4.4σ(4.2σ) and signal strength of 1.06±0.26. Except theoretical uncertainties, all other systematic uncertainties are assumed to be uncorrelated (independent) while the dominant uncertainties related to jet energy scale are assumed to be fully correlated in the fit.
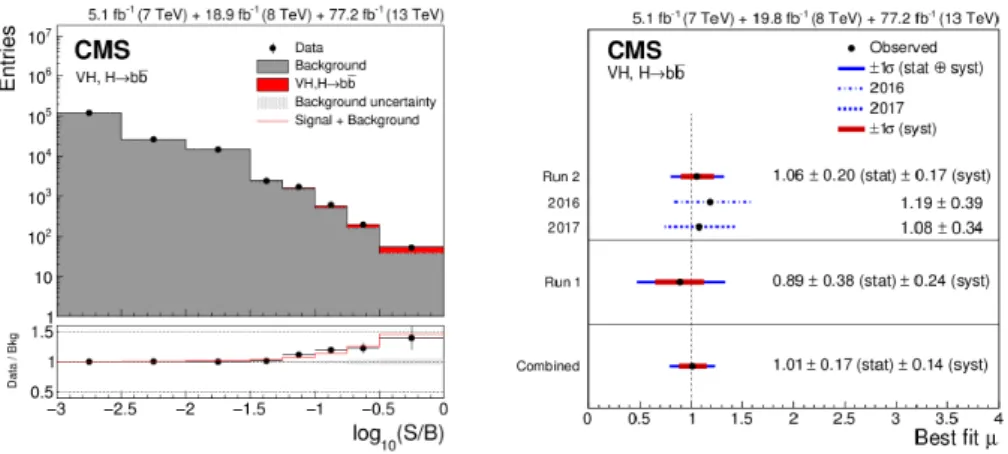
These results from 2016 + 2017 dataset are combined with the entire Run 1 dataset to obtain an observed (expected) signal significance of 4.8σ(4.9σ) and measured signal strength of 1.01± 0.22 [0.17 (stat)±0.09 (exp)±0.06 (MC)±0.08 (theo)] leading to the first the observation of theH→bb¯ decay by the CMS Collaboration. Distribution of signal, background and data events sorted in similar signal-to-background ratio obtained from the fit to corresponding multivariate distributions in signal region in all three channels is shown in Fig2. The signal strength (µ) and significance (σ) for individual and combined datasets are shown in Fig.2and Table1respectively.
3
PoS(EPS-HEP2019)367
Figure 2:Left: Distribution of signal (red histogram), background (grey histogram) and data events sorted in similar signal-to-background ratio obtained from the fit to corresponding multivariate distributions in signal region in all three channels of combined Run 1 and Run 2 dataset is shown. The bottom panel shows the ratio of data to background. The red line is gives the ratio of sum of signal and background yield divided by background yield. The grey hatching represents uncertainty in the background yield. Right: The best fit value of signal strength atmH = 125.09 GeV for all channels in Run 1 and Run 2 dataset. The red (blue) horizontal error bars indicate the 1σ statistical (total) uncertainty while the vertical bar represents the SM expectation [4].
Data set Sig. (exp.) Sig. (obs.) Signal strength 2017
0-lepton 1.9 1.3 0.73±0.65
1-lepton 1.8 2.6 1.32±0.55
2-lepton 1.9 1.9 1.05±0.59
Combined 3.1 3.3 1.08±0.34
Run 2 4.2 4.4 1.06±0.26
Run 1 + Run 2 4.9 4.8 1.01±0.22
Table 1:Expected (Observed) value of significance along with its corresponding signal strength for different channels of 2017 dataset, Run 2 dataset and combined Run 1 and Run 2 dataset is given.
References
[1] The ATLAS Collaboration. Observation of a new particle in the search for the Standard Model Higgs boson with the ATLAS detector at the LHC.Physics Letters B, 716(1):1–29, Sep 2012.
[2] The CMS Collaboration. Observation of a new boson at a mass of 125 GeV with the CMS experiment at the LHC.Physics Letters B, 716(1):30–61, Sep 2012.
[3] The CMS Collaboration. Observation of a new boson with mass near 125 GeV in pp collisions at
√s=7 and 8 TeV.Journal of High Energy Physics, 2013(6), Jun 2013.
[4] The CMS Collaboration. Observation of Higgs Boson Decay to Bottom Quarks.Physical Review Letters, 121(12), Sep 2018.
[5] The CMS Collaboration. The CMS Experiment at the CERN LHC.JINST, 3:S08004, 2008.