EUROPEAN ORGANISATION FOR NUCLEAR RESEARCH (CERN)
JHEP 03 (2018) 095
DOI:10.1007/JHEP03(2018)095
CERN-EP-2017-206 22nd May 2018
Measurement of the Higgs boson coupling
properties in the √ H → Z Z ∗ → 4` decay channel at s = 13 TeV with the ATLAS detector
The ATLAS Collaboration
The coupling properties of the Higgs boson are studied in the four-lepton ( e , µ ) decay channel using 36.1 fb
−1of pp collision data from the LHC at a centre-of-mass energy of 13 TeV collected by the ATLAS detector. Cross sections are measured for the main production modes in several exclusive regions of the Higgs boson production phase space and are interpreted in terms of coupling modifiers. The inclusive cross section times branching ratio for H → Z Z
∗decay and for a Higgs boson absolute rapidity below 2.5 is measured to be 1 . 73
+0−0..2423(stat.)
+0−0..1008(exp.) ± 0 . 04(th.) pb compared to the Standard Model prediction of 1 . 34 ± 0 . 09 pb. In addition, the tensor structure of the Higgs boson couplings is studied using an effective Lagrangian approach for the description of interactions beyond the Standard Model. Constraints are placed on the non-Standard-Model CP-even and CP-odd couplings to Z bosons and on the CP-odd coupling to gluons.
© 2018 CERN for the benefit of the ATLAS Collaboration.
Reproduction of this article or parts of it is allowed as specified in the CC-BY-4.0 license.
arXiv:1712.02304v2 [hep-ex] 19 May 2018
1 Introduction
The observation of the Higgs boson by the ATLAS and CMS experiments [1, 2] with the LHC Run-1 data at centre-of-mass energies of
√
s = 7 TeV and 8 TeV has been a major step towards the understanding of the mechanism of electroweak (EW) symmetry breaking [3–5]. Further measurements of the spin, parity and couplings of the new particle have shown no significant deviation from the predictions for the Standard Model (SM) Higgs boson [6–10]. The increased centre-of-mass energy and higher integrated luminosity of the LHC Run-2 data allows the study of the Higgs boson properties in greater detail and an improved search for deviations from the SM predictions.
In this paper, the measurement of the Higgs boson coupling properties is performed in the four-lepton decay channel, H → Z Z
∗→ 4 ` , where ` ≡ e or µ , using 36.1 fb
−1of Run-2 pp collision data collected by the ATLAS experiment at a centre-of-mass energy of 13 TeV. This channel provides a clear signature and high signal-to-background ratio. The largest background is the continuum (Z
(∗)/γ
∗)(Z
(∗)/γ
∗) production, referred to as Z Z
∗hereafter. For the studied four-lepton invariant mass range of 118 GeV < m
4`< 129 GeV, there are also small but non-negligible background contributions from Z + jets and t¯ t production with two prompt leptons.
The Higgs boson spin, parity and coupling properties have been studied in this channel with Run-1 data by the ATLAS and CMS experiments [6, 7, 11–13] and recently with Run-2 data by the CMS experiment [14, 15]. In this paper, the Higgs boson couplings to SM particles are studied using two analysis approaches.
In the first approach, the Higgs boson production cross sections are analyzed based on different production modes in several exclusive regions of the production phase space, testing whether it is compatible with the SM predictions. An interpretation in terms of coupling modifiers within the κ framework [16, 17]
is given, assuming a SM tensor structure ( J
P= 0
+) for all couplings. In the second approach, the tensor structure of the Higgs boson couplings is studied, probing for admixtures of CP-even and CP-odd interactions in theories beyond the SM (BSM) in addition to the corresponding SM interactions. Both analyses are performed assuming that the studied resonance is a single particle state with spin-0 and a mass of 125.09 GeV based on experimental results obtained with the LHC Run-1 data [18]. It is assumed that the total width of the resonance is small compared the experimental resolution and the interference effects between the signal and SM backgrounds are neglected due to the small contribution.
The paper is organized as follows. A brief introduction of the ATLAS detector is given in Section 2. The
analysis strategy describing the two analysis approaches is outlined in Section 3. In Section 4 the data
as well as the simulated signal and background samples are described. The selection and categorization
of the Higgs boson candidate events, as well as the discriminating observables used in the measurement,
are described in Section 5, while the signal and background modelling is detailed in Sections 6 and 7,
respectively. The experimental and theoretical systematic uncertainties (Section 8) are taken into account
for the statistical interpretation of the data, with the results presented in Section 9. Concluding remarks
are given in Section 10.
2 ATLAS detector
The ATLAS detector [19] is a multi-purpose particle detector with a forward-backward symmetric cyl- indrical geometry.
1It consists of an inner tracking detector (ID) in a 2 T axial magnetic field covering the pseudorapidity range |η | < 2 . 5. A new innermost silicon pixel layer [20] (IBL) was added to the ID after the Run-1 data-taking. The ID is surrounded by the electromagnetic and hadronic calorimeters up to |η| = 4.9 and by the muon spectrometer (MS) extending up to |η| = 2 . 7. The magnetic field for the MS is provided by a set of toroids with a field integral ranging between 2 Tm and 6 Tm across most of the detector. The trigger and data-acquisition system is based on two levels of online event selection: a hardware-based first-level trigger and a software-based high-level trigger employing algorithms similar to those for the offline particle reconstruction.
3 Analysis strategy
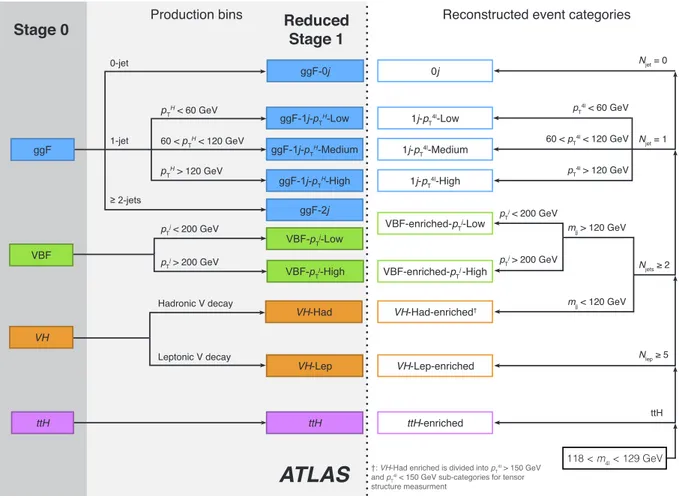
The Higgs boson couplings to heavy SM vector bosons ( W and Z ) and gluons are studied by measuring the cross sections for different production modes and by probing BSM contributions in tensor couplings. In both approaches, the reconstructed Higgs boson candidate events are classified into different categories.
The categories are defined to be sensitive to different Higgs boson production modes, which in turn also provides sensitivity to the BSM contributions. The event yields in each category serve as the final discriminant for both the cross section and the tensor structure studies. There are nine reconstructed event categories defined for the cross-section measurement, one of which is additionally split into two separate ones for the tensor structure studies to improve their sensitivity. For the cross-section measurement, there are also additional discriminating observables introduced in reconstructed event categories with a sufficiently high number of events. These observables are defined using dedicated boosted decision trees (BDTs) [21].
3.1 Classification of the Higgs boson production modes
The Higgs boson production cross section times the branching ratio of the decay into Z boson pairs, σ · B(H → Z Z
∗) , is measured in several dedicated mutually exclusive regions of the phase space based on the production process. For simplicity, these regions are called “production bins”. Theoretical uncertainties have a reduced impact on σ · B(H → Z Z
∗) results and enter primarily for the interpretation of results in terms of Higgs boson couplings. The definitions of the production bins shown in Figure 1 (shaded area) are based on particle-level events produced by dedicated event generators closely following the framework of simplified template cross sections [17]. The bins are chosen in such a way that the measurement precision is maximized and at the same time possible BSM contributions can be isolated.
All production bins are defined for Higgs bosons with rapidity | y
H| < 2.5 and no requirements placed on the particle-level leptons. Two sets of production bins are considered since a more inclusive phase-space region usually reduces the statistical uncertainty of the measurement but at the cost of a larger theoretical uncertainty.
1ATLAS uses a right-handed coordinate system with its origin at the nominal interaction point (IP) in the centre of the detector and thez-axis along the beam pipe. Thex-axis points from the IP to the centre of the LHC ring, and they-axis points upward.
Cylindrical coordinates(r, φ)are used in the transverse plane, withφbeing the azimuthal angle around the beam pipe. The pseudorapidity is defined in terms of the polar angleθasη=−ln tan(θ/2).
VH-Had-enriched†
pTj > 200 GeV pTj < 200 GeV
118 < m4l < 129 GeV 0j
1j-pT4l-Medium 1j-pT4l-Low
1j-pT4l-High
ttH ttH-enriched
Nlep ≥ 5 VH-Lep-enriched
Njets ≥ 2 VBF-enriched-pTj-Low
VBF-enriched-pTj -High
mjj < 120 GeV mjj > 120 GeV
Njet = 1
pT4l > 120 GeV 60 < pT4l < 120 GeV pT4l < 60 GeV
Njet = 0
ATLAS
ttH ggF-2j ggF-0j
VH-Lep VH-Had VBF-pTj-Low
VBF-pTj-High pTH < 60 GeV
pTH > 120 GeV 60 < pTH < 120 GeV
≥ 2-jets 0-jet
1-jet
ggF-1j-pTH-High ggF-1j-pTH-Low ggF-1j-pTH-Medium
pT j > 200 GeV pTj < 200 GeV
Leptonic V decay Hadronic V decay
Stage 0 Reduced
Stage 1
VH VBF
ttH
Reconstructed event categories Production bins
ggF
†: VH-Had enriched is divided into pT4l > 150 GeV and pT4l < 150 GeV sub-categories for tensor structure measurment
Figure 1: The phase-space regions (production bins) for the measurement of the Higgs boson production cross sections which are defined at the particle level for Stage 0 and 1, and the corresponding reconstructed event categories. Description of production bins is given in Section3, while reconstructed event categories are described in Section5.
For the first set (Stage 0) [17], production bins are simply defined according to the Higgs boson production vertex: gluon–gluon fusion (ggF), vector boson fusion (VBF) and associated production with top quark pairs ( ttH ) or vector bosons ( VH ), where V is a W or a Z boson. The bbH Higgs boson production bin is not included because there is insufficient sensitivity to measure this process with the current integrated luminosity. This production mode has an acceptance similar to gluon–gluon fusion, and their contributions are therefore considered together in the analysis. The sum of their contributions is referred to in the following as gluon–gluon fusion.
For the second set (reduced Stage 1), a more exclusive set of production bins is defined. This set is
obtained by the merging of those production bins of the original Stage-1 set from Ref. [17] which cannot
be measured separately in the H → Z Z
∗→ 4 ` channel with the current data sample. The gluon–gluon
fusion process is split into events with zero, one or at least two particle-level jets. The particle-level jets
are built from all stable particles (all particles with c τ > 1 mm) including neutrinos, photons and leptons
from hadron decays or produced in the shower. All decay products from the Higgs boson, as well as
the leptons and neutrinos from decays of the signal V bosons are removed, while decay products from
hadronically decaying signal V bosons are included in the inputs to the particle-level jet building. The anti- k
tjet reconstruction algorithm [22], implemented in the FastJet package [23], with a radius parameter R = 0 . 4 is used and jets are required to have p
T> 30 GeV. The 1-jet bin is further split into three bins with the Higgs boson transverse momentum p
HT
below 60 GeV, between 60 GeV and 120 GeV, and above 120 GeV. The reduced Stage-1 gluon–gluon fusion bins are correspondingly denoted by ggF-0 j , ggF-1 j - p
HT
-Low, ggF-1 j - p
HT
-Med, ggF-1 j - p
HT
-High and ggF-2 j . The VBF production bin is split into two bins with the transverse momentum of the leading jet, p
j1T
, below and above 200 GeV (VBF- p
jT
-Low and VBF- p
jT
-High, respectively). The former bin is expected to be dominated by SM events, while the latter is sensitive to potential BSM contributions. For VH production, separate bins with hadronically ( VH -Had) and leptonically ( VH -Lep) decaying vector bosons are considered. The leptonic V boson decays include the decays into τ leptons and into neutrino pairs. The ttH production bin remains the same as for Stage 0.
Figure 1 also summarizes the corresponding categories of reconstructed events in which the cross-section measurements are performed and which are described in more detail in Section 5. There is a dedicated reconstructed event category for each production bin except for ggF-2 j . This process contributes strongly to all reconstructed event categories containing events with at least two jets, and can therefore be measured in these categories, with the highest sensitivity expected in VBF-enriched- p
jT
-Low category.
3.2 Tensor structure of Higgs boson couplings
In order to study the tensor structure of the Higgs boson couplings to SM gauge bosons, interactions of the Higgs boson with these SM particles are described in terms of the effective Lagrangian of the Higgs characterization model [24],
L
V0
=
κ
SM1
2 g
H Z ZZ
µZ
µ+ g
HW WW
µ+W
−µ− 1 4
κ
H ggg
H ggG
µνaG
a,µν+ tan ακ
Aggg
AggG
aµνG ˜
a,µν− 1 4
1 Λ
κ
H Z ZZ
µνZ
µν+ tan ακ
AZ ZZ
µνZ ˜
µν− 1 2
1 Λ
κ
HW WW
µν+W
−µν+ tan ακ
AW WW
µν+W ˜
−µνX
0. (1)
The additional terms in the Lagrangian involving couplings to fermions are not considered since the present analysis is not sensitive to these couplings. The model is based on an effective field theory description which assumes there are no new BSM particles below the energy scale Λ . The cut-off scale Λ is set to 1 TeV, supported by the current experimental results showing no evidence of new physics below this scale.
The notation of Eq. (1) follows the notation of Eq. (2.4) in Ref. [24] with X
0defining a new bosonic state
of spin 0 and with the difference that the dimensionless coupling parameters κ are redefined by dividing
them by cos α , where α is the mixing angle between the 0
+and 0
−CP states implying CP-violation
for α , 0 and α , π . In this way the prediction for the SM Higgs boson is given by κ
SM= 1 and
κ
H gg= 1 with the values of the BSM couplings set to zero. In this analysis, only the effective Lagrangian
terms with coupling parameters κ
HVV, κ
AVVand κ
Aggare considered as possible BSM admixtures to the
corresponding SM interactions. These terms describe the CP-even (scalar) and CP-odd (pseudo-scalar)
BSM interaction with vector bosons and the CP-odd BSM interaction with gluons, respectively. The BSM
couplings are assumed to be the same for W and Z bosons (i.e. κ
HW W= κ
H Z Z≡ κ
HVVand κ
AW W= κ
AZ Z≡ κ
AVV). The value of α is arbitrarily set to π/ 4 such that the CP-odd couplings can be more simply denoted by κ
AVVtan α ⇒ κ
AVVand κ
Aggtan α ⇒ κ
Agg.
In the previous Run-1 analysis [11], the Higgs-related BSM interactions with heavy vector bosons were studied only in Higgs boson decays. In this analysis, the impact of BSM contributions on both the decay rates and the production cross sections in different production modes is taken into account. The κ
HVVand κ
AVVparameters contribute the most to VH and VBF Higgs boson production in the four-lepton decay mode since the coupling is present in both the production and decay vertices. The κ
Aggparameter mostly affects the ggF production.
4 Signal and background simulation
The production of the SM Higgs boson via ggF, VBF and VH (including gg → Z H ) production mechan- isms was modelled with the POWHEG-BOX v2 Monte Carlo (MC) event generator [25, 26], interfaced to EvtGen v1.2.0 [27] for properties of the bottom and charm hadron decays, using the PDF4LHC next-to-leading-order (NLO) set of parton distribution functions (PDF) [28]. The gluon–gluon fusion Higgs boson production is accurate to next-to-next-to-leading order (NNLO) in the strong coupling, using the POWHEG method for merging the NLO Higgs + jet cross section with the parton shower, and the MiNLO method [29] to simultaneously achieve NLO accuracy for inclusive Higgs boson production. A reweighting procedure, employing the Higgs boson rapidity, was applied using the HNNLO program [30, 31]. The matrix elements of the VBF and VH production mechanisms were calculated up to NLO in QCD. For VH production, the MiNLO method was used to merge 0- and 1-jet events [32]. The gg → Z H contribution was modelled at leading order (LO) in QCD. The production of a Higgs boson in association with a top (bottom) quark pair was simulated at NLO with MadGraph5_aMC@NLO v2.2.3 (v2.3.3) [33, 34] , using the CT10nlo PDF set [35] for ttH production and the NNPDF23 PDF set [36] for bbH produc- tion. For the ggF, VBF, VH and bbH production mechanisms, the PYTHIA 8 [37] generator was used for the H → Z Z
∗→ 4 ` decay as well as for the parton shower model using a set of tuned parameters called the AZNLO tune [38]. For the ttH production mechanism, the Herwig++ [39] event generator was used with the UEEE5 tune [40]. All signal samples were simulated for the Higgs boson with a mass m
H= 125.00 GeV. Wherever relevant, the signal mass distribution is shifted to the reference value of 125.09 GeV.
The Higgs boson production cross sections and decay branching ratios, as well as their uncertainties, were taken from Refs. [16, 28, 36, 41–68]. The ggF production was calculated with next-to-next-to-next-to- leading order (N
3LO) accuracy in QCD and has NLO electroweak (EW) corrections applied. For VBF production, full NLO QCD and EW calculations were used with approximate NNLO QCD corrections.
The VH production was calculated at NNLO in QCD and NLO EW corrections are applied. The ttH and bbH processes were calculated to NLO accuracy in QCD. The branching ratio for the H → Z Z
∗→ 4 ` decay with m
H= 125.09 GeV was predicted to be 0.0125% [62] in the SM using PROPHECY4F [64, 65], which includes the complete NLO QCD and EW corrections, and the interference effects between identical final-state fermions. Table 1 summarizes the production cross sections and branching ratios for the H → Z Z
∗→ 4 ` decay for m
H= 125 . 09 GeV.
Additional ggF, VBF and VH signal samples with different values of the BSM couplings κ
Agg, κ
HVVand
κ
AVVwere generated with MadGraph5_aMC@NLO and are used for the signal modelling as a function
of the BSM couplings as explained in Section 6. The ggF simulation includes samples at NLO QCD
Table 1: The predicted SM Higgs boson production cross sections (σ) for ggF, VBF and associated production with aW or Z boson or with a tt¯or bb¯pair inppcollisions formH =125.09 GeV at
√
s=13 TeV [16,28,36, 41–68]. The quoted uncertainties correspond to the total theoretical systematic uncertainties calculated by adding in quadrature the QCD scale and PDF+αsuncertainties. The decay branching ratio (B) with the associated uncertainty forH→ Z Z∗andH→ Z Z∗→4`with`=e, µ, is also given.
Production process σ [pb]
ggF (gg → H) 48 . 5 ± 2 . 4 VBF (qq
0→ Hqq
0) 3 . 78 ± 0 . 08 WH q q ¯
0→ W H
1 . 369 ± 0 . 028 ZH (q q/gg ¯ → Z H) 0 . 88 ± 0 . 04 ttH (q q/gg ¯ → t¯ tH) 0 . 51 ± 0 . 05 bbH q q/ ¯ gg → b bH ¯
0 . 49 ± 0 . 12 Decay process B [ · 10
−4]
H → Z Z
∗264 ± 6
H → Z Z
∗→ 4 ` 1 . 250 ± 0 . 027
accuracy for zero, one and two additional partons merged with the FxFx merging scheme [33, 69], while the VBF and VH simulations are accurate to LO in α
s. Equivalent VBF and VH processes were also generated at NLO QCD accuracy and used to estimate the relative uncertainties of higher-order QCD effects as a function of the BSM coupling parameters.
The Z Z
∗continuum background from quark–antiquark annihilation was modelled using Sherpa 2.2.2 [70–
72], which provides a matrix element calculation accurate to NLO in α
sfor 0-, and 1-jet final states and LO accuracy for 2- and 3-jet final states. The merging was performed with the Sherpa parton shower [73]
using the ME+PS@NLO prescription [74]. The NLO EW corrections were applied as a function of the invariant mass of the Z Z
∗system m
Z Z∗[75, 76].
The gluon-induced Z Z
∗production was modelled by gg2VV [77] at LO in QCD. The higher-order QCD effects for the gg → Z Z
∗continuum production have been calculated for massless quark loops [78–80]
in the heavy top-quark approximation [81], including the gg → H
∗→ Z Z processes [82, 83]. The simulated LO samples are scaled by the K -factor of 1.7 ± 1.0, defined as the ratio of the higher-order and the leading-order cross section predictions.
The WZ background was modelled using POWHEG-BOX v2 interfaced to PYTHIA 8 and EvtGen v1.2.0 for properties of the bottom and charm hadron decays. The triboson backgrounds ZZZ , WZZ , and WWZ with four or more prompt leptons were modelled using Sherpa 2.1.1. The simulation of t¯ t + Z events with both top quarks decaying semi-leptonically and the Z boson decaying leptonically was performed with MadGraph interfaced to PYTHIA 8 and the total cross section was normalized to the prediction which includes the two dominant terms at both the LO and the NLO in a mixed perturbative expansion in the QCD and EW couplings [58].
The modelling of events containing Z bosons with associated jets was performed using the Sherpa 2.2.2
generator. Matrix elements were calculated for up to two partons at NLO and four partons at LO
using Comix [71] and OpenLoops [72], and merged with the Sherpa parton shower [73] using the
ME+PS@NLO prescription [74]. The NNPDF3.0 NNLO PDF set was used in conjunction with dedicated
parton shower parameters tuning developed by the Sherpa authors. Simulated samples were normalized
to the data-driven estimate described in Section 7. As a cross-check, this estimate was compared to the theory prediction obtained with FEWZ [84, 85] at NNLO in α
s.
The t¯ t background was modelled using POWHEG-BOX v2 interfaced to PYTHIA 6 [86] for parton showering, hadronisation, and the underlying event and to EvtGen v1.2.0 for properties of the bottom and charm hadron decays.
Generated events were processed through the ATLAS detector simulation [87] within the Geant4 framework [88] and reconstructed the same way as the data. Additional pp interactions in the same and nearby bunch crossings (pile-up) are included in the simulation. The pile-up events were generated using PYTHIA 8 with the A2 set of tuned parameters [89] and the MSTW2008LO PDF set [90].
The simulation samples were weighted to reproduce the observed distribution of the mean number of interactions per bunch crossing in the data.
5 Event selection
5.1 Event reconstruction
The selection and categorization of the Higgs boson candidate events rely on the reconstruction and identification of electrons, muons and jets, closely following the analyses reported in Refs. [11, 91].
Collision vertices are reconstructed from ID tracks with transverse momentum p
T> 400 MeV. The vertex with the highest Í
p
2T
of reconstructed tracks is selected as the primary vertex. Events are required to have at least one collision vertex with at least two associated tracks.
Electron candidates are reconstructed from ID tracks that are matched to energy clusters in the electromag- netic calorimeter [92]. A Gaussian-sum filter algorithm [93] is used to compensate for radiative energy losses in the ID. Electron identification is based on a likelihood discriminant combining the measured track properties, electromagnetic shower shapes and quality of the track–cluster matching. The “loose”
likelihood criteria applied in combination with track hit requirements provide an electron efficiency of 95% [92]. Electrons are required to have E
T> 7 GeV and |η| < 2.47, with their energy calibrated as described in Ref. [94].
Muon candidate reconstruction [95] within |η | < 2.5 is primarily performed by a global fit of fully reconstructed tracks in the ID and the MS. In the central detector region ( |η | < 0.1), which has a limited MS geometrical coverage, muons are also identified by matching a fully reconstructed ID track to either an MS track segment (segment-tagged muons) or a calorimetric energy deposit consistent with a minimum-ionizing particle (calorimeter-tagged muons). For these two cases, the muon momentum is determined by the ID track alone. In the forward MS region (2.5 < |η| < 2.7) outside the ID coverage, MS tracks with hits in the three MS layers are accepted and combined with forward ID tracklets, if they exist (stand-alone muons). Calorimeter-tagged muons are required to have p
T> 15 GeV. For all other muon candidates, the minimum transverse momentum is 5 GeV instead of the 6 GeV threshold in the Run-1 publication [11], increasing the signal acceptance in the four-muon final state by about 7%. At most one calorimeter-tagged or stand-alone muon is allowed per event.
Jets are reconstructed from noise-suppressed topological clusters [96] in the calorimeter using the anti- k
talgorithm with a radius parameter R = 0.4. The jet four-momentum is corrected for the calorimeter’s
non-compensating response, signal losses due to noise threshold effects, energy lost in non-instrumented
regions, and contributions from pile-up [97]. Jets are required to have p
T> 30 GeV and |η| < 4.5. Jets from pile-up are rejected using a jet-vertex-tagger discriminant [98] based on the fraction of the jet’s tracks that come from the primary vertex. Jets with |η| < 2.5 containing b -hadrons are identified using the MV2c20 b -tagging algorithm [99, 100] at an operating point with 70% b -tagging efficiency.
Ambiguities are resolved if electron, muon or jet candidates are reconstructed from the same detector information. If a reconstructed electron and muon share the same ID track, the muon is rejected if it is calorimeter-tagged; otherwise the electron is rejected. Reconstructed jets geometrically overlapping in a cone of radius R = 0.2 with electrons or muons are also removed.
5.2 Selection of the Higgs boson candidates
Events are triggered by a combination of unprescaled single-lepton, dilepton and trilepton triggers with p
Tand E
Tthresholds increasing slightly during the data-taking periods due to an increasing peak luminosity.
The lowest-threshold triggers are complemented by triggers with higher thresholds but looser lepton selection criteria. The global trigger efficiency for signal events passing the final selection is 98%.
At least two same-flavour and opposite-charge lepton pairs are required in the final state, resulting in one or more possible lepton quadruplets in each event. The three highest- p
Tleptons in each quadruplet must have transverse momenta above 20 GeV, 15 GeV and 10 GeV, respectively. The lepton pair with the invariant mass m
12( m
34) closest (second closest) to the Z boson mass in each quadruplet is referred to as the leading (subleading) lepton pair. Based on the lepton flavour, each quadruplet is classified into one of the following decay channels: 4 µ , 2 e 2 µ , 2 µ 2 e and 4 e , with the first two leptons always representing the leading lepton pair. In each subchannel, only the quadruplet containing the leading lepton pair with an invariant mass closest to the Z boson mass is accepted.
The leading lepton pair must satisfy 50 GeV < m
12< 106 GeV. The subleading lepton pair is required to have a mass m
min< m
34< 115 GeV, where m
minis 12 GeV for the four-lepton invariant mass m
4`below 140 GeV, rising linearly to 50 GeV at m
4`= 190 GeV and then remaining at 50 GeV for all higher m
4`values. In the 4 e and 4 µ channels, the two alternative opposite-charge lepton pairings within a quadruplet must have a dilepton mass above 5 GeV to suppress the J/ψ background. The two lepton pairs within the quadruplet must have an angular separation of ∆R = p
(∆y)
2+ (∆φ)
2> 0.1 (0.2) for same-flavour (different-flavour) lepton pairs. Each electron (muon) must have a transverse impact parameter significance
| d
0|/σ(d
0) below 5 (3) to suppress the background from heavy-flavour hadrons. Reducible background from the Z +jets and t¯ t processes is further suppressed by imposing track-based and calorimeter-based isolation criteria on each lepton. The scalar sum of the p
Tof the tracks lying within a cone of ∆R = 0.3 (0.2) around the muon (electron) is required to be smaller than 15% of the lepton p
T( E
T). Similarly, the sum of the calorimeter E
Tdeposits in a cone of ∆R = 0.2 around the muon (electron) is required to be less than 30% (20%) of the lepton E
T. The calorimeter-based isolation requirement is applied after correcting for the pile-up and underlying-event contributions as well as removing the energy deposits from the remaining three leptons. If there is more than one decay channel per event with a quadruplet satisfying the above selection criteria, the quadruplet from the channel with highest efficiency is chosen as the Higgs boson candidate. The signal selection efficiencies in the fiducial region with | y
H| <2.5 are 33%, 25%,19%
and 17%, in the 4 µ , 2 e 2 µ , 2 µ 2 e and 4 e channels, respectively.
In case of VH -Lep or ttH production, there may be additional leptons present in the event, together with the
selected quadruplet. There is therefore a possibility that some of the quadruplet leptons do not originate
from a Higgs boson decay, but rather from the V boson or top quark decays. To improve the lepton
pairing in such cases, a matrix-element-based pairing method is used for all events containing at least one additional lepton with p
T> 12 GeV and which satisfies the same identification and isolation criteria as the four quadruplet leptons. For all possible quadruplet combinations which pass the above selection, a matrix element for the Higgs boson decay is computed at LO using the MadGraph5_aMC@NLO [33]
generator. The quadruplet with the largest matrix element value is selected as the final Higgs boson candidate.
In order to improve the four-lepton mass reconstruction, the reconstructed final-state radiation (FSR) photons in Z boson decays are accounted for using the same strategy as in the Run-1 data analysis [11, 101]. After the FSR correction, the lepton four-momenta of the leading lepton pair are recomputed by means of a Z -mass-constrained kinematic fit. The fit uses a Breit–Wigner Z line shape, and a single Gaussian function per lepton to model the momentum response function for the expected resolution of each lepton. The Z boson mass constraint improves the resolution of the four-lepton invariant mass m
4`by about 15%. The expected mass resolution for the Higgs boson with a mass m
H= 125.09 GeV is 1.6 GeV, 1.7 GeV, 2.1 GeV and 2.4 GeV in the 4 µ , 2 e 2 µ , 2 µ 2 e and 4 e channels, respectively. Finally, to compensate for an increased reducible background due to lowering the muon p
Tthreshold to 5 GeV, the four quadruplet leptons are required to originate from a common vertex point. A requirement corresponding to a signal efficiency of 99.5% is imposed in all decay channels on the χ
2value from the fit of the four lepton tracks to their common vertex.
The Higgs boson candidates within a mass window of 118 GeV < m
4`< 129 GeV are selected to study the properties of the Higgs boson.
5.3 Categorization of reconstructed Higgs boson event candidates
In order to gain sensitivity to different Higgs boson production modes, reconstructed events are classified into several exclusive categories based on the presence of jets and additional leptons in the final state as outlined in Figure 1. The classification of events is performed in the following order. First, events are classified as enriched in the ttH process ( ttH -enriched) by requiring at least one b -tagged jet in the event.
In addition, there must be at least four additional jets or one additional lepton with p
T> 12 GeV together with at least two jets. The additional lepton is required to satisfy the same isolation, impact parameter and angular separation requirements as the leptons in the quadruplet. Events with additional leptons but not satisfying the above jet requirements compose the next category enriched in VH production with leptonic vector boson decays ( VH -Lep-enriched).
The remaining events are classified according to their jet multiplicity into events with no jets, exactly one jet or at least two jets. Among events with at least two jets there are significant contributions from the VBF and VH production modes in addition to ggF. These events are divided into two categories according to the invariant mass m
j jof the two leading jets. The requirement of m
j j≤ 120 GeV enhances the VH production mode with hadronically decaying vector bosons ( VH -Had-enriched). For m
j j> 120 GeV, the VBF Higgs boson signal is enhanced, and these events are further classified according to the transverse momentum of the leading jet into events with p
j1T
below (VBF-enriched- p
jT
-Low) and above 200 GeV (VBF-enriched- p
jT
-High). Events with zero or one jet in the final state are expected to be dominated by the ggF process. Following the particle-level definition of production bins from Section 3.1, the 1-jet category is further split into three categories with the four-lepton transverse momentum p
4`T
smaller than 60 GeV (1 j - p
4`T
-Low), between 60 and 120 GeV (1 j - p
4`T
-Med), and larger than 120 GeV (1 j - p
4`T
-High). The
largest number of ggF events and the highest ggF purity are expected in the zero-jet category (0 j ).
For the tensor structure measurement, the BSM interactions are expected to be more prominent at higher Higgs boson and jet transverse momenta. Thus, in addition to the splitting of events with a VBF-like topology according to p
j1T
, the VH -Had-enriched category is further divided into two categories with four-lepton transverse momentum p
4`T
below and above 150 GeV: VH -Had-enriched- p
4`T
-Low and VH - Had-enriched- p
4`T
-High, respectively.
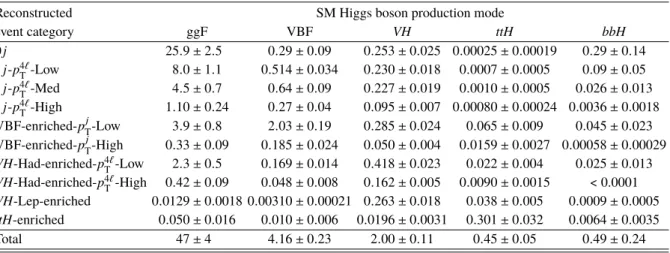
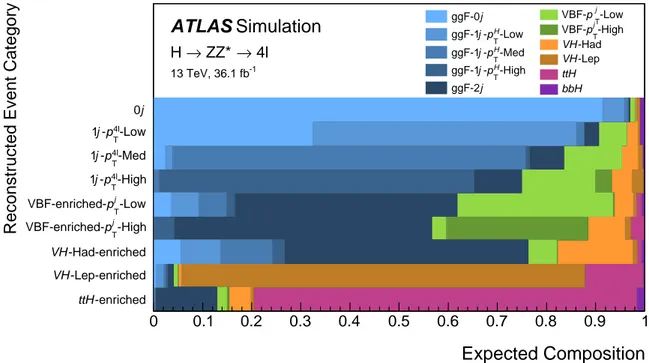
The expected number of signal events is shown in Table 2 for each Stage-0 production bin and separately for each reconstructed event category. The ggF and bbH contributions are shown separately in order to compare their relative contributions, but both are included in the same (ggF) production bin. The highest bbH event yield is expected in the 0 j category since the jets tend to be more forward than in the ttH process, thus escaping the acceptance of the ttH selection criteria. The included systematic uncertainties are detailed in Section 8. The signal composition in terms of the reduced Stage-1 production bins is shown in Figure 2. The separation of contributions from different production bins, such as the sizeable contribution of the ggF-2 j component in reconstructed categories with two or more jets, is further improved by means of boosted decision tree observables, as described in the following.
Table 2: The expected number of SM Higgs boson events with a mass mH =125.09 GeV in the mass range 118 < m4` < 129 GeV for an integrated luminosity of 36.1 fb−1and
√
s=13 TeV in each reconstructed event category, shown separately for each Stage-0 production bin. The ggF andbbHcontributions are shown separately but both contribute to the same (ggF) production bin. Statistical and systematic uncertainties are added in quadrature.
Reconstructed SM Higgs boson production mode
event category ggF VBF VH ttH bbH
0j 25.9±2.5 0.29±0.09 0.253±0.025 0.00025±0.00019 0.29±0.14 1j-p4`
T-Low 8.0±1.1 0.514±0.034 0.230±0.018 0.0007±0.0005 0.09±0.05
1j-p4`
T-Med 4.5±0.7 0.64±0.09 0.227±0.019 0.0010±0.0005 0.026±0.013
1j-p4`
T-High 1.10±0.24 0.27±0.04 0.095±0.007 0.00080±0.00024 0.0036±0.0018 VBF-enriched-pj
T-Low 3.9±0.8 2.03±0.19 0.285±0.024 0.065±0.009 0.045±0.023 VBF-enriched-pj
T-High 0.33±0.09 0.185±0.024 0.050±0.004 0.0159±0.0027 0.00058±0.00029 VH-Had-enriched-p4`
T-Low 2.3±0.5 0.169±0.014 0.418±0.023 0.022±0.004 0.025±0.013 VH-Had-enriched-p4`
T-High 0.42±0.09 0.048±0.008 0.162±0.005 0.0090±0.0015 < 0.0001 VH-Lep-enriched 0.0129±0.0018 0.00310±0.00021 0.263±0.018 0.038±0.005 0.0009±0.0005 ttH-enriched 0.050±0.016 0.010±0.006 0.0196±0.0031 0.301±0.032 0.0064±0.0035 Total 47±4 4.16±0.23 2.00±0.11 0.45±0.05 0.49±0.24
5.4 Additional discriminating observables
In order to further increase the sensitivity of the cross-section measurements in the production bins (Section 3.1), BDT discriminants are introduced in reconstructed event categories with a sufficiently high number of events. The BDTs are trained on simulated samples to distinguish a particular Higgs boson production process from either the background or the other production processes, based on several discriminating observables as summarized in Table 3. It is assumed for the training that all input distributions are governed by the SM predictions.
A BDT discriminant in the 0 j category is built to separate the Higgs boson signal from the non-resonant
Z Z
∗background, relying on the four-lepton transverse momentum and rapidity as well as on the kinematic
discriminant D
Z Z∗[11], defined as the difference between the logarithms of the signal and background
Expected Composition
Reconstructed Event Category
-enriched ttH
-Lep-enriched VH
-Had-enriched VH
-High
j
pT
VBF-enriched-
j-Low pT
VBF-enriched- -High
4l
pT
- j 1
4l-Med pT
- j 1
4l-Low pT
- j 1
j 0
0 0.1 0.2 0.3 0.4 0.5 0.6 0.7 0.8 0.9 1
j ggF-0
H-Low pT
- j ggF-1
H-Med pT
- j ggF-1
-High
H
pT
- j ggF-1 j ggF-2
j-Low p T
VBF- -High
j
pT
VBF- -Had VH
-Lep VH ttH bbH
ATLAS Simulation
→ 4l ZZ*
→ H
13 TeV, 36.1 fb-1
Figure 2: Signal composition in terms of the reduced Stage-1 production bins in each reconstructed event category.
The ggF andbbHcontributions are shown separately but both contribute to the same (ggF) production bin.
Table 3: The BDT discriminants and their corresponding input variables used for the measurement of cross sections per production bin. The jets are denoted by “j”. See the text for variable definitions.
Reconstructed event category BDT discriminant Input variables
0 j BDT
ggFp
4`T
, η
4`, D
Z Z∗1 j - p
4`T
-Low BDT
1j-p4`
T -Low
VBF
p
jT
, η
j, ∆R( j, 4 `) 1 j - p
4`T
-Med BDT
1j-p4`
T -Med
VBF
p
jT
, η
j, ∆R( j, 4 `) 1 j - p
4`T
-High - -
VBF-enriched- p
jT
-Low BDT
VBFm
j j, ∆ η
j j, p
j1T
, p
j2T
, η
∗4`
, ∆R
minj Z, (p
4`j jT
)
constrainedVBF-enriched- p
jT
-High - -
VH -Had-enriched BDT
V H-Hadm
j j, ∆ η
j j, p
j1T
, p
j2T
, η
∗4`
, ∆R
minj Z, η
j1VH -Lep-enriched - -
ttH -enriched - -
matrix elements squared. In the two 1-jet categories with p
4`T
below 120 GeV, a BDT discriminant combining information about the jet transverse momentum ( p
jT
), rapidity ( η
j) and angular separation between the jet and the four-lepton system ( ∆R( j, 4 `) ) is introduced to distinguish between ggF and VBF Higgs boson production. In the VBF-enriched- p
jT
-Low ( VH -Had-enriched) category, the separation of the VBF ( VH ) from ggF (ggF and VBF) production mechanism is achieved by means of the following input variables: m
j j, pseudorapidity separation ( ∆ η
j j) and transverse momenta of the two leading jets ( p
j1T
and p
j2T
), the difference between the pseudorapidity of the four-lepton system and the average pseudorapidity of the two leading jets ( η
∗4`
), as well as the minimum angular separation between the leading lepton pair and the two leading jets ( ∆R
minj Z). In addition, the pseudorapidity of the leading jet ( η
j1) is used as an input in the VH -Had-enriched category, while the constrained transverse momentum of the Higgs–dijet system, defined as (p
4`j jT
)
constrained= p
4`j jT
(50 GeV) for p
4`j jT
> 50 GeV ( p
4`j jT
< 50 GeV) is employed for the VBF- enriched category. The transverse momentum p
4`j jT
of the Higgs–dijet system below 50 GeV is replaced by the minimum value of p
4`j jT
= 50 GeV in order to reduce the QCD scale variation uncertainty.
The BDT discriminants improve the expected cross-section measurement statistical uncertainties by 15%, 35% and 25% for the ggF, VBF and VH Stage-0 production bins, respectively.
6 Signal modelling
The observables used for the measurements of the cross sections in the production bins introduced in Section 3 are BDT discriminants for five of the selected reconstructed event categories, described in Section 5.4, together with event yields for the remaining four event categories. For the SM Higgs boson signal, the shapes of the BDT distributions and the fractions of events in each category are predicted using simulation.
No BDT discriminants are used for the measurement of the tensor structure of the Higgs boson couplings.
This measurement is based on event yields in the ten event categories introduced in Section 5. A dedicated signal model is introduced to describe the impact of BSM contributions. The model is based on a morphing technique [102] which provides a parameterization to evaluate the signal response as a function of the BSM coupling parameters. The expected number of signal events n
S( ® κ
target) at a given target point in the BSM parameter space, defined by a set of BSM coupling values κ ®
target≡ {κ
SM, κ
BSM_1, .., κ
BSM_n} , is obtained by
n
S( ® κ
target) = Õ
i
w
i( ® κ
target, κ ®
i) · n
S( ® κ
i).
This corresponds to a linear weighted ( w
i( ® κ
target, κ ®
i) ) combination of a minimal set of base inputs n
S( ® κ
i) , with coupling values κ ®
i= {κ
iSM
, κ
iBSM_1
, .., κ
iBSM_n
} for each input i selected in such a way as to span the
full coupling parameter space. The functional form of the weight w
iand the value assigned to each input
is defined by the coupling structure of the BSM signal matrix element as described in Ref. [102]. The
inputs for the ggF, VBF and VH production processes are obtained from the simulation samples described
in Section 4. The values κ
ifor each input sample are chosen to cover most parts of the interesting BSM
parameter space and to therefore ensure a reasonably small statistical uncertainty for any target point
in the BSM parameter space within the range of coupling values under study. These samples are then
used to predict the expected variations of event yields in each reconstructed event category relative to the
SM prediction. The limited number of events in the simulated BSM samples is estimated to impact the
measurement results by less than 5%. In combination with all other systematic uncertainties, the impact
on the final result is negligible in the couplings range under study. Therefore, this uncertainty is not taken into account in the results presented in Section 9. Since the BSM input samples were generated with the SM value Γ
SMfor the total decay width of the Higgs boson, an additional correction corresponding to ratio of the total width with BSM to the SM width is applied to the σ · B(H → Z Z ) value for the samples with non-vanishing BSM coupling parameters. The correction is of the order of − 11% for κ
Agg= ± 0.8,
− 2% for κ
AVV= ± 8 and about +14% ( − 17%) for κ
HVV= − 8 (+8).
The ttH and bbH BSM processes are not simulated. Since the Higgs boson coupling to top or bottom quarks in the effective coupling to gluons is included in κ
H ggand κ
Agg, and there is little sensitivity to ttH production in the H → Z Z
∗→ 4 ` channel, it is assumed that the production vertex of the ttH and bbH processes is not affected by the BSM parameters. The impact of the BSM parameters on the Higgs boson decay is accounted for by scaling the corresponding decay branching ratio. The BSM parameters also affect B(H → Z γ) and B(H → γγ) but the impact on the signal model predictions is found to be negligible and is not considered in the analyses.
7 Background contributions
The main source of background in the H → Z Z
∗→ 4 ` decay channel is non-resonant Z Z
∗production with the same final state as the signal. This process, as well as a minor contribution from t tV ¯ and triboson production, is modelled using simulation normalized to the highest-order SM prediction available.
Additional reducible background sources are the Z +jets, t t ¯ and WZ processes whose contributions in the signal region (SR) are estimated using dedicated signal-depleted control regions (CRs) in data, separately for events with different flavours of the subleading lepton pair (i.e. `` + µµ or `` + ee , where `` denotes the leading and µµ or ee the subleading lepton pair). No requirement is imposed on the four-lepton invariant mass in the control data. The backgrounds are first estimated for the inclusive event selection, i.e. prior to event categorization, and then divided into separate contributions in each reconstructed event category.
7.1 Background estimation for the inclusive selection
The reducible `` + µµ background with at least one jet containing a muon from secondary decays of pions/kaons or heavy-flavour hadrons originates from Z +jets, t¯ t and WZ production. The Z +jets background comprises a heavy-flavour ( Z +HF) component containing jets with b - or c -quark content and a light-flavour ( Z +LF) component from pion or kaon decays. These components of the Z +jets background and the t t ¯ contribution are extracted using orthogonal CRs formed by relaxing the χ
2requirement on the vertex fit, and by inverting or relaxing isolation and/or impact parameter requirements on the subleading muon pair. In these regions an unbinned maximum-likelihood fit to m
12is performed. The numbers of t t ¯ , Z +HF and Z +LF events estimated in these CRs are each extrapolated to the SR using a simulation-based transfer factor which depends on the efficiency of the isolation and impact parameter selection criteria.
The contribution from WZ production is estimated using simulation.
The reducible `` + ee background originating mainly from the Z +jets, t t ¯ and WZ production is classified
into processes with misidentified jets faking an electron ( f ), electrons from photon conversions ( γ ) and
electrons from semileptonic decays of heavy quarks ( q ). The contribution of the q component is obtained
from simulation, while the f and the γ components are obtained from the 3 ` + X CR containing 2 µ 2 e
and 4 e final states. In this CR, three leptons pass the full analysis selection, while the most probable
candidate for a fake electron, the lowest- E
Telectron (denoted by X ) in the subleading electron pair, has only the track hit requirement of the electron identification applied. In order to suppress the Z Z
∗contribution, only electrons with same-sign charge are considered for the subleading electron pair in this CR. A template fit to the number of track hits ( n
InnerPix) in the innermost or next-to-innermost
2pixel layer for the associated track is used to separate the γ and f background components. The templates for the γ and f background contributions are obtained from simulated Z + X events with an on-shell Z boson decay candidate accompanied by an electron X selected using the same criteria as in the 3 ` + X CR. The simulated Z + X events are also used to obtain the efficiencies needed to extrapolate the f and γ background contributions from the CR to the SR, after correcting the simulation to match the data in dedicated control samples of Z + X events.
7.2 Background estimation per reconstructed event category
The background event yields and BDT output distributions are determined separately for each event category. The reducible `` + ee background normalization is obtained by applying the data-driven approach described above for the inclusive sample in each separate category. The fraction of the reducible
`` + µµ background per category with respect to the inclusive yield is obtained from simulation, separately for the Z +jets and t t ¯ background. The `` + µµ simulation was checked against data in CRs with relaxed selection criteria and is found to predict the fraction of reducible background events in each category well within the statistical uncertainty.
Since the data-driven background estimates provide the event yields for the full m
4`range, the effect of the m
4`mass window requirement has to be taken into account. For this purpose, the m
4`distributions of reducible backgrounds in each category are smoothed with the kernel density estimation method [103] and then integrated to obtain the fraction of events within the mass window. The yields of the backgrounds in each category are shown in Table 4, together with the associated systematic uncertainties. Three sources of uncertainty are considered. First, the systematic uncertainty of the inclusive background estimate from the determination of the selection efficiencies related to the lepton identification, isolation and impact parameter significance. This uncertainty is evaluated by comparing data with an on-shell Z boson decay candidate accompanied by an electron or a muon to the simulation. Second, the inclusive background estimate has also a relatively small (4%) statistical uncertainty from the control data. The total uncertainty of the inclusive reducible background estimate from both of these sources is considered as correlated across the experimental categories. Third, there is an additional uncorrelated uncertainty in the fraction of the reducible background in each experimental category due to the statistical precision of the simulated samples.
The shapes of the BDT discriminant distributions for the reducible background are determined from simu- lation by combining the simulated t t ¯ and Z +jets distributions according to the relative fractions measured in data. To increase the statistical precision of the simulated samples, the isolation requirements and m
4`range are relaxed. The mass window requirement is relaxed in the 0 j category to 115 < m
4`< 130 GeV and to 110 < m
4`< 200 GeV for all other categories. Instead of both leptons, at least one lepton in the subleading pair is required to meet the isolation criteria. These looser selection criteria have no impact on the shape of the BDT distributions. The statistical precision of the simulated samples and the uncertainty in the relative fractions of Z +jets and t¯ t contributions are taken into account as systematic shape variations.
2A hit in the next-to-innermost pixel layer is used when the electron falls in a region that is either not instrumented with an IBL module or the IBL module is not operating.
Table 4: Estimates of reducible background yields in each reconstructed event category in the signal region for 36.1 fb−1 at
√
s =13 TeV, together with the associated correlated and uncorrelated systematic uncertainties. The total error in each category is composed of the combined statistical and systematic uncertainty of the inclusive background estimate, as well as an additional statistical uncertainty in the fraction of the reducible background in each category. The uncertainty due to the inclusive background estimate is considered as correlated (penultimate column), while the statistical uncertainty due to the event categorization (last column) is uncorrelated across the reconstructed event categories.
Reconstructed Reducible background Uncertainty
event category ``+µµ ``+ee Total Corr. Uncorr.
0j 0.96±0.21 1.25±0.23 2.21±0.33 ±13% ±7%
1j-p4T`-Low 0.21±0.05 0.30±0.06 0.52±0.08 ±13% ±10%
1j-p4`
T-Med 0.19±0.12 0.16±0.04 0.35±0.13 ±13% ±40%
1j-p4`
T-High 0.0049±0.0025 0.036±0.008 0.041±0.009 ±13% ±18%
VBF-enriched-pj
T-Low 0.14±0.04 0.128±0.025 0.27±0.05 ±13% ±15%
VBF-enriched-pj
T-High 0.019±0.010 0.018±0.004 0.037±0.009 ±13% ±28%
VH-Had-enriched-p4`
T-Low 0.057±0.015 0.067±0.015 0.124±0.021 ±13% ±14%
VH-Had-enriched-p4`
T-High 0.0035±0.0023 0.011±0.004 0.015±0.004 ±13% ±34%
VH-Lep-enriched 0.003±0.004 0.0005±0.0008 0.0031±0.0031 ±13% ±100%
ttH-enriched 0.009±0.004 0.022±0.005 0.031±0.007 ±13% ±22%
8 Systematic uncertainties
The systematic uncertainties in this analysis are grouped into experimental and theoretical uncertainties.
The first category includes uncertainties in the modelling of lepton and jet reconstruction, identification efficiencies, energy resolution and scale, and in the total integrated luminosity. Uncertainties from the procedure used to derive the data-driven background estimates are also included in this category. The second category includes uncertainties in the theoretical modelling of the signal and the background processes.
The uncertainties can affect the signal acceptance, efficiency and discriminant distributions as well as the background estimates. The dominant sources of uncertainty and their effect are described in the following subsections. The impact of these uncertainties on the cross-section measurements in different production bins is summarized in Table 5.
8.1 Experimental uncertainties
The uncertainty in the combined 2015+2016 integrated luminosity is 3.2%. It is derived, following a methodology similar to the one described in Ref. [104], from a preliminary calibration of the luminosity scale using x – y beam-separation scans performed in August 2015 and May 2016.
The uncertainty in the predicted yields due to pile-up modelling is about 2% and is derived by varying the
average number of pile-up events in the simulation to cover the uncertainty in the ratio of the predicted to
measured inelastic cross sections [105].
Table 5: Impact of the dominant systematic uncertainties (in percent) on the measured inclusive and the Stage-0 production mode cross sectionsσ·B(H→Z Z∗). Signal theory uncertainties include only acceptance effects and no uncertainty in predicted cross sections.
Experimental uncertainties [%] Theory uncertainties [%]
Production Lumi e,µ, Jets, flavour Higgs Reducible Z Z∗ Signal theory bin pile-up tagging mass backgr. backgr. PDF QCD scale Shower Inclusive cross section
4.1 3.1 0.7 0.8 0.9 1.9 0.3 0.8 1.2 Stage-0 production bin cross sections
ggF 4.3 3.4 1.1 1.2 1.1 1.8 0.5 1.8 1.4
VBF 2.6 2.7 10 1.3 0.9 2.2 1.6 11 5.3
VH 3.0 2.7 11 1.6 1.7 5.9 2.1 12 3.7 ttH 3.6 2.9 19 <0.1 2.4 1.9 3.3 7.9 2.1