ATLAS-CONF-2013-030 13/03/2013
ATLAS NOTE
ATLAS-CONF-2013-030
March 11, 2013
Measurements of the properties of the Higgs-like boson in the WW
(∗)→ ℓνℓν decay channel with the ATLAS detector using 25 fb
−1of
proton-proton collision data
The ATLAS Collaboration
Abstract
Evidence for the Higgs-like boson in the H→WW(∗)→ℓνℓνchannel is presented using the complete 2012 and 2011 data samples collected with the ATLAS detector at the LHC.
The samples correspond, respectively, to an integrated luminosity of 20.7 fb−1at a centre- of-mass energy of 8 TeV and 4.6 fb−1at 7 TeV. The analysis focuses on such a boson in the Standard Model with a mass of mH=125 GeV, where an excess over the expected number of background events is observed. The significance of the excess is 3.8 standard deviations; the expected value is 3.7. The ratio of the observed and expected numbers of events is consistent with unity,µ=1.01±0.31. The case where the signal is accompanied by two or more jets is optimised for the vector boson fusion production process, and the significance of the excess is 2.5 standard deviations; the expected value is 1.6. The product of the Higgs boson cross section at 8 TeV and the branching ratio to WW(∗) is measured to be 6.0±1.6 pb; the expected value is 4.8±0.7 pb.
c Copyright 2013 CERN for the benefit of the ATLAS Collaboration.
Reproduction of this article or parts of it is allowed as specified in the CC-BY-3.0 license.
1 Introduction
In the Standard Model (SM) of particle physics, the Englert-Brout-Higgs mechanism of electroweak symmetry breaking gives mass to all massive elementary particles and predicts the Higgs boson [1–3].
In the summer of 2012, the ATLAS and CMS experiments discovered a Higgs-like boson with a mass of approximatelymH=126 GeV [4, 5]. The current experimental focus is on the measurement of its properties: the spin and the couplings to elementary bosons and fermions.
This note presents the evidence of the SM Higgs-like boson in the H→WW(∗)→ℓνℓν channel (ℓ=e, µ) using the complete data samples of 2012 and 2011 taken at √
s=8 and 7 TeV, respectively, collected with the ATLAS detector at the LHC. The channel provides input to the overall production rate and the couplings to weak bosons. The analysis techniques are based on an earlier study of the eνµν final state with no accompanying jet or one accompanying jet (Njet≤1) [6]. For the results presented in this note, many aspects of the analysis were improved and optimised for a signal with a mass ofmH=125 GeV. This signal mass is assumed throughout the note, unless stated otherwise.
The analysis expands the scope of the production mode and the decay channels. The former is the vector boson fusion (VBF) production of the signal accompanied by at least two jets (Njet≥2) from the quarks emitting the bosons. The latter are theeνeνandµνµνchannels.
The note is organised as follows: Section 2 describes the data and the simulated samples. Sec- tion 3 presents the analysis method, introducing the background sources and the key variablesmTand mℓℓ. Section 4 details the estimation of the backgrounds yields. Section 5 presents the systematic uncertainties. The focus of the note is on the analysis of the 8 TeV data, but the analysis of the 7 TeV data is briefly described in Section 6. Section 7 presents the evidence for the Higgs-like boson and the associated measurements. Section 8 states the conclusions.
2 Data and simulated samples
The data samples used for this analysis were collected using the ATLAS detector, a multi-purpose particle physics experiment with a forward-backward symmetric cylindrical geometry and near 4π coverage in solid angle. The detector is described in detail elsewhere [7].
The data samples were triggered requiring at least a muon or an electron with pT>24 GeV that are loosely isolated. The lepton trigger efficiencies are measured usingZ candidates as a function of pT and pseudorapidity η. The efficiencies for the leptons used in this analysis, selected as de- scribed in Section 3, are approximately 70% for muons with|η|<1.05, 90% for muons in the range 1.05<|η|<2.4, and 90% for the electrons.
In this analysis, the signal contributions considered include the dominant gluon-gluon fusion pro- duction process (gg→H, denoted as ggF),the vector-boson fusion production process (qq′→qq′H, denoted as VBF) and the Higgs-strahlung process (qq′→W H,ZH, denoted as V H). Thet¯tH pro- duction mechanism is negligible due to its smaller cross section. Only the H→WW(∗)→ℓνℓν(with ℓ=e, µ) channels are considered, which include the small contributions from leptonicτdecays. The branching fraction for the decay as a function ofmHis calculated using P4[8,9] with H
used to calculate the total width [10].
The ggF signal cross section is computed up to next-to-next-to-leading order (NNLO) in QCD [11–
16] Next-to-leading order (NLO) electroweak (EW) corrections are also applied [17, 18], as well as QCD soft-gluon resummations up to next-to-next-to-leading log (NNLL) [19]. These calculations are detailed in Refs. [20–22], and assume factorisation between the QCD and EW corrections. The VBF signal cross section is computed with approximate NNLO QCD corrections [23] and full NLO
Table 1: Monte Carlo generators used to model the signal and background processes in which all of theWandZ decay channels are included in the corresponding product of the cross section (σ) and branching fraction (B) at √
s=8 TeV. Masses are given in units of GeV. Details are given in the text.
Signal MC generator σ· B(pb) ggF P[30]+P8 [31] 0.44 VBF P+P8 0.035
V H P8 0.13
Background MC generator σ· B(pb)
q¯q,gq→WW P+P6 [32] 5.7 q¯q,gq→WW+2j Sherpa [33] with noO(αs) terms 0.039 gg→WW GG2WW 3.1.2 [34, 35]+H[36] 0.16
tt¯ MC@NLO [37]+H 240
Single top:tW,tb MC@NLO+H 28
Single top:tqb AcerMC [38]+P6 88
Z/γ∗, inclusive A+H 16000
Z(∗)→ℓℓ+2j Sherpa processes up toO(αs) 1.2 Z(∗)Z(∗)→4ℓ P+P8 0.73 WZ/Wγ∗,mZ/γ∗>7 P+P8 0.83 Wγ∗,mγ∗≤7 MadGraph [39–41]+P6 11
Wγ A+H 370
QCD and EW corrections [24–26]. The cross sections of the associatedV Hproduction processes are calculated up to NNLO QCD corrections [27, 28] and NLO EW corrections [29].
The Monte Carlo (MC) generators used to model signal and background processes are listed in Table 1. The number quoted for the inclusive Drell-Yan process (DY),Z/γ∗, is for a range of the invariant mass of the two lepton system that excludes the low-mass region,mℓℓ<10 GeV. Kinematic criteria are also applied in the event generation ofWγ, whereW→ℓν, andWγ∗, whereW→ℓνand γ∗→ℓℓ. ForWγ events, the photon must have pT>8 GeV and be separated from the charged lepton by∆R=((∆η)2+(∆φ)2)1/2>0.25. ForWγ∗, at least two leptons must have pT>5 GeV and |η|<3 foree+µµ, and|η|<5 forττ. (ThepTdenotes the transverse momentum with respect to the beam line.) Additionally,mℓℓ>2me is required. (This note follows the convention that the invariant mass of the dilepton system is denoted asmℓℓfor the dilepton system and similarly for composite systems;
the masses of elementary particles are denoted asme for electron,mZforZboson, etc.) Interference between theZ(∗)and theγ∗is included forWZ(∗)andWγ∗, and the boundary between the samples is at mℓℓ=7 GeV. ForWZ(∗)a filter requiring at least two charged leptons withpT>5 GeV and|η|<2.8 is also applied. TheZ(∗)Z(∗)→4ℓprocesses are generated with amℓℓ>4 GeV selection. Leptonic decays ofW orZ are assumed with the exception of the V H processes, which include allW andZdecays.
The quoted cross sections include the branching ratios and are summed over lepton flavours except for the top quark production for which the inclusive cross section is quoted.
For most processes, separate programs are used to generate the hard scattering process and to model the parton showering (PS), hadronisation, and the underlying event (UE). P8 [31] or P6 [32] are used for the latter three steps for the signal and some of the background processes.
When H[36] is used for the hadronisation and PS, the UE is modelled using J[42]. The W+jets, Z/γ∗+jets and Wγ processes are described using the A+H generator with the MLM matching scheme described in Ref. [43]. In addition, Sherpa [33] is used for both the hard- scattering process and the parton shower modelling for VBF processes with noO(αs) terms, such as qq→Zqqand non-resonantqq→W+W−qq.
The cross sections for theWγ andWγ∗ processes are normalised to the MCFM [44] NLO pre- dictions. These normalisation factors (K-factors) are calculated to be 1.15 forWγand 2.01 forWγ∗. The K-factor for Wγ∗ is calculated for the phase space criteria 0.5<mℓℓ<7 GeV, pleadT >25 GeV,
psubleadT >15 GeV, and|ηℓ|<2.5, wherepleadT andpsubleadT refer to the transverse momenta of the lead- ing and subleading leptons, respectively.
The parton distribution function (PDF) set from CT10 [45] is used for the Pand MC@NLO samples, and CTEQ6L1 [46] is used for the A, MadGraph, and P6/P8 samples. Ac- ceptances and efficiencies are obtained from a full simulation [47] of the ATLAS detector using G4 [48]. In two exceptional cases (qq, gq¯ →WW and single top processes), fast simulation is used to increase MC statistics. The simulation incorporates a model of the event pile-up conditions in thecollected data, including both the effects of multiple ppcollisions in the same bunch crossing (denoted as in-time pile-up) and in the nearby bunch crossings (denoted as out-of-time pile-up).
3 Event selection
The analysis in Ref. [49] selected H→WW(∗)→eνµν candidates with either no accompanying jet or one accompanying jet (Njet≤1). In the present analysis, the selection of these candidates is un- changed. Additional decay channels are added by including theeνeνandµνµνfinal states, and sen- sitivity to the VBF production mode is obtained by adding candidates withNjet≥2. Finally, overall sensitivity is gained by nearly a two-fold increase in statistics.
Basic data quality criteria are applied and a primary vertex is selected as described in Ref. [49].
Two leptons with opposite charge are required; the leading lepton is required to havepT>25 GeV and the subleading lepton is required to have pT>15 GeV. For theeµ+µechannel, contributions from low-mass γ∗→ττ→eνµνare rejected with mℓℓ>10 GeV. Similiarly, for the ee+µµ channel low- massγ∗→ℓℓis rejected withmℓℓ>12 GeV andZ→ℓℓwith|mℓℓ−mZ|>15 GeV. (This note uses the notationeµ+µeandee+µµfor the decay channels, where the first symbol denotes the lepton with a higherpT.) The requirements above will be referred to as the “pre-selection” in the rest of this note.
3.1 Leptons
Electron candidates are selected by applying a set of tight identification criteria using a combination of tracking and calorimetric information. The fine lateral and longitudinal segmentation of the calorime- ter and the transition radiation detection capability of the ATLAS detector have allowed the previous levels of electron performance [50] to be retained in the increased pile-up environment of the 8 TeV data. The electrons are required to be in the range of|η|<2.47 excluding 1.37<|η|<1.52, which contains the transition region between barrel and endcap calorimeters. Muon candidates are identified by matching tracks reconstructed in the inner detector and in the muon spectrometer [51]. The muons are required to be in the range|η|<2.5. At least one of the lepton candidates must match a trigger object.
Track-based and calorimeter-based isolation criteria [49] are applied to both lepton candidates to further suppress backgrounds fromW+jets and multi-jet production.
3.2 Jets
Jets are reconstructed using the anti-ktalgorithm with distance parameterR=0.4 [52]. The jet energy dependence on in-time pile-up is mitigated by applying two data-derived corrections: one based on the product of the eventpTdensity and the jet area [53], and another that depends on the number of reconstructed primary vertices and the mean number of expected interactions, which primarily affects jets in the forward region. The second correction also addresses the effects of out-of-time pile-up.
After the two corrections, energy- andη-dependant MC calibration (typically 40% and ranging from
15% to 100% depending on theη) is applied to all jets. Finally, a residual correction from in situ measurements (typically a few percent) is applied to refine the jet calibration [54].
The jets are required to have pT>25 GeV if|η|<2.4 and pT>30 GeV for 2.4<|η|<4.5. The increased threshold in the forward region reduces the contribution from fake jets produced by pile-up.
For theNjet≥2 analysis, jets with pT>20 GeV satisfying the JVF requirement, described below, are used in the event selection. Details are discussed later in Section 3.4.
The jet vertex fraction (JVF) is used to reduce the contribution of fake jets from pile-up. It is a ratio computed using charged-particle tracks matched to the jet: the ratio is the sum of the pT of tracks matched to the jet that originate from the primary vertex divided by the sum pT of all tracks matched to the jet. The requirement is|JVF|>0.5 for jets withpT<50 GeV. Since it relies on tracking information, JVF is only applied to jets with|η|<2.4. The JVF performance is shown in Ref. [49].
The number of jets identified by a b-tagging algorithm (Nb-jet) are used for the Njet=1 and ≥2 analyses. These are discussed later in Sections 3.4, 4.3, and 5.3.
3.3 Missing transverse momentum and hadronic recoil
Drell-Yan and multi-jet events are suppressed by requiring large missing transverse momentum [55].
The quantity EmissT is the magnitude ofEmissT , the negative vectorial sum pT of the muons, electrons, photons, jets, and clusters of calorimeter cells not associated with these objects. (In this note, EmissT refers to its variants depending on context.) Different selection criteria based onEmissT are used de- pending on the decay channel and jet multiplicity. Variants ofETmissare used to deal with the varying pile-up conditions and background composition for the decay channel and jet multiplicity.
3.3.1 Emiss
T selection
For candidates in the Njet≤1 modes, a requirement is made on EmissT,rel[49], a relative quantity that is the product of the magnitude ofEmissT and a projection factors. The sis either sin|∆φclosest|, where
∆φclosest is the azimuthal angle between EmissT and the closest high-pT charged lepton or jet in the transverse plane in the same azimuthal hemisphere, or unity if no such object is present in the event.
Figure 1a shows theEmissT,reldistribution after the pre-selection requirements but without the selection on EmissT,rel itself. The Njet=0 and =1 eµ+µe channels are shown. Due to a large amount of DY background with fakeETmiss in events with many pile-up interactions, especially for the 8 TeV data, additional variables are used to further reduce the DY background. An alternative measurement of the missing transverse momentum is obtained using inner detector tracks (pmissT ). Impact parameter and track quality requirements are used to select tracks from the primary interaction. The resolution of this track-based quantity is less sensitive to pile-up interactions than the calorimeter-basedETmiss. The quantitypmissT is modified topmissT,relas was done forET,relmiss. Figure 1b shows thepmissT,reldistribution after the pre-selection and the requirement onEmissT,rel(see Table 2). The Njet=0 and=1 ee+µµchannels are shown.
The Njet≥2 analysis uses EmissT andET,STVFmiss . ET,relmiss is not used because the large number of jets reduces the signal efficiency for this criterion. For theee+µµchannels an additional requirement is made onEmissT,STVF in which the soft calorimeter deposits unassociated with high-pTobjects are scaled by the soft term vertex fraction. This fraction is the ratio of the scalar sum pT of tracks from the primary vertex unmatched to objects to the scalar sumpTof all tracks in the event also unmatched to objects [56]. The combination of the high level of hadronic activity from the extra jets coming from the hard interaction in addition to the high pile-up conditions makesEmissT,STVF a better variable than
[GeV]
T,rel
Emiss
0 50 100 150 200 250
Events / 5 GeV
10-2
10-1
1 10 102
103
104
105
106
107
Data SM (sys ⊕ stat)
WW WZ/ZZ/Wγ
t
t Single Top
Z+jets W+jets H [125 GeV]
ATLAS Preliminary
Ldt = 20.7 fb-1
∫
= 8 TeV, s
+ 0/1 jets ν νe µ ν/ µ ν
→e WW(*)
→ H
(a)EmissT,relforNjet≤1,eµ+µe
[GeV]
T,rel
pmiss
0 50 100 150 200 250
Events / 5 GeV
10-2
10-1
1 10 102
103
104
105
106 Data WW SM (sys WZ/ZZ/W⊕γ stat)
t
t Single Top
Z+jets W+jets H [125 GeV]
ATLAS Preliminary
Ldt = 20.7 fb-1
∫
= 8 TeV, s
+ 0/1 jets ν µ ν µ ν/ νe
→e WW(*)
→ H
(b)pmissT,relforNjet≤1,ee+µµ
[GeV]
T,STVF
Emiss
0 20 40 60 80 100 120 140 160 180 200
Events / 5 GeV
10-2
10-1
1 10 102
103
104
105
106
Data SM (sys ⊕ stat)
WW WZ/ZZ/Wγ
t
t Single Top
Z+jets W+jets
ggf vbf+vh
ATLAS Preliminary
Ldt = 20.7 fb-1
∫
= 8 TeV, s
≥ 2 j ν + µ ν µ ν/ νe
→e WW(*)
→ H
(c)EmissT,STVFforNjet≥2,ee+µµ
recoil
f 0 0.1 0.2 0.3 0.4 0.5 0.6 0.7 0.8 0.9
Entries normalised to 1
10-2
10-1
1
Z+jets
diboson, top and W+jets H[125 GeV]
ATLASPreliminary = 8 TeV, simulation s
+ 0 jets ν µ ν µ ν/ νe
→e WW(*)
→ H
(d)frecoilforNjet=0,ee+µµ
Figure 1: Missing transverse momentum distributions for events after pre-selection for (a)ET,relmiss for Njet≤1, (b) pmissT,rel for Njet≤1, and (c) EmissT,STVF for Njet≥2 modes. The plot in (b) is made after the requirement on ET,relmiss and the one in (c) after the requirement on ETmiss. The plot in (d) shows the frecoildistribution inee+µµevents passing theNjet=0 selection aftermℓℓ<50 GeV for simulated DY, non-DY and signal processes. The shaded area (too small to be visible in these figures) represents the uncertainty on the signal and background yields from statistical, experimental, and theoretical sources. The signal is overlaid as a red curve in (a) and (b); in (c), the ggF signal is stacked at the bottom while the VBF signal is overlaid as a thick black line. Selections are listed in Table 2. Details are given in Section 3.3.
pmissT for this particular case. Figure 1c shows theEmissT,STVFdistribution after the pre-selection and the requirement onEmissT (see Table 2). TheNjet≥2,ee+µµchannels are shown.
3.3.2 Soft hadronic recoil in Drell-Yan events
The DY background is further reduced by requirements on frecoil, a measurement of the soft hadronic recoil opposite the system of the leptons and any accompanying jet for Njet≤1. This quantity is defined for theNjet=0 mode as the ratio of the recoil momentum andpℓℓT, wherepℓℓT =pℓ1T +pℓ2T. For the Njet=1 mode, pℓℓTj is used in place of pℓℓT, wherepℓℓT j=pℓℓT +pTj. The recoil momentum is the
Njets
0 2 4 6 8 10
Events
0 2000 4000 6000 8000 10000 12000 14000 16000 18000 20000
22000 Data SM (sys ⊕ stat)
WW WZ/ZZ/Wγ
t
t Single Top
Z+jets W+jets H [125 GeV]
ATLAS Preliminary
Ldt = 20.7 fb-1
∫
= 8 TeV, s
ν νe µ ν/ µ ν
→e WW(*)
→ H
(a)Njetdistribution foreµ+µe
Njets
0 2 4 6 8 10
Events
0 5000 10000 15000 20000 25000
Data SM (sys ⊕ stat)
WW WZ/ZZ/Wγ
t
t Single Top
Z+jets W+jets H [125 GeV]
ATLAS Preliminary
Ldt = 20.7 fb-1
∫
= 8 TeV, s
ν µ ν µ ν/ νe
→e WW(*)
→ H
(b)Njetdistribution foree+µµ
Figure 2: Jet multiplicity for events in 8 TeV data. The plots are shown for the (a) eµ+µe and (b) ee+µµchannels after pre-selection andEmissT,rel>25 GeV and>45 GeV, respectively. The signal is too small to be seen. The shaded area represents the uncertainty on the signal and background yields from statistical, experimental, and theoretical sources.
vectorial sum pT of the low-pT jets in the φquadrant oppositepℓℓT for Njet=0 andpℓℓTj forNjet=1.
Low-pT jets are defined as those with pT>10 GeV and below the previously mentioned nominal thresholds. Each low-pT jet is weighted by its JVF value. The frecoil distribution of DY events is distinct from that of non-DY processes, because of the different topology of DY and other events in the dilepton sample. The dilepton system in DY events is balanced by soft hadronic activity, resulting in large values of frecoil, whereas the dilepton system in WW, top, signal, and similar processes is balanced by a combination of recoiling neutrinos and soft hadronic activity, which results in small values of frecoil. Figure 1d shows the frecoil distributions for DY, non-DY and signal processes in simulated events.
3.4 Analyses categorised in Njet
The signal selection strategy depends on the jet multiplicity (Njet) as do the rate and the composition of the backgrounds. ForNjet≤1 the signal originates almost entirely from the ggF process andWW events dominate the background composition. ForNjet≥2 the signal is mostly from the VBF process andtt¯events dominate the background. Figures 2a and 2b show the multiplicity distribution of jets in theeµ+µeandee+µµchannels for all events satisfying pre-selection described and the requirement onEmissT,rel(see Table 2).Table 2 summarises the selection described in this section.
For all jet multiplicities, a set of topological selections takes advantage of the configuration of the two leptons. The leptons emerge in the same direction due to the spin correlations ofH→WW(∗) decay and the V−Astructure of theW decay. The leptons’ invariant mass is required to be small, mℓℓ<50 GeV forNjet≤1 andmℓℓ<60 GeV forNjet≥2, and their azimuthal gap is also required to be small, |∆φℓℓ|<1.8 radians. The distributions of mℓℓ andmT are used to extract the signal strength;
these variables are introduced later in Section 3.5.
The analysis is divided intoNjet=0, =1, and ≥2. In theNjet=0 analysis, the following criteria improve the rejection of the DY background and multi-jet background. The missing transverse mo- mentum is required to be large. Foreµ+µe, the selection isET,relmiss>25 GeV. Foree+µµ, the selection is tighter,EmissT,rel>45 GeV and pmissT,rel>45 GeV, because of the large DY background fromZ/γ∗→ℓℓ.
[GeV]
mll
50 100 150 200 250
Events / 10 GeV
0 100 200 300 400 500 600 700
800 Data SM (sys ⊕ stat)
WW WZ/ZZ/Wγ
t
t Single Top
Z+jets W+jets H [125 GeV]
ATLAS Preliminary
Ldt = 20.7 fb-1
∫
= 8 TeV, s
+ 0 jets ν νe µ ν/ µ ν
→e WW(*)
→ H
(a)mℓℓforNjet=0,eµ+µe
[GeV]
mll
50 100 150 200 250
Events / 10 GeV
0 100 200 300 400 500 600 700
800 Data SM (sys ⊕ stat)
WW WZ/ZZ/Wγ
t
t Single Top
Z+jets W+jets H [125 GeV]
ATLAS Preliminary
Ldt = 20.7 fb-1
∫
= 8 TeV, s
+ 1 jet ν νe µ ν/ µ ν
→e WW(*)
→ H
(b)mℓℓforNjet=1,eµ+µe
Figure 3: Distribution ofmℓℓin 8 TeV data. The plots are shown for theeµ+µechannel in (a)Njet=0 and (b) Njet=1 modes. The distributions are shown prior to splitting the samples into twomℓℓ re- gions for the eµ+µe channel as described in Table 2. The visible signal is stacked on top of the background. The shaded area represents the uncertainty on the signal and background yields from statistical, experimental, and theoretical sources.
The transverse momentum of the dilepton system is required to be large, pℓℓT >30 GeV. Foree+µµ events, the hadronic recoil is required to be small, frecoil<0.05. Finally, the azimuthal gap between pℓℓT andEmissT (denotedMETin the subscript) is required not to be small in order to remove potentially pathological events,|∆φℓℓ,MET|> π/2.
In the Njet=1 analysis, the DY treatment is similar to that in Njet=0 while additional selections further suppress top andZ/γ∗→ττbackgrounds. For DY reduction, theEmissT,relandpmissT,relrequirements are the same as inNjet=0, but the hadronic recoil threshold is higher, frecoil<0.2.The top background is suppressed by rejecting events with a heavy-flavour jet identified with a multi-variateb-tagging al- gorithm [57] with 85% efficiency on simulatedtt¯events and light-flavour jet mis-tag rate of 11% [58].
The Z/γ∗→ττbackground ineµ+µeis suppressed using an invariant mass computed under the as- sumption that the neutrinos are collinear with the leptons in theτdecay [59] and that they are the only source ofEmissT ,|mττ−mZ| ≥25 GeV.
In the Njet≥2 analysis, the event selection follows that in Njet=1 with the following modifi- cations. The DY is suppressed requiring EmissT >20 GeV foreµ+µe, and both ETmiss>45 GeV and ET,STVFmiss >35 GeV foree+µµ. The VBF-specific selections use the kinematics of the two highest-pT
jets in the event (denoted as tag jets). Their rapidity gap is required to be large, |∆yj j|>2.8, and their invariant mass is required to be high, mjj>500 GeV. Activity in the rapidity gap between the tag jets is restricted, to reduce the ggF contribution to this mode: events with a jet with pT>20 GeV inside the rapidity gap are vetoed. The leptons are required to be within the rapidity gap. Finally,t¯t background is further reduced by requiring a small total transverse momentum, ptotT <45 GeV, where ptotT =pℓℓT +pTj j+EmissT , wherepTj jis the vectorial sum of the transverse momenta of the tag jets.
3.5 Selection summary and signal discriminantsmℓℓ andmT
The signal discriminantsmℓℓandmT, which appear at the bottom of the table, are introduced to further separate the signal from the background processes. The sample of events at the stage corresponding
[GeV]
mT
50 100 150 200 250 300
Events / 10 GeV
0 50 100 150 200 250 300
Data SM (sys ⊕ stat)
WW WZ/ZZ/Wγ
t
t Single Top
Z+jets W+jets H [125 GeV]
ATLAS Preliminary
Ldt = 20.7 fb-1
∫
= 8 TeV, s
+ 0 jets ν νe µ ν/ µ ν
→e WW(*)
→ H
(a)mTforNjet=0,eµ+µe
[GeV]
mT
50 100 150 200 250 300
Events / 10 GeV
0 20 40 60 80 100 120 140 160 180
200 Data SM (sys ⊕ stat)
WW WZ/ZZ/Wγ
t
t Single Top
Z+jets W+jets H [125 GeV]
ATLAS Preliminary
Ldt = 20.7 fb-1
∫
= 8 TeV, s
+ 0 jets ν µ ν µ ν/ νe
→e WW(*)
→ H
(b)mTforNjet=0,ee+µµ
[GeV]
mT
50 100 150 200 250 300
Events / 10 GeV
0 20 40 60 80 100 120
140 Data SM (sys ⊕ stat)
WW WZ/ZZ/Wγ
t
t Single Top
Z+jets W+jets H [125 GeV]
ATLAS Preliminary
Ldt = 20.7 fb-1
∫
= 8 TeV, s
+ 1 jet ν νe µ ν/ µ ν
→e WW(*)
→ H
(c)mTforNjet=1,eµ+µe
[GeV]
mT
50 100 150 200 250 300
Events / 10 GeV
0 10 20 30 40 50 60 70 80 90
Data SM (sys ⊕ stat)
WW WZ/ZZ/Wγ
t
t Single Top
Z+jets W+jets H [125 GeV]
ATLAS Preliminary
Ldt = 20.7 fb-1
∫
= 8 TeV, s
+ 1 jet ν µ ν µ ν/ νe
→e WW(*)
→ H
(d)mTforNjet=1,ee+µµ
[GeV]
mT
50 100 150 200 250 300
Events / 20 GeV
0 1 2 3 4 5 6 7 8 9
Data SM (sys ⊕ stat)
WW WZ/ZZ/Wγ
t
t Single Top
Z+jets W+jets
ggF VBF
ATLAS Preliminary
Ldt = 20.7 fb-1
∫
= 8 TeV, s
≥ 2 j ν + νe µ ν/ µ ν
→e WW(*)
→ H
(e)mTforNjet≥2,eµ+µe
[GeV]
mT
50 100 150 200 250 300
Events / 20 GeV
0 2 4 6 8 10 12 14
Data SM (sys ⊕ stat)
WW WZ/ZZ/Wγ
t
t Single Top
Z+jets W+jets
ggF VBF
ATLAS Preliminary
Ldt = 20.7 fb-1
∫
= 8 TeV, s
≥ 2 j ν + µ ν µ ν/ νe
→e WW(*)
→ H
(f)mTforNjet≥2,ee+µµ
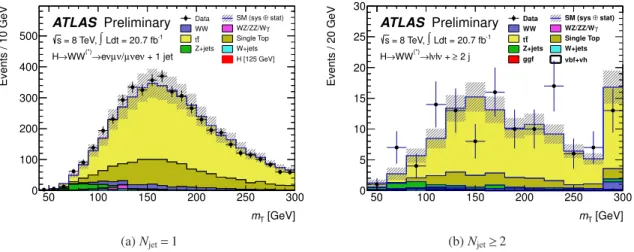
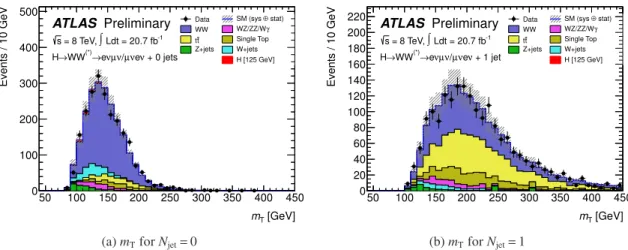
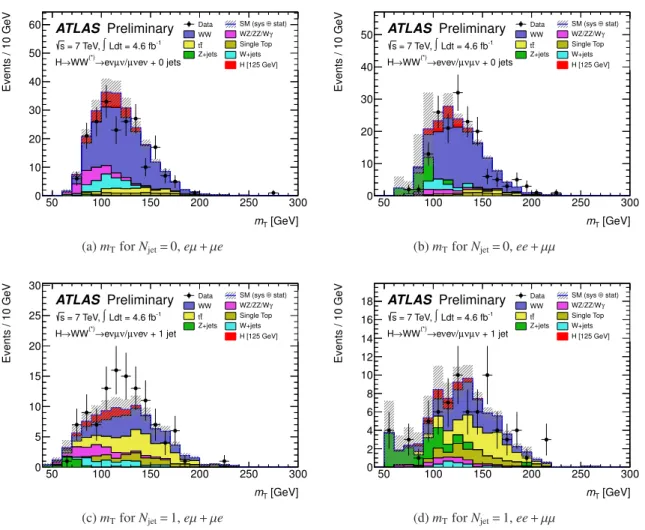
Figure 4: Distribution of the transverse mass,mT, for 8 TeV data. The plots are shown for theeµ+µe (left) andee+µµ(right) channels inNjet=0 (top),Njet=1 (middle), andNjet≥2 modes (bottom). The distributions are shown prior to splitting the samples into twomℓℓ regions for theeµ+µechannel in the Njet=0 and =1 modes, as described in Table 2. The visible signal is stacked at the top of the background. For the Njet≥2 mode, the signal is plotted separately for the ggF and VBF production processes. The shaded area represents the uncertainty on the signal and background yields from
Table 2: Selection listing for 8 TeV data. The criteria specific toeµ+µeandee+µµare noted as such;
otherwise, they apply to both. Pre-selection applies to allNjetmodes. The rapidity gap is theyrange spanned by the two leading jets. Themℓℓsplit is at 30 GeV. The modifications for the 7 TeV analysis are given in Section 6 and are not listed here. Energies, masses, and momenta are in units of GeV.
Category Njet=0 Njet=1 Njet≥2
Pre-selection
Two isolated leptons (ℓ=e, µ) with opposite charge Leptons withpleadT >25 andpsubleadT >15
eµ+µe:mℓℓ>10
ee+µµ:mℓℓ>12,|mℓℓ−mZ|>15 Missing transverse
momentum and hadronic recoil
eµ+µe: ET,relmiss>25 eµ+µe:ET,relmiss>25 eµ+µe:ETmiss>20 ee+µµ: ET,relmiss>45 ee+µµ:ET,relmiss>45 ee+µµ:ETmiss>45 ee+µµ: pmissT,rel>45 ee+µµ:pmissT,rel>45 ee+µµ:ET,STVFmiss >35 ee+µµ: frecoil<0.05 ee+µµ: frecoil<0.2 -
General selection
- Nb-jet=0 Nb-jet=0
|∆φℓℓ,MET|> π/2 - ptotT <45
pℓℓT >30 eµ+µe:Z/γ∗→ττveto eµ+µe:Z/γ∗→ττveto
VBF topology
- - mj j>500
- - |∆yj j|>2.8
- - No jets (pT>20) in rapidity gap
- - Require bothℓin rapidity gap
H→WW(∗)→ℓνℓν topology
mℓℓ<50 mℓℓ<50 mℓℓ<60
|∆φℓℓ|<1.8 |∆φℓℓ|<1.8 |∆φℓℓ|<1.8
eµ+µe: splitmℓℓ eµ+µe: splitmℓℓ -
FitmT FitmT FitmT
to the selection on the variable of interest is discussed below.
The mℓℓ distribution for Njet≤1 is shown in Fig. 3. The signal-to-background (S/B) ratio in this distribution is varying, so the sample is further subdivided for signal extraction (Section 7.2) at mℓℓ=30 GeV forNjet≤1 in theeµ+µechannels. The split is not made for the correspondingee+µµ channels.
The transverse mass mT distribution is used to measure the signal strength. It is defined as mT=((EℓℓT +EmissT )2− |pℓℓT +EmissT |2)1/2 with ETℓℓ=(|pℓℓT |2+m2ℓℓ)1/2. The statistical treatment is de- scribed later in Section 7. Figure 4 shows the expected signal and the composition of the expected background for the differentNjetanalyses and decay channels. The details of the normalisation of the background events are discussed in the next section. The highest S/Bis in a region of mT around mH: 0.75mH<mT<mHforNjet≤1 andmT<1.2mHforNjet≥2. To illustrate the relative size of the signal, the expectedS/Bin the above-mentionedmTrange is 0.14, 0.15, and 0.31 forNjet=0,=1, and
≥2, respectively, for the combinedeµ+µe+ee+µµchannels.
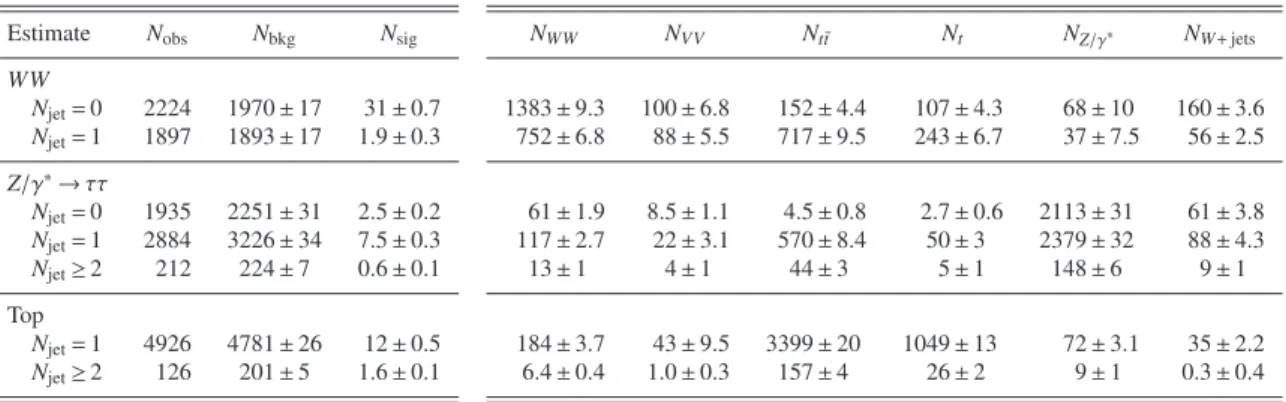
4 Background estimation
The processes producing two isolated high-pTleptons with high values ofEmissT areWWand top quark production. In this note, top background refers to the combinedtt¯and single top (tW, tb, andtqb) processes unless stated otherwise the latter is noted astin the tables. These backgrounds, as well as
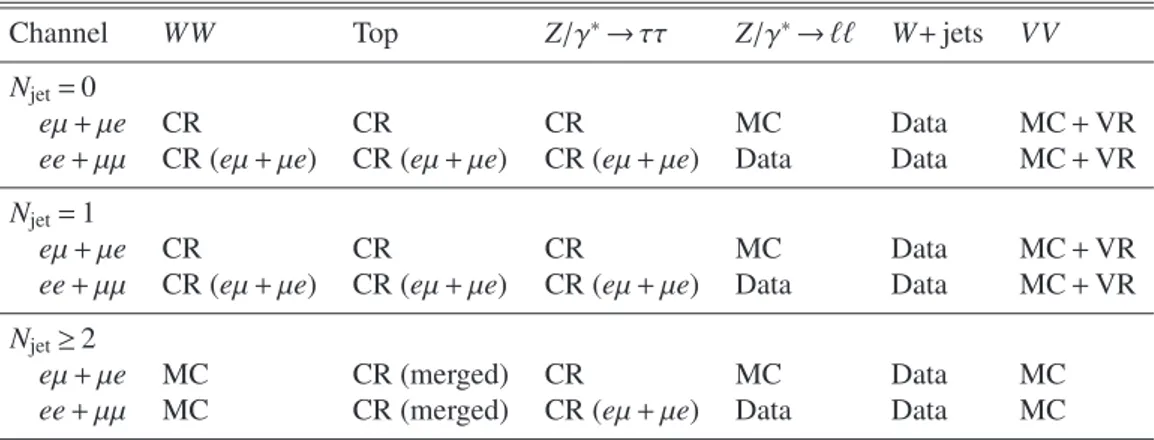
Z/γ∗→ττbackground, are each normalised to the observed rate in a data control region (CR) defined to be as pure as possible for the relevant background source. The processesZ/γ∗→ℓℓandZ/γ∗→ττ are noted asZ/γ∗in the tables andZ+jets in the figure legends. Table 3 summarises the treatment of the backgrounds. An overview of the CR statistics is given in Table 4, and is discussed later in Section 4.5.
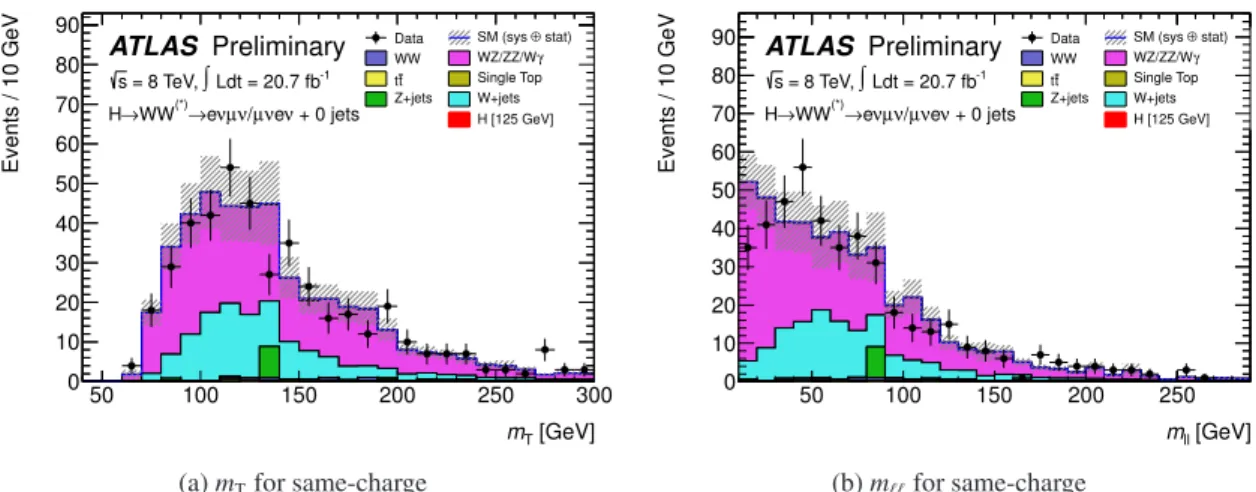
The W+jets background is estimated from data using corrections derived from simulation, as described in Section 4.1.1. The shapes and normalisation of backgrounds from diboson processes other thanWW (Wγ(∗),WZ(∗), andZ(∗)Z(∗)) are estimated using simulation; these processes are noted as VV in the tables. The simulation predictions for these backgrounds are cross-checked, together with theW+jets data-derived estimation, by requiring that the two lepton candidates have the same charge. This validation region is to be distinguished from the CRs, which are used to normalise the most significant backgrounds.
The DY background is relatively small in this analysis because it is suppressed by theEmissT ,pmissT , frecoil, and mℓℓ criteria described in Section 3. As shown in Table 2, the selection onETmiss is much tighter for the ee+µµ channel than for the eµ+µe channel because of the larger DY background fromZ/γ∗→ℓℓas compared toZ/γ∗→ττ→eνµν, respectively. For this reason, the use of theZpeak as a CR is subject to large uncertainties from mismodelling of the ETmiss tails as a function ofmℓℓ. Therefore, a data-derived method is used to estimate the DY background foree+µµ, as described in Section 4.1.2 . In the case ofeµ+µe, where the majority of the background comes fromZ/γ∗→ττ, a CR is used, and the details are described in Section 4.2. ForNjet≥2, processes with up to one QCD vertex producing quark jets are non-negligible; they account for approximately 20% of the total DY background foreµ+µeand 6% foree+µµ.
The CRs and validation regions are defined by selections similar to those used for the signal region, but with some criteria reversed or modified to obtain signal-depleted samples enriched in particular backgrounds. The MC WW background in both the Njet=0 and Njet=1 analyses and the MC top background in theNjet=1 andNjet≥2 analyses are normalised to the data yields in the corresponding CRs, after subtracting contributions from processes other than the targeted one. The resulting esti- mated event yield for that process is extrapolated from the CR to the signal region using the ratio of event yields in the simulation. Using this ratio reduces the sensitivity of the background predictions to systematic uncertainties, which are detailed in Section 5. In general, theeµ+µeCRs with higher statistics, and significantly higher purity than the correspondingee+µµchannels, are used as CRs for the latter. The exception to this is the topNjet≥2 CR where the DY contribution is negligible.Details on the normalisation of the top andWWbackgrounds are given in Sections 4.3 and 4.4.
The correlations introduced among the backgrounds by the presence of other processes in the CRs are fully incorporated in the statistical procedure used to test the background-only hypothesis and extract the signal strength (see Section 7). In the following, each background estimate is described after any others on which it depends. For this reason, the largest background (WW) is described last.
4.1 Data-derived estimates ofW+jets and Z/γ∗→ℓℓ 4.1.1 W+jets estimation and the same-charge validation region
TheW+jets background contribution is estimated using a CR in which one of the two leptons satisfies the identification and isolation criteria described in Section 3, and the other lepton (denoted as anti- identified) fails these criteria but satisfies a loosened selection. The dominant contribution to this background comes fromW+jets events in which a jet produces an object which is reconstructed as a lepton. The estimation of this background is unchanged from Ref. [49] except that the extrapolation