ATLAS-CONF-2012-162 14November2012
ATLAS NOTE
ATLAS-CONF-2012-162
November 14, 2012
Updated ATLAS results on the signal strength of the Higgs-like boson for decays into WW and heavy fermion final states
The ATLAS Collaboration
Abstract
An update of the ATLAS measurement of the signal strength in various decay modes obtained by updating the low mass resolution Higgs boson searches in
H→WW(∗)→`ν`ν, H → τ+τ−and
H → bb¯ with 13 fb
−1of
ppcollision data collected at the LHC at
√s =
8 TeV is presented. The combination of all final states, including the already published
H→ZZ(∗)→4` and
H→γγresults, gives a signal strength relative to the standard model expectation of
µ=1.3
±0.3 for a Higgs boson mass hypothesis of 126 GeV.
c
Copyright 2012 CERN for the benefit of the ATLAS Collaboration.
The observation of a new particle in the search for the Standard Model (SM) Higgs boson at the LHC, reported by the ATLAS [1] and CMS [2] collaborations, is a milestone in the quest to understand electroweak symmetry breaking. In Refs. [1] and [3] ATLAS reported initial estimates for the mass of the particle, m
H =126.0 ± 0.4(stat) ± 0.4(sys) GeV, and its coupling properties. This document presents an update of the measurements of the signal strength of the observed new particle using up to 13 fb
−1of
pp collision data at √
s
=8 TeV, focusing on the channels: H → WW
(∗), H → τ
+τ
−and H → b b. ¯ For the H → τ
+τ
−and H → b b ¯ channels, the updated analyses [4, 5] are applied to the full available sample that also include the 2011 data at √
s
=7 TeV. For the H → WW
(∗)→ `ν`ν final state, only the latest ATLAS results [6], based on the different flavour (eµ and µe) 0-jet and 1-jet analyses in the 2012 data, are considered here. The 2011 data are not included, as the revised analyses used for the 2012 data have not been applied to them. The H→ γγ and H → ZZ
(∗)analyses as presented in Ref. [1] are used.
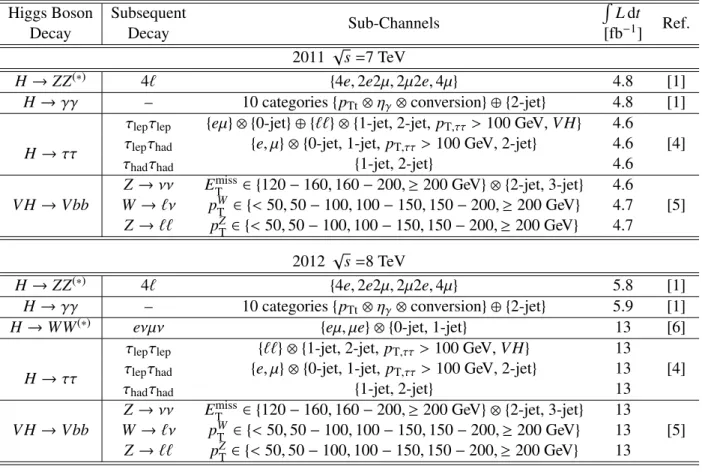
The different final states and channel categories considered in this analysis are summarized in Table 1.
The individual and combined results are based on the statistical model described in Ref. [1] which accounts for the experimental and theoretical systematic uncertainties. The parameter of interest is the global signal strength factor µ which scales the total number of signal events predicted by the Standard Model. This factor is defined such that µ
=0 corresponds to the background-only hypothesis and µ
=1 corresponds to the SM Higgs boson signal in addition to the background. Hypothesized values of µ are tested with a statistic λ(µ) based on the profile likelihood ratio [7].
Table 1: Summary of the individual channels entering the combined results presented here. The transition points between separately optimized regions of m
Hare indicated where applicable. In channels sensitive to associated production of the Higgs boson, V indicates a W or Z boson. The symbols ⊗ and ⊕ represent direct products and sums over sets of selection requirements, respectively.
Higgs Boson Subsequent
Sub-Channels
R
L dt
Decay Decay [fb
−1] Ref.
2011 √
s
=7 TeV
H → ZZ
(∗)4` {4e, 2e2µ, 2µ2e, 4µ} 4.8 [1]
H → γγ – 10 categories { p
Tt⊗ η
γ⊗ conversion} ⊕ {2-jet} 4.8 [1]
H → ττ
τ
lepτ
lep{eµ} ⊗ {0-jet} ⊕ {``} ⊗ {1-jet, 2-jet, p
T,ττ> 100 GeV, V H} 4.6
τ
lepτ
had{e, µ} ⊗ {0-jet, 1-jet, p
T,ττ> 100 GeV, 2-jet} 4.6 [4]
τ
hadτ
had{ 1-jet, 2-jet } 4.6
V H → Vbb
Z → νν E
missT∈ {120 − 160, 160 − 200, ≥ 200 GeV} ⊗ {2-jet, 3-jet} 4.6
W → `ν p
WT∈ {< 50, 50 − 100, 100 − 150, 150 − 200, ≥ 200 GeV} 4.7 [5]
Z → `` p
ZT∈ {< 50, 50 − 100, 100 − 150, 150 − 200, ≥ 200 GeV} 4.7 2012 √
s
=8 TeV
H → ZZ
(∗)4` {4e, 2e2µ, 2µ2e, 4µ} 5.8 [1]
H → γγ – 10 categories { p
Tt⊗ η
γ⊗ conversion} ⊕ {2-jet} 5.9 [1]
H → WW
(∗)eνµν {eµ, µe} ⊗ {0-jet, 1-jet} 13 [6]
H → ττ
τ
lepτ
lep{``} ⊗ {1-jet, 2-jet, p
T,ττ> 100 GeV, V H } 13
τ
lepτ
had{e, µ} ⊗ {0-jet, 1-jet, p
T,ττ> 100 GeV, 2-jet} 13 [4]
τ
hadτ
had{ 1-jet, 2-jet } 13
V H → Vbb
Z → νν E
missT∈ {120 − 160, 160 − 200, ≥ 200 GeV} ⊗ {2-jet, 3-jet} 13
W → `ν p
WT∈ {< 50, 50 − 100, 100 − 150, 150 − 200, ≥ 200 GeV} 13 [5]
Z → `` p
ZT∈ {< 50, 50 − 100, 100 − 150, 150 − 200, ≥ 200 GeV} 13
Table 2: Summary of the best-fit values and uncertainties for the signal strength µ for the individual channels at a Higgs boson mass of 126 GeV.
Higgs Boson Decay µ
(m
H=126 GeV)H → ZZ
(∗)1.2 ± 0.6
H → γγ 1.8 ± 0.5
H → WW
(∗)1.4 ± 0.6
H → ττ 0.7 ± 0.7
V H → Vbb −0.4 ± 1.1
The treatment of systematic uncertainties and their correlations is described in detail in Refs. [1,3,8].
Systematic uncertainties on observables are handled by introducing nuisance parameters with a probabil- ity density function (pdf) associated with the estimate of the corresponding systematic uncertainty. These nuisance parameters, in particular those representing instrumental uncertainties or background estimates, are often assessed from auxiliary measurements, such as control regions, sidebands or dedicated calibra- tion measurements. Their pdf is then described either by a Gaussian or alternatively by a log-normal distribution to avoid the truncation of a pdf bounded to a restricted range. In cases where the uncertainty is related to a number of events (e.g. from Monte Carlo or data control samples) the Poisson function is used.
Theoretical uncertainties are important to quantify the consistency of the observation with the SM ex- pectation, and are therefore included. Particularly relevant in the measurement of the signal strength are the theoretical uncertainties on the signal cross sections and exclusive jet multiplicity requirements. The prescription used follows the recommendations of Refs. [9,10], treating these systematic uncertainties as fully correlated across all channels.
A Higgs boson mass of m
H =126 GeV [1] is used to produce the results presented in this document
1. The experimental uncertainty of ∼ 0.6 GeV on the mass measurement of m
H =126 GeV introduces a small uncertainty on the Higgs boson signal yields predicted by the Standard Model. The largest e
ffect induced by the above quoted mass uncertainty is about 4% (relative) on the H → WW
(∗)and H → ZZ
(∗)branching ratios. The results for the best-fit values and uncertainties are listed in Table 2. No significant deviation of the measured signal strengths from their SM expectations is observed.
The addition of the 8 TeV data for the H → τ
+τ
−and H → b b ¯ channels, as well as the improvements to the analyses of the 7 TeV data in these channels, bring a significant gain in expected sensitivity for these final states with respect to the previous combined search [1]. For both the H → b b ¯ and the H → τ
+τ
−channels, the expected uncertainty on the signal strength µ is approximately halved with respect to the result obtained previously. In contrast, the uncertainty on the signal strength is not greatly reduced in the case of the H → WW
(∗)channel, partly because the datasets used are not the same and partly because this uncertainty was already dominated by systematic uncertainties in Ref. [1].
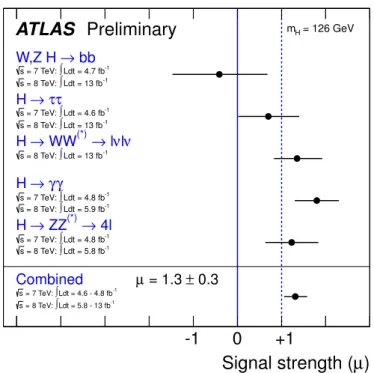
The individual and the global combined best-fit values and uncertainties for the strength parameter µ for all Higgs boson final states studied in ATLAS for a SM Higgs boson mass hypothesis of 126 GeV are shown in Fig. 1. For the combined signal strength a value of µ
=1.3 ± 0.3 is found. Under the assumption of a common signal strength, the compatibility between the individual µ measurements has been tested and found to be at the 36% level. The compatibility of the SM hypothesis (µ
=1) with the observed µ values is 23% and hence is in good agreement with the SM expectation.
1Note that the low mass resolution channelsH→WW(∗),H→τ+τ−andH→bb¯in Refs. [4–6] use a mass hypothesis of
µ ) Signal strength (
-1 0 +1
Combined
→ 4l ZZ(*)
→ H
γ γ
→ H
ν νl
→ l WW(*)
→ H
τ τ
→ H
→ bb W,Z H
Ldt = 4.6 - 4.8 fb-1
∫
= 7 TeV:
s
Ldt = 5.8 - 13 fb-1
∫
= 8 TeV:
s
Ldt = 4.8 fb-1
∫
= 7 TeV:
s
Ldt = 5.8 fb-1
∫
= 8 TeV:
s
Ldt = 4.8 fb-1
∫
= 7 TeV:
s
Ldt = 5.9 fb-1
∫
= 8 TeV:
s
Ldt = 13 fb-1
∫
= 8 TeV:
s
Ldt = 4.6 fb-1
∫
= 7 TeV:
s
Ldt = 13 fb-1
∫
= 8 TeV:
s
Ldt = 4.7 fb-1
∫
= 7 TeV:
s
Ldt = 13 fb-1
∫
= 8 TeV:
s
= 126 GeV mH
± 0.3 = 1.3 µ