A TLAS-CONF-2015-006 17 Mar ch 2015
ATLAS NOTE
ATLAS-CONF-2015-006
March 17, 2015
Search for the associated production of the Higgs boson with a top quark pair in multi-lepton final states with the ATLAS detector
The ATLAS Collaboration
Abstract
A search for the associated production of the Higgs boson with a top quark pair is per- formed in multi-lepton final states using 20.3 fb − 1 of proton-proton collision data recorded by the ATLAS experiment at √
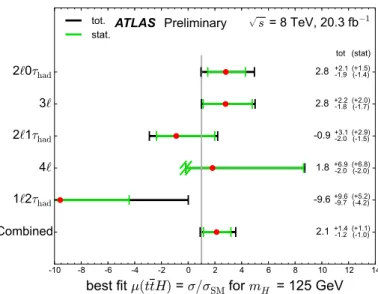
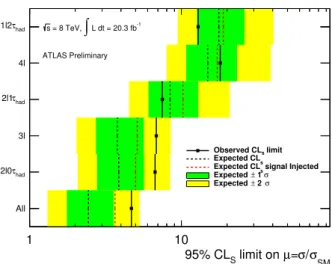
s = 8 TeV at the Large Hadron Collider. Five final states, targeting the decays H → WW ∗ , ττ, and ZZ ∗ , are examined for the presence of the Stan- dard Model (SM) Higgs boson: two same-charged light leptons (e or µ) without an addi- tional hadronically decaying tau; three light leptons; two same-charged light leptons with an additional hadronically decaying tau; four light leptons; and one light lepton and two hadronically decaying taus. No significant excess of events is observed above the back- ground expectation. The best fit for the t¯ tH production cross section, assuming a Higgs boson mass of 125 GeV, is 2.1 + −1.2 1.4 times the SM expectation, and the observed (expected) upper limit at the 95% confidence level is 4.7 (2.4) times the SM rate. The p-value for com- patibility with the background-only hypothesis is 1.8σ; the expectation in the presence of a Standard Model signal is 0.9σ.
c
Copyright 2015 CERN for the benefit of the ATLAS Collaboration.
Reproduction of this article or parts of it is allowed as specified in the CC-BY-3.0 license.
1 Introduction
The discovery of a new particle H with a mass of about 125 GeV in searches for the Standard Model (SM) [1–3] Higgs boson [4–7] at the LHC was reported by the ATLAS [8] and CMS [9] collaborations in July 2012. The particle has been observed in the decays H → γγ [10, 11], H → ZZ ∗ → 4` [12, 13], and H → WW ∗ → `ν`ν [14, 15], and evidence has been seen for H → ττ [16, 17], consistent with the rates expected for the SM Higgs boson.
The observation of the process in which the Higgs boson is produced in association with a pair of top quarks (t¯ tH) would permit a direct tree-level measurement of the top quark-Higgs boson Yukawa coupling, which is otherwise accessible primarily through loop effects. Having both tree- and loop-level measurements would allow disambiguation of new physics e ff ects that could a ff ect the two di ff erently, such as dimension-six operators contributing to the ggH vertex. This paper describes a search for the SM Higgs boson in the t¯ tH production mode in multileptonic final states. The five final states considered are: two same-sign light leptons (e or µ) with no additional hadronically decaying tau; three light leptons; two same-sign light leptons with one hadronically decaying tau; four light leptons; and one light lepton with two hadronically-decaying tau candidates. These are sensitive to the Higgs decays H → WW ∗ , ττ, and ZZ ∗ produced in association with a top quark pair decaying to one or two leptons.
A similar search has been performed by the CMS experiment [18]. The selections are designed to avoid overlap with ATLAS searches for t¯ tH in H → b b ¯ [19] and H → γγ [20] decays. The main backgrounds to the signal arise from t¯ t production with additional jets and non-prompt leptons, associated production of a top quark pair and a vector boson W or Z (collectively denoted t¯ tV), and other processes where the electron charge is incorrectly measured or where quark or gluon jets are incorrectly identified as tau candidates.
2 ATLAS Detector and Dataset
Features of the ATLAS detector [21] most relevant to this analysis are briefly summarized here. The detector consists of an inner tracking detector system surrounded by a superconducting solenoid, elec- tromagnetic and hadronic calorimeters, and a muon spectrometer. Charged particles in the pseudo- rapidity 1 range |η| < 2.5 are reconstructed with the inner tracking detector, which is immersed in a homogeneous 2 T magnetic field parallel to the detector axis, and consists of pixel and strip semicon- ductor detectors, as well as a straw-tube transition radiation tracker. The solenoid is surrounded by a calorimeter system covering |η| < 4.9, which provides three-dimensional reconstruction of particle showers. Lead / liquid-argon (LAr) sampling technology is used for the electromagnetic component.
Iron/scintillating-tile sampling calorimeters are used for the hadronic component for |η| < 1.7, and copper/LAr and tungsten/LAr technology is used for |η| > 1.5. Outside the calorimeter system, air- core toroids provide a magnetic field for the muon spectrometer. Three stations of precision drift tubes and cathode strip chambers provide a measurement of the muon track position in the region |η| < 2.7.
Resistive-plate and thin-gap chambers provide muon triggering capability up to |η| < 2.4.
The search documented in this note uses data collected by ATLAS in 2012 at a center-of-mass energy of √
s = 8 TeV. All events considered were recorded while the detector and trigger systems
1
The ATLAS experiment uses a right-handed coordinate system with its origin at the nominal interaction point (IP) in
the center of the detector, and the z-axis along the beam line. The x-axis points from the IP to the center of the LHC ring, and
the y-axis points upwards. Cylindrical coordinates (r, φ) are used in the transverse plane, φ being the azimuthal angle around
the z-axis. Observables labelled “transverse” are projected onto the x - y plane. The pseudorapidity is defined in terms of the
polar angle θ as η = − ln tan θ/2. The transverse momentum is defined as p
T= p sin θ = p/ cosh η, and the transverse energy
E
Thas an analogous definition.
were fully functional; the integrated luminosity of this dataset is 20.3 fb −1 .
3 Theoretical Expectations and Event Simulation
3.1 Cross Sections for Signal and Background Processes
The cross section for the production of t¯ tH in pp collisions has been calculated at next-to-leading order (NLO) and Higgs decay branching fractions to next-to-next-to-leading-order (NNLO) in Quan- tum Chromodynamics (QCD) [22–30]. Uncertainties on the cross section are evaluated by varying the renormalization and factorization scales by factors of 2 (scale) and by varying the input parton distri- bution functions (PDF) of the proton. A Higgs boson mass of m H = 125 GeV is assumed; this gives a predicted t¯ tH production cross section at √
s = 8 TeV of 129 + −12 5 (scale) ± 10 (PDF) fb [31]. This assumed Higgs boson mass is consistent with the ATLAS measurement of m H = 125.4 ± 0.4 GeV [32].
In this paper the associated production of single top quarks with Higgs bosons is considered a background process and set to the Standard Model rate. The production of tHqb and tHW are taken into account. In the Standard Model these are very small compared to the t¯ tH production rate. These processes are simulated with the same parameters as used by the ATLAS t¯ tH, H → γγ search [20]. The cross sections for both are computed using the MG5_aMC@NLO generator [33] at NLO in QCD. For tHqb, the renormalization and factorization scales are set to 75 GeV and the process is computed in the four flavor scheme, yielding σ(tHqb) = 17.2 + −1.4 0.8 (scale) + −0.9 1.2 (PDF) fb. For tHW, dynamic factorization and renormalization scales are used, and the process is computed in the five flavor scheme; the result is σ(tHW ) = 4.7 + −0.3 0.4 (scale) + −0.6 0.8 (PDF) fb. The interference of tHW production with t¯ tH, which appears at NLO for tHW in diagrams with an additional b quark in the final state, is not considered but is expected to be small.
The production of t¯ tW and t¯ t(Z/γ ∗ ) → t¯ t`` produce multi-leptonic final states with b quarks and are major backgrounds to the t¯ tH signal. For simplicity of notation the latter process will be referred to as t¯ tZ throughout this paper, but off-shell Z and photon components are included except where noted.
Next-to-leading order cross sections are used for t¯ tW [34] and t¯ tZ [35]. The MG5_ a MC@NLO gener- ator is used to reproduce the QCD scale uncertainties of these calculations and determine uncertainties due to PDF. For t¯ tW production the value 232 ± 28 (scale) ± 18 (PDF) fb is used, and for t¯ tZ produc- tion 2 we use 206 ± 23 (scale) ± 18 (PDF) fb.
The associated production of a single top quark and a Z boson is a sub-leading background for all the most sensitive channels. The cross-section has been calculated at NLO for the t- and s- channels [36]. The resulting values used in this work are 160 ± 7 (scale) ± 11 fb (PDF) for tZ and 76 ± 4 (scale) ± 5 fb (PDF) for ¯ tZ.The cross section for the production of tWZ is computed at leading order (LO) using the MadGraph v5 generator [37] and found to be 4.1 fb.
The cross section for inclusive production of vector boson pairs WW , WZ, and ZZ is computed using MCFM [38]. Contributions from virtual photons and o ff -shell Z bosons are included. The un- certainties on the acceptance for these processes in the signal regions (which favor production with additional b or c quarks) dominate over the inclusive cross section uncertainty and so the latter is ne- glected in the analysis.
The inclusive t¯ t cross section is determined at NNLO in QCD which includes resummation of next-to-next-to-leading logarithmic (NNLL) soft gluon terms using Top++ [39] yielding 253 + −15 13 pb for
2
The NLO corss section is only evaluated for on-shell t¯ tZ production. The cross section obtained for off-shell t¯ t(Z/γ
∗)
production in a leading order simulation is scaled by a K-factor of 1.35 obtained as the ratio of NLO and LO on-shell cross
sections. The K-factor differs from that of Ref. [35] due to different choice of PDF.
√ s = 8 TeV. The single top quark samples are normalized to the approximate NNLO theoretical cross sections [40–42] using the MSTW2008 [43] NNLO PDF set. The production of Z → ` + ` − +jets and W → `ν +jets is normalized using NNLO cross sections as computed by FEWZ [44].
3.2 Event Generation
The simulation of t¯ tH signal events is done using NLO matrix elements obtained with the HELAC- Oneloop package [45], where P owheg BOX 1.0 [46–48] is used as an interface to P ythia 8.1 [49] for showering and hadronization (referred to here as PowHel samples). The samples contain all Higgs boson decays with branching fractions set to NNLO values. They are produced using the CT10 NLO PDF sets [50], with factorization (µ F ) and renormalization (µ R ) scales set to m t + m H /2. Higgs boson and top quark masses of 125 and 172.5 GeV, respectively, are used. The Pythia 8.1 generator is configured with the CTEQ6L1 parton distribution functions [51,52] and AU2 underlying event tune [53,54]. These samples are the same as those used by other ATLAS t¯ tH searches.
Production of single top quarks with Higgs bosons is simulated as follows. For tHqb, events are generated at leading order with M ad G raph in the four flavor scheme using P ythia 8.1 for showering and hadronization. For tHW , events are generated at NLO with MG5_ a MC@NLO in the five flavor scheme, interfaced to the Herwig++ parton shower [55]. Higgs boson and top quark masses are set as for t¯ tH production. In both cases the CT10 PDF set is used.
The main irreducible backgrounds are production of t¯ tW and t¯ tZ (t¯ tV). These events are generated with Madgraph interfaced to Pythia 6.425 [56] for parton showering and hadronization. The CTEQ6L1 PDF set and the AUET2B tune [53, 54] are used. For the t¯ tW process, events are generated with up to two extra partons at matrix element (ME) precision, while for t¯ tZ up to one extra parton at ME level is generated. The important contribution from off-shell γ ∗ /Z → `` is included. The tZ process is simulated with the same setup, without extra partons. For cross-checks, additional samples were generated without detector simulation: MG5_ a MC@NLO in NLO mode matched to P ythia 8.1 and Herwig++ parton showers, and Sherpa 2.1.1 [57] in both LO merged and NLO mode matched to the internal parton shower (the matrix elements in the latter case are provided by the O pen L oops library [58]).
Diboson processes are simulated with Sherpa 1.4 for q q, ¯ qg → WW and WZ production, with P owheg [59] interfaced to P ythia 8.1 for q q, ¯ qg → ZZ, and with gg 2ZZ 2.0 [60] for gg → ZZ. Vector boson fusion production of WW, WZ, and ZZ, including W ± W ± j j, is generated with S herpa . The full matrix element for ` + ` − production, including γ ∗ and off-shell Z contributions, is used. The Sherpa q q ¯ and qg samples include diagrams with additional partons in the final state at the matrix element level, and include b and c quark mass e ff ects. S herpa was found to have better agreement with data than Powheg for WZ, while the Sherpa and Powheg descriptions of ZZ production are similar.
For selection optimization as well as to study the composition of non-prompt lepton backgrounds, several additional samples are generated as follows. A t¯ t + jets sample generated with the P owheg NLO generator [61] is used. The CT10 PDF set is chosen and the top quark mass is set to 172.5 GeV. It is interfaced to Pythia 6.425 using the CTEQ6L1 PDF and the Perugia2011C underlying event tune [62].
Small corrections to the t¯ t system and top quark p T spectra are applied based on discrepancies in di ff erential distributions observed between data and simulation at 7 TeV [63].
Samples of s- and t-channel and Wt single top quark production are generated with Powheg [61,
64, 65] using the CT10 PDF set. All samples are interfaced to P ythia 6.425 with the CTEQ6L1 set of
parton distribution functions and Perugia2011C underlying event tune. Overlaps between the t¯ t and Wt
final states are eliminated using the diagram removal method [66].
Samples of Z → ` + ` − + jets and W → `ν + jets events are generated with up to five additional partons using the Alpgen v2.14 [67] leading-order (LO) generator and the CTEQ6L1 PDF set. Parton shower and fragmentation are modeled with P ythia 6.425. Samples are merged with overlaps removed using MLM matching [68]. Production of b and c quarks is also computed at matrix element level, and overlaps between ME and parton shower production are handled by separating the kinematic regimes based on the angular separation of additional heavy partons. The resulting “light” and “heavy” flavor samples are normalized by comparing the resulting b-tagged jet spectra with data.
All simulated samples with Pythia 6 and Herwig [69] parton showering use Photos 2.15 [70] to model photon radiation and T auola 1.20 [71] for τ decays. Samples using P ythia 8.1, H erwig++ , and S herpa use those generators’ internal tau decays and photon radiation generators.
Showered and hadronized events are passed through simulations of the ATLAS detector (either full GEANT4 [72] simulation or a hybrid simulation with parametrized calorimeter showers and GEANT4 simulation of the tracking systems [73, 74]). Additional minimum bias pp interactions (pileup) are modeled with the P ythia 8.1 generator with the MSTW2008 LO PDF set and the A2 tune [53, 54].
They are added to the signal and background simulated events according to the luminosity profile of the recorded data, with additional overall scaling to achieve a good match to observed calorimetry and tracking variables. The contributions from pile-up interactions both within the same bunch crossing as the hard-scattering process and in neighboring bunch crossings are included in the simulation.
4 Object Selection
Electron candidates are reconstructed from energy clusters in the electromagnetic calorimeter asso- ciated with reconstructed tracks in the inner detector. They are required to have |η cluster | < 2.47.
Candidates in the calorimeter transition region 1.37 < |η cluster | < 1.52 are excluded. A multivariate discriminant based on shower shape and track information is used to separate electrons from hadronic showers [75, 76]. Only electron candidates with transverse energy E T greater than 10 GeV are con- sidered. To reduce the background from non-prompt electrons, i.e. from decays of hadrons (including heavy flavour) produced in jets, electron candidates are required to be isolated. Two isolation variables, based on calorimetric and tracking variables, are computed. The first (E cone T ) is based on the sum of transverse energies of calorimeter cells within a cone of radius ∆ R ≡ p
(∆ φ) 2 + (∆ η) 2 = 0.2 around the electron direction. This energy sum excludes cells associated with the electron and is corrected for leakage from the electromagnetic shower and ambient energy in the event. The second (p cone T ) is defined based on tracks with p T > 1 GeV within a cone of radius ∆ R = 0.2 around the electron. Both isolation energies are separately required to be less than 0.05 × E T . The longitudinal impact parameter of the electron track with respect to the selected event primary vertex, multiplied by the sine of the polar angle, |z 0 sin θ| , is required to be less than 1 mm. The transverse impact parameter divided by the estimated uncertainty on its measurement,
d
0σ(d
0)
, should be less than 4. If two electrons closer than
∆ R = 0.1 are selected, only the one with the higher p T is considered. An electron is rejected if, after passing all the above selections, it lies within ∆ R = 0.1 of a selected muon.
Muon candidates are reconstructed by combining inner detector tracks with track segments or full tracks in the muon spectrometer [77]. Only candidates with |η| < 2.5 and p T > 10 GeV are kept.
Additionally, muons are required to be separated by at least ∆ R > 0.04 + 10 GeV p
T,µfrom any selected jets
(see below for details on jet reconstruction and selection). The cut value is optimized to maximize the
acceptance for prompt muons at a fixed background muon rejection. Furthermore, muons must satisfy
similar E cone T and p cone T isolation criteria as for electrons, with an upper cut of 10% on the isolation
divided by the muon p T . The value of |z 0 sin θ| is required to be less than 1 mm, while
d
0σ(d
0)
must be less than 3.
Hadronically decaying τ candidates (τ had ) are reconstructed using clusters in the electromagnetic and hadronic calorimeters. The τ candidates are required to have p T greater than 25 GeV and |η| < 2.47.
The number of charged tracks associated with the τ candidates is required to be 1 or 3 and the charge of the τ candidates, determined from the associated tracks, should be ±1. The τ identification uses both calorimeter cluster and tracking-based variables, combined using a boosted decision tree (BDT) [78]. An additional BDT which uses combined calorimeter and track quantities is employed to reject electrons reconstructed as one-prong hadronically decaying τ leptons.
Jets are reconstructed from calibrated topological clusters [21] built from energy deposits in the calorimeters, using the anti-k t algorithm [79–81] with a radius parameter R = 0.4. Prior to jet finding, a local cluster calibration scheme [82, 83] is applied to correct the topological cluster energies for the e ff ects of non-compensation, dead material and out-of-cluster leakage. The jets are calibrated using energy and η-dependent calibration factors, derived from simulations, to the mean energy of stable particles inside the jets. Additional corrections to account for the difference between simulation and data are derived from in-situ techniques [84, 85]. After energy calibration, jets are required to have p T
> 25 GeV and |η| < 2.5.
To reduce the contamination from jets originating in pp interactions within the same bunch crossing (pileup), the scalar sum of the p T of tracks matched to the jet and originating from the primary vertex must be at least 50% of the scalar sum of the p T of all tracks matched to the jet. This criterion is only applied to jets with p T < 50 GeV (those must likely to originate from pileup) and |η| <2.4 (to avoid ine ffi ciency at the edge of tracking acceptance).
The calorimeter energy deposits from electrons will typically be reconstructed also as jets; in order to eliminate double counting, any jets within ∆ R < 0.3 of a selected electron are not considered.
Jets containing b hadrons are identified (b-tagged) via a multivariate discriminant [86] that com- bines information from the impact parameters of displaced tracks with topological properties of sec- ondary and tertiary decay vertices reconstructed within the jet. The working point used for this search corresponds to approximately 70% e ffi ciency to tag a b-hadron jet, with a light jet mistag rate of ≈ 1%
and a charm jet rejection factor of 5, as determined for b-tagged jets with p T of 20–100 GeV and
|η| < 2.5 in simulated t¯ t events. To avoid inefficiencies associated with the edge of the tracking cover- age, only jets with |η| < 2.4 are considered as possible b-tagged jets in this analysis. The e ffi ciency and mistag rates of the b-tagging algorithm are measured in data [86, 87] and correction factors are applied to the simulated efficiency.
5 Event selection and classification
All events considered in this analysis are required to pass single lepton (e or µ) triggers. These achieve their maximal plateau e ffi ciency for lepton p T > 25 GeV.
This analysis primarily targets the H → WW ∗ and ττ decay modes. Considering the decay of the t¯ t system as well, these t¯ tH events will contain either WWWWb b ¯ or ττWWb b. The strategy is to target ¯ final states that cannot be produced in t¯ t decay alone — i.e., ≥ 3 leptons or with two same sign leptons
— thus suppressing what would otherwise be the largest single background.
The analysis categories are classified by the number of light leptons and hadronic τ decay candi-
dates (τ had ). The leptons are selected using the criteria described earlier. Events are initially classified
by counting the number of light leptons with p T > 10 GeV. At least one light lepton is required to
match a lepton selected by the trigger system. After initial sorting into analysis categories, in some
Table 1: Fraction of expected t¯ tH signal arising from di ff erent Higgs boson decay modes in each analysis category. The six 2`0τ had categories are combined together, as are the two 4` categories. The decays contributing to the “other” column are dominantly H → µµ and H → b b. ¯
Higgs boson decay mode Category WW ∗ ττ ZZ ∗ Other
2`0τ had 80% 15% 3% 2%
3` 74% 15% 7% 4%
2`1τ had 35% 62% 2% 1%
4` 69% 14% 14% 4%
1`2τ had 4% 93% 0% 3%
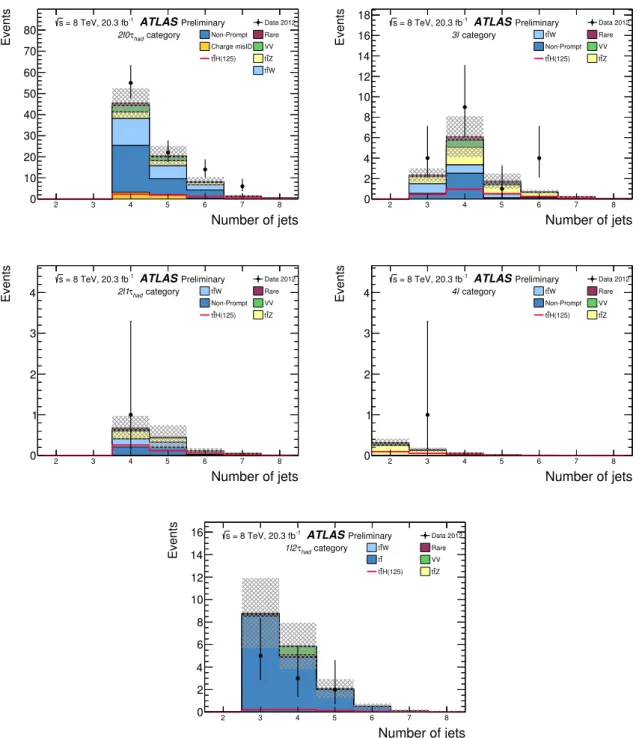
cases the lepton selection criteria are tightened by raising the p T threshold, tightening isolation selec- tions or restricting the allowed |η| range, as explained in the following per-category descriptions. The analysis includes five distinct categories: 2 same-sign leptons with no τ had (2`0τ had ), 3 leptons (3`), 2 same-sign leptons and one τ had (2`1τ had ), 4 leptons (4`), and 1 lepton and 2τ had (1`2τ had ). The cate- gories with τ had candidates target the H → ττ decay; the others are primarily sensitive to H → WW ∗ with a very small contribution from H → ZZ ∗ . The contributions to each category from different Higgs boson decay modes are shown in Table 1. These selection criteria ensure that an event can only con- tribute to a single category. The contamination from gluon fusion, vector boson fusion, and associated V H production mechanisms for the Higgs boson is found to be negligible. The detailed criteria for each category are described below.
5.1 2`0τ had Categories
Selected events are required to include exactly 2 light leptons, which must have the same charge. Events with hadronic τ candidates are vetoed. To reduce the impact from non-prompt leptons, the leading (sub-leading) lepton is required to satisfy p T > 25 (20) GeV, and the lepton isolation requirements are tightened to E cone T / p T < 0.05 and p cone T /p T < 0.05. The angular acceptance of electron candidates is restricted to |η| < 1.37 in order to suppress t¯ t background events where the electron charge sign is mis-reconstructed, as the charge misidentification rate increases at high pseudorapidity.
In order to suppress the lower-multiplicity t¯ t + jets and t¯ tW backgrounds, events must include at least 4 reconstructed jets. In order to suppress diboson and single boson backgrounds, at least one of these jets must be b-tagged. The selected events are separated by lepton flavor (e ± e ± , e ± µ ± , and µ ± µ ± ) and number of jets (exactly four jets, at least five jets) into six categories with di ff erent signal to background ratio, resulting in higher overall sensitivity to the t¯ tH signal.
5.2 3` Category
Selected events are required to include exactly 3 light leptons with total charge equal to ±1. Candidate
events arising from non-prompt leptons overwhelmingly originate as opposite-sign dilepton events with
one additional non-prompt lepton. As a result, the non-prompt lepton is generally one of the two leptons
with the same charge. To reduce these backgrounds, a higher momentum threshold p T > 20 GeV is
applied on the two leptons with the same charge sign. No requirements are imposed on the number
of τ had candidates. In order to suppress the t¯ t + jets and t¯ tV backgrounds, selected events are required
to include either at least 4 jets of which at least one must be b-tagged, or exactly 3 jets of which at least 2 are b-tagged. To suppress the t¯ tZ background, events that contain an opposite-sign same flavour lepton pair with the invariant dilepton mass within 10 GeV of the Z mass are vetoed. Events containing an opposite-sign lepton pair with invariant mass below 12 GeV are also removed to suppress resonant background processes that decay to light leptons.
5.3 2`1τ had Category
Selected events are required to include exactly 2 light leptons, with the same charge and leading (sub- leading) p T > 25 (15) GeV, and exactly 1 hadronic τ candidate. The reconstructed charge of the τ had candidate has to be opposite to that of the light leptons. In order to reduce t¯ t + jets and t¯ tV backgrounds, events must include at least 4 reconstructed jets. In order to suppress diboson and single boson back- grounds, at least one jet must be b-tagged. To suppress the Z → ` + ` − + jets background, events with dielectron invariant mass within 10 GeV of the Z mass are vetoed.
5.4 4` Categories
Selected events are required to include exactly 4 light leptons with total charge equal to 0 and leading (sub-leading) p T > 25 (15) GeV. No requirements are applied on the number of τ had candidates. In order to suppress the t¯ t + jets and t¯ tV backgrounds, the selected events are required to include at least 2 jets of which at least one must be b-tagged. To suppress the t¯ tZ background, events that contain an opposite-sign same flavour lepton pair with invariant dilepton mass within 10 GeV of the Z mass are vetoed. In order to suppress background contributions from resonant background processes that decay to light leptons, all opposite-sign same flavor lepton pairs are required to have a dilepton invariant mass greater than 10 GeV. The four lepton invariant mass is required to be between 100 and 500 GeV, which gives high acceptance for t¯ tH, H → WW ∗ → `ν`ν, but rejects Z → 4` and high-mass t¯ tZ events.
Selected events are separated by the presence or absence of a same flavor, opposite-sign lepton pair into two categories, referred to respectively as the Z-enriched and Z-depleted categories. In both cases the Z mass veto is applied, but events in the Z-enriched category can arise from o ff -shell Z and γ ∗ → ` + ` − while those in the Z-depleted category cannot.
5.5 1`2τ had Category
Selected events are required to include exactly 1 light lepton with p T > 25 GeV and exactly 2 hadronic τ candidates. The τ had candidates must have an opposite charge sign. In order to suppress the t¯ t + jets and t¯ tV backgrounds, events must include at least 3 reconstructed jets. In order to suppress diboson and single boson backgrounds, at least one of the jets must be b-tagged. This final state is primarily sensitive to H → τ + τ − decays, allowing use of the invariant mass of the visible decay products of the τ had τ had
system (m vis ) as a signal discriminant. Signal events are required to satisfy 60 < m vis < 120 GeV.
6 Background estimation
Important irreducible backgrounds include t¯ tV and diboson production and are estimated from MC
simulation. Validation regions enriched in these backgrounds are used to verify proper modeling of
data by simulation. Reducible backgrounds are due to non-prompt lepton production and electron
charge mis-identification, and are estimated from data, with input from simulation in some categories.
In the 1`2τ had category the primary concern is fake τ had candidates, which are modeled using simulation and validated against a data-driven estimate.
6.1 t ¯ tV and t Z
The primary backgrounds with prompt leptons stem from the production of t¯ tW and t¯ tZ. The t¯ tW background tends to have lower jet multiplicity than the signal and so the leading contribution comes from events with additional high p T jets; it is the major t¯ tV contribution in the 2`0τ had categories and comparable to t¯ tZ in the 2`1τ had category. The t¯ tZ process has similar multiplicity to the t¯ tH signal but can only contribute to the signal categories when the Z decays leptonically, so the on-shell contribution can be removed by vetoing events with opposite-sign dilepton pairs with invariant mass near the Z pole.
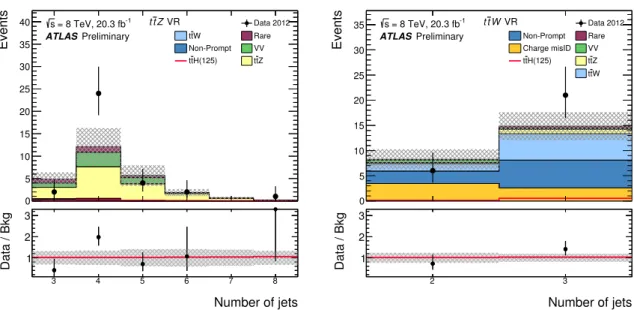
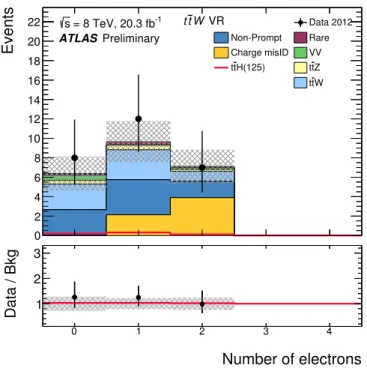
This is the larger of the two t¯ tV contributions for the 3`, 4`, and 1`2τ had categories. The tZ process makes a subleading contribution to both channels. A validation region is used to verify the modeling of t¯ tZ using on-shell Z decays. Agreement is seen within the limited statistics available. No region of equivalent purity and statistical power exists for t¯ tW production; nevertheless the expectations are cross-checked with a validation region defined with the 2`0τ had selection except with two or more b- tagged jets and either two or three jets, where the t¯ tW purity is ≈ 30%, and find consistency within uncertainties. The spectra of the number of jets in these validation regions is shown in Figure 1.
Uncertainties on the t¯ tV background contributions arise from both overall cross section uncer- tainties (see Section 3.1) and acceptance uncertainties. The latter are estimated by comparing three different pairs of generators: a) the nominal MadGraph LO merged sample versus an equivalent LO merged sample generated with S herpa 2.1.1, to account for ME-parton shower matching effects; b) the LO merged S herpa sample versus a S herpa+ O pen L oops NLO sample, to compare LO merged and NLO acceptance; and c) MG5_aMC@NLO with Pythia 8 parton shower versus Herwig++ parton shower, to compare p T -ordered versus angular-ordered parton showers. Each of these variations is input indepen- dently into the final fit. When summed in quadrature they have an impact of 5–23% depending on the category and background source (t¯ tW versus t¯ tZ). Uncertainties arising from changes in the acceptance due to PDF and the choice of QCD scale are also evaluated; these have an impact of 1.3–6.7% for scale and 0.9–4.8% for PDF.
6.2 Other prompt lepton contributions
Other backgrounds with prompt leptons arise from multiboson processes (WZ, ZZ, and triboson pro- duction) in association with heavy flavour jets, or with a misidentified light flavor jet. The main process relevant to the 3` channel is WZ + jets. Validation regions with three leptons including a Z candidate and either zero or one b-tagged jet are studied. The number of jets in WZ + 0b events is reproduced well in the high statistics bins (up to 4 jets), leading to the conclusion that the jet radiation spectrum is well modeled. The dominant uncertainty on the prediction in the signal region is expected to arise from the WZ + b cross section. Data constrain this component with roughly 100% uncertainty. As a result a 100% uncertainty is assigned to the WZ + b cross section, giving a 50% uncertainty on the total WZ contribution to the 3` category.
6.3 Charge sign misidentification
The process e ± → e ± γ → e ± e + e − occurring in detector material can result in a daughter electron with
nearly the same momentum as the parent electron but with opposite charge. In these cases the observed
electron has opposite charge from the primary electron (charge mis-id). The t¯ t and Z/γ ∗ → ` + ` − +jets
Events
0 5 10 15 20 25 30 35
40 Data 2012
Rare VV
Z t t W
t t Non-Prompt
H(125) t t ATLASPreliminary
= 8 TeV, 20.3 fb-1
s ttZ VR
Number of jets
3 4 5 6 7 8
Data / Bkg
12 3
Events
0 5 10 15 20 25 30
35 Data 2012
Rare VV
Z t t W t t Non-Prompt Charge misID
H(125) t t ATLASPreliminary
= 8 TeV, 20.3 fb-1
s ttW VR
Number of jets
2 3
Data / Bkg
12 3
Figure 1: The spectrum of the number of jets expected and observed in the t¯ tZ (left) and t¯ tW (right) validation regions (VR). The hatched band represents the total uncertainty on the background prediction in each bin. The “non-prompt” backgrounds are those with a lepton arising from a hadron decay or from a photon conversion in detector material. Rare processes include tZ, t¯ tWW , triboson, t¯ tt t, and ¯ tH production. The red line corresponds to the t¯ tH signal predicted by the SM.
events that undergo this process contribute to 2`0τ had in the ee and eµ categories. The analogous process for muons has negligible rate. As electrons pass through more material at high η, the charge mis-id rate increases as well, and so the electron |η| < 1.37 requirement significantly reduces the impact of this background. The charge mis-id rate due to track curvature mismeasurement for electrons and muons is negligible.
The charge mis-id probability is determined by a maximum likelihood fit using Z → ee events reconstructed as same and as opposite-sign pairs, as a function of electron η and p T . This probability function is then applied to a sample of events passing the 2`0τ had selection except that the lepton pair is required to be opposite sign. The mis-id probability from the relatively low momentum Z daughters is extrapolated to higher p T using scaling functions extracted from Monte Carlo simulations. The dominant uncertainty is due to the statistical precision of the charge mis-id probability determination, and is ≈ 40% in the signal regions.
6.4 Non-prompt light leptons
A significant background arises from leptons produced in hadron decays (non-prompt leptons), which can promote a single lepton t¯ t event into a 2`0τ had category or a dilepton t¯ t event to the 3` or 2`1τ had cat- egories. With the tight object selection requirements applied in this analysis, almost all reconstructed electron and muon objects correspond to real electrons and muons; the fraction arising from incor- rect particle identification is negligible. These backgrounds in the signal regions are expected to be dominated by t¯ t or single top quark production with additional leptons arising from b hadron decays.
Production of t¯ t with an additional photon which converts in the detector material comprises a subdom-
inant contribution. Estimates of these backgrounds are obtained from data; each channel has a slightly different procedure, motivated by the specific event topology and the statistical power available in the control regions. The methods are discussed below, and the expected non-prompt lepton contributions to the various categories are shown in Table 2. In the following, a tight lepton is a lepton that passes the nominal selection, a sideband lepton is defined as a lepton candidate which satisfies different criteria (identification selection, isolation, or p T ) than the tight lepton selection, and (sideband) control regions either require one or more sideband leptons to replace a tight lepton in the signal region selection, or have the same lepton selection as the signal region but different jet requirements.
6.4.1 2`0τ had Categories
The non-prompt lepton yields in the signal regions are extrapolated from sideband control regions in data which are enriched in t¯ t non-prompt contributions. For electrons, sideband objects are selected by inverting the electron identification and isolation requirements; for muons the sideband objects have low transverse momentum, 6 < p T < 10 GeV, but otherwise are selected the same way as nominal muons. Transfer factors are used to extrapolate from events with one tight and one sideband lepton, but otherwise passing the signal region selections, to the signal regions with two tight leptons. These transfer factors are determined from additional data control regions (tight + sideband and two tight leptons) with lower jet multiplicity (1 ≤ n jet ≤ 3 for electrons, 2 ≤ n jet ≤ 3 for muons). In all regions the expected contribution from processes producing prompt leptons is subtracted before extracting transfer factors or using the yields for extrapolation. For channels with electrons, the charge mis-id background is also subtracted, and a dilepton mass veto is applied to the control regions to suppress contributions from Z → e + e − decays. A cross-check on the muon estimate, using an extrapolation in muon isolation instead of muon p T from the control to signal region, agrees well with the nominal procedure and provides additional confidence in the estimate.
The systematic uncertainties on this procedure are estimated by checking a) its ability to success- fully predict the non-prompt background in t¯ t simulation and b) the stability of the prediction using data as the selection of the control regions is altered. For the former, di ff erent parton shower and b-hadron decay models were checked, as was the result of removing the b-tagged jet requirement. In addition, for electrons, the effects of relaxing the |η| requirement to up to 2.5 and of raising the p T threshold were studied. These checks show stability at the 25–30% level, limited by the statistical precision of the simulations. These also confirm that treating non-prompt leptons from b hadrons and from conversions together is justified. The stability in data is checked by altering the p T required for the b-tagged jet, applying a requirement on missing transverse momentum 3 E T miss , extracting the transfer factors only from events with three jets, or (for muons) using 10–15 GeV muons as the sideband objects. This check shows stability of the predictions to 14% for muons and 19% for electrons. Additional system- atic uncertainties in the prediction arise from the statistical uncertainties on the yields in the control regions and the subtraction of prompt and charge mis-id contributions. The overall uncertainties on the non-prompt yield prediction in any given category range from 32% to 52%, and correlations between the categories due to uncertainties in the transfer factors are correlated in the fit.
6.4.2 3` Category
Sideband leptons are defined by reversing the isolation requirement for both electrons and muons and, for electrons, requiring that the candidate fail the tight electron identification likelihood requirement
3
This is calculated using calorimeter energy deposits, calibrated according to associated reconstructed physics objects,
and also including the transverse momenta of reconstructed muons.
of the analysis but pass a looser selection. The non-prompt lepton contribution in the signal region is estimated by extrapolating from data regions with two tight and one sideband lepton, using transfer factors estimated from Monte Carlo simulation. These events typically contain two prompt opposite- sign leptons and one non-prompt lepton, which necessarily must be of the same sign as one of the prompt leptons. Therefore the non-prompt lepton estimation procedure is applied only to the two same- sign leptons. The simulation-derived transfer factor is validated in a region of lower jet multiplicity (2 ≤ n jet ≤ 3 and exactly one b-tagged jet). Good agreement is observed in this validation region between the prediction (11.8 ± 2.3) and the observed yield (9.8 ± 4.9 events after prompt background subtraction). Systematic uncertainties in the procedure are derived by studying the agreement between data and simulation in the extrapolating variables, which is ≈ 20% for both electrons and muons.
Additional uncertainties arise from the statistical uncertainties on the yields in the control regions and in the t¯ t simulation.
6.4.3 2`1τ had Category
Reconstructing two same-sign light leptons from t¯ t production or similar sources requires that one of the light leptons is non-prompt or has its charge misidentified. In the 2`1τ had category, the charge mis-id contribution is negligible and the primary concern is non-prompt light leptons. Around half of the τ had candidates in these events come from W → τν decays, while the remainder arise from misidentified light quark or gluon jets. Regardless of whether the τ had candidate is a fake, there is also a non-prompt light lepton. Due to this fact, sidebands in the light lepton selection criteria are used, similarly to the 2`0τ had and 3` categories. Since the fraction of real and fake τ had candidates is similar in the signal and all control regions it is not necessary to separately account for fake τ had candidates. In order to maintain similar origin composition of the non-prompt leptons, the E T isolation requirement is inverted, the p T isolation requirement is relaxed, and for electrons the identification criteria are also relaxed to a looser working point. The low jet multiplicity region 2 ≤ n jet ≤ 3 is used to determine a transfer factor from sideband to tight lepton selections. The expected non-prompt lepton yield in the signal region is obtained by using this transfer factor to extrapolate from a control region with the same jet selection as the signal region but with one tight and one sideband light lepton. The small variance in the expected real/fake τ had component between the regions is expected to have negligible impact on the total estimate in the signal region. The procedure is validated by checking that it correctly reproduces the signal region yield expected in t¯ t simulations. The assigned systematic uncertainty (27%) is dominated by the statistical precision of this test. The overall uncertainty on the non-prompt background prediction is dominated by the limited statistics of the high jet multiplicity control region.
6.4.4 4` Category
The non-prompt lepton contribution in this category is expected to be negligible and is estimated at . 10 −3 events in the Z-enriched sample and . 10 −4 events in the Z-depleted sample. In both cases this represents . 2% of the total background expectation.
6.5 τ had misidentification in the 1`2τ had Category
The fake τ had candidate contributions to the 2`1τ had category are already accounted for in the non-
prompt lepton estimation procedure outlined in Section 6.4.3. Therefore explicit fake τ had yield es-
timation is only needed for the 1`2τ had category, where this is by far the dominant background. The
nominal estimate for the fake τ had yield is derived from t¯ t simulation. At all preselection stages the sim- ulation is found to give an acceptable description of the t¯ t background, both in kinematic distributions and total yield. This estimate is cross-checked with the data-driven method described below.
Of the two τ had candidates, one is of the opposite sign to the light lepton (OS) and the other is of the same sign (SS). The SS candidate is essentially always a fake τ had , while the light lepton is prompt and the OS τ had candidate is often real (≈ 30%). A sideband τ had is defined as a candidate passing a loose identification BDT selection but not the nominal tight one. Assuming the τ had candidate fake probabilities are not correlated between jets identified as OS and SS candidates, control regions can be used to predict yields in the signal region. There are three control regions, depending on whether only the OS, only the SS, or both the OS and SS τ had candidates are sideband objects. The two regions with sideband OS τ had candidates are used to obtain the transfer factor for the SS τ had candidate, which is then applied to the region with a tight OS and sideband SS candidate to obtain the prediction for the signal region where both are tight. The transfer factor is measured as a function of the p T , η, number of tracks, and b-tag discriminant value of the SS τ had candidate. The data-driven method is cross-checked in t¯ t simulation and found to successfully predict the yields in the signal region. The main limitation of this method is the statistical power of the control regions.
The comparison of the two simulation- and data-driven techniques gives a 36% uncertainty in the prediction in the signal region, which is taken as the systematic uncertainty on the estimate.
7 Other systematic uncertainties
Systematic uncertainties that have not already been discussed are summarized below.
The uncertainty on the integrated luminosity is 2.8%. This uncertainty is derived from a calibration of the luminosity scale derived from beam-separation scans performed in November 2012, following the same methodology as that detailed in Ref. [88]
Lepton reconstruction and identification uncertainties are obtained from Z → ``, Z → ``γ, Υ → ``, and J/ψ → `` events [75–77]. Uncertainties on the detector response are assessed similarly to other ATLAS analyses. The modeling of the efficiency of the tight isolation requirements in simulation is explicitly checked as a function of the number of jets in the event. These corrections are found to be very small, with uncertainties limited by data statistics.
The largest jet-related systematic uncertainty arises from the jet energy scale, in particular the in-situ calibration in data, the varying response to quark and gluon jets, and the pileup subtraction.
Because only one (of typically two) b-jets present in signal or t¯ tV events is required to be tagged, the uncertainty on the b-tagging efficiency (while included) does not have as large an effect on this analysis as it does on other t¯ tH searches such as those targeting the H → b b ¯ decay. The impact of the b-tagging e ffi ciency uncertainty on the signal strength µ = σ t¯ tH,obs /σ t¯ tH,SM at the best fit value of µ is ∆ µ = + −0.06 0.08 .
The uncertainties on the inclusive t¯ tH production cross section are discussed in Section 3.1. Addi- tionally, the effects of PDF uncertainty, QCD scale choice, and parton shower algorithm on the signal acceptance in each analysis category are considered. The resulting relative variations on the acceptance are 0.3–1.4% for PDF, 0.1–2.7% for scale choice, and 1.5–13% for parton shower algorithm.
For most backgrounds the uncertainties from Monte Carlo simulation statistics are negligible. For
the diboson backgrounds, however, these can reach 50% of the total uncertainties shown in Table 2.
Table 2: Expected and observed yields in each channel. Uncertainties shown are the quadrature sum of systematic uncertainties and Monte Carlo simulation statistical uncertainties. “Non-prompt” includes the misidentified τ had background to the 1`2τ had category. Rare processes (tZ, t¯ tWW , triboson production, t¯ tt¯ t, tH) are not shown as a separate column but are included in the total expected background estimate.
Category q mis-id Non-prompt t tW ¯ t tZ ¯ Diboson Expected Bkg. t tH ¯ (µ = 1) Observed ee + ≥ 5 j 1.1 ± 0.5 2.3 ± 1.2 1.4 ± 0.4 0.98 ± 0.32 0.47 ± 0.42 6.5 ± 2.0 0.73 ± 0.11 10 eµ + ≥ 5 j 0.85 ± 0.35 6.7 ± 2.4 4.8 ± 1.4 2.1 ± 0.7 0.38 ± 0.32 15 ± 4 2.13 ± 0.31 22 µµ + ≥ 5 j – 2.9 ± 1.4 3.8 ± 1.1 0.95 ± 0.31 0.69 ± 0.63 8.6 ± 2.5 1.41 ± 0.21 11 ee + 4 j 1.8 ± 0.7 3.4 ± 1.7 2.0 ± 0.4 0.75 ± 0.25 0.74 ± 0.58 9.1 ± 2.3 0.44 ± 0.06 9
eµ + 4 j 1.4 ± 0.6 12 ± 4 6.2 ± 0.9 1.5 ± 0.2 1.9 ± 1.2 24.0 ± 4.5 1.16 ± 0.14 26
µµ + 4 j – 6.3 ± 2.6 4.7 ± 0.9 0.80 ± 0.26 0.53 ± 0.30 12.7 ± 3.0 0.74 ± 0.10 20
3` – 3.2 ± 0.7 2.3 ± 0.9 3.9 ± 0.9 0.86 ± 0.59 11.4 ± 3.1 2.34 ± 0.32 18
2`1τ
had– 0.4
+−0.40.60.38 ± 0.15 0.37 ± 0.09 0.12 ± 0.15 1.4 ± 0.6 0.47 ± 0.02 1
1`2τ
had– 15 ± 5 0.17 ± 0.07 0.37 ± 0.10 0.41 ± 0.42 16 ± 6 0.68 ± 0.07 10
4` Z-enr. – . 10
−3. 3 × 10
−30.43 ± 0.13 0.05 ± 0.02 0.55 ± 0.17 0.17 ± 0.01 1
4` Z-dep. – . 10
−4. 10
−30.002 ± 0.002 . 2 × 10
−50.007 ± 0.005 0.03 ± 0.00 0
13
Number of jets
2 3 4 5 6 7 8
Events
0 10 20 30 40 50 60 70
80
Data 2012RareVV Z t t W t t Non-Prompt Charge misID
H(125) t t
ATLAS
Preliminary = 8 TeV, 20.3 fb-1s
category τhad
2l0
Number of jets
2 3 4 5 6 7 8
Events
0 2 4 6 8 10 12 14 16
18
Data 2012Rare VV
Z t t W t t Non-Prompt
H(125) t t
ATLAS
Preliminary = 8 TeV, 20.3 fb-1s
category 3l
Number of jets
2 3 4 5 6 7 8
Events
0 1 2 3 4
Data 2012 Rare VV
Z t t W t t Non-Prompt
H(125) t t
ATLAS
Preliminary = 8 TeV, 20.3 fb-1s
category τhad
2l1
Number of jets
2 3 4 5 6 7 8
Events
0 1 2 3 4
Data 2012 Rare VV
Z t t W t t Non-Prompt
H(125) t t
ATLAS
Preliminary = 8 TeV, 20.3 fb-1s
category 4l
Number of jets
2 3 4 5 6 7 8
Events
0 2 4 6 8 10 12 14
16
Data 2012Rare VV
Z t t W t t t t
H(125) t t
ATLAS
Preliminary = 8 TeV, 20.3 fb-1s
category τhad
1l2