ATLAS-CONF-2012-070 06July2012
ATLAS NOTE
ATLAS-CONF-2012-070
June 27, 2012
Search for light top squark pair production in final states with leptons and b-jets with the ATLAS detector in √
s = 7 TeV proton–proton collisions
The ATLAS Collaboration
Abstract
The results of a search for pair production of light top squarks are presented, us- ing 4.7 fb
−1of
√s=
7 TeV proton–proton collisions with the ATLAS detector at the Large Hadron Collider. This search targets top squarks with masses similar to, or lighter than, the top quark mass. Final states containing exclusively one or two lep- tons (
e,µ), large missing transverse momentum, light flavour jets and
b-jets are used to reconstruct the top squark pair system. Global mass scale variables are used to separate the signal from a large
t ¯tbackground. No excess over the Standard Model expectation is found. The results are interpreted in the framework of the minimal supersymmetric Standard Model, assuming the top squark decays exclusively to a chargino and a
b-quark. Light top squarks with masses from 120 GeV up to the topmass are excluded for neutralino masses around 55 GeV.
c Copyright 2012 CERN for the benefit of the ATLAS Collaboration.
Reproduction of this article or parts of it is allowed as specified in the CC-BY-3.0 license.
1 Introduction
Supersymmetry (SUSY) [1–9] is an extension of the Standard Model (SM) which naturally re- solves the hierarchy problem by introducing supersymmetric partners to the known fermions and bosons. In the framework of a generic R-parity conserving minimal supersymmetric ex- tension of the SM (MSSM) [10–14], SUSY particles are produced in pairs and the lightest super- symmetric particle (LSP) is stable. In a large variety of models the LSP is the lightest neutralino,
χ˜
10, which only interacts weakly. The scalar partners of right-handed and left-handed quarks (squarks) can mix to form two mass eigenstates (
q˜
1,q˜
2). Large mixing in the third generation sector can yield top squarks (stop, ˜t
1,2) with one of the mass eigenstates significantly lighter than the other squarks. In particular, the lightest stop, ˜t
1, could have a mass similar to, or lower than, the top quark mass, as favoured by Electroweak Baryogenesis MSSM scenarios [15, 16].
In this letter, a search for direct stop pair production is presented targetting these scenarios.
A SUSY particle mass hierarchy is assumed such that
mt &m˜t1 >mχ˜±
1
and that the stop decays exclusively into a
b-quark and chargino (˜t
1 →χ˜
1±b). The chargino subsequently decays via avirtual or real
Wboson (
χ˜
1±→W(∗)χ˜
10). The masses of all other supersymmetric particles are assumed to be above the TeV scale, and large stop gauge mixing results in
m˜t2 ≫m˜t1
. In the case where
m˜t1 ∼mt
, direct stop pair production will lead to final states very similar to SM
t ¯tevents, which form the dominant background. In the first stage of the analysis the
t ¯tsystem (including stop pairs) is reconstructed from final states which contain exclusively one or two leptons (ℓ
=e,µ),
b-jets, light flavour jets, and large missing transverse momentum. The useof global mass scale variables allows discrimination between stop pairs and the
t ¯tbackground.
The results are interpreted in three MSSM scenarios where stop and neutralino masses are var- ied and different assumptions are made about the chargino-neutralino mass difference: gaug- ino universality (m
χ˜±1 ≃
2
×mχ˜01
); fixed chargino mass at 106 GeV (above the present exclusion limit from LEP [17]); and fixed stop mass of 180 GeV with variations of the chargino-neutralino mass difference. Previous results on direct production of top squark pairs in the same MSSM scenarios have been presented by the CDF [18] and ATLAS collaborations [19].
2 The ATLAS Detector
The ATLAS detector is described in detail elsewhere [20]. It comprises an inner detector (ID) surrounded by a thin superconducting solenoid, a calorimeter system and an extensive muon spectrometer embedded in a toroidal magnetic field. The ID tracking system consists of a sili- con pixel detector, a silicon microstrip detector (SCT), and a transition radiation tracker (TRT).
It provides tracking information for charged particles in a pseudorapidity
1range
|η|<2.5 and allows for efficient identification of jets originating from
b-hadron decays using impact param-eter measurements to reconstruct secondary decay vertices. The ID is immersed in a 2 T axial magnetic field and is surrounded by high-granularity liquid-argon sampling electromagnetic calorimeters. An iron-scintillator tile calorimeter provides hadronic energy measurments in the central rapidity range. In the forward regions, it is complemented by two end-cap calorimeters using liquid argon as the active material and copper or tungsten as an absorber. The muon spec- trometer (MS) surrounds the calorimeters and consists of three large superconducting eight-coil
1ATLAS uses a right-handed coordinate system with its origin at the nominal interaction point (IP) in the centre of the detector, with thez-axis coinciding with the beam pipe axis. Thex-axis points from the IP to the centre of the LHC ring, and they-axis points upwards. Cylindrical coordinates(r,φ)are used in the transverse plane,φ being the azimuthal angle around the beam pipe. The pseudorapidity is defined in terms of the polar angleθ as η=−ln tan(θ/2). The distance∆Rin theη−φspace is defined as∆R= p
(∆η)2+ (∆φ)2.
toroids, a system of tracking chambers, and detectors for triggering.
3 Simulated Event Samples
Monte Carlo (MC) simulated event samples are used to develop and validate the analysis pro- cedure and to help evaluate the SM backgrounds in the signal regions. Production of top quark pairs is simulated with MC@NLO [21], using a top quark mass of 172.5 GeV and the next-to- leading order (NLO) parton distribution functions (PDF) CTEQ6.6 [22], which are used with all NLO MC codes in this analysis. Samples of
Wand
Z/γ∗production, with accompanying light and heavy flavour jets, and
t ¯twith additional
b-jets (
t ¯tb¯b) are generated using ALPGEN [23].
Samples of
Zt ¯t,W t ¯tand
WW t ¯tare generated with MADGRAPH [24] interfaced to PYTHIA [25].
Diboson (WW ,
W Z,ZZ) production is generated withHERWIG [26] and single top production with MC@NLO for the
s- andt+Wchannels, and AcerMC [27] for the
t-channel. Fragmentationand hadronisation modelling for the ALPGEN and MC@NLO samples are performed by HERWIG , using JIMMY [28] for the underlying event. ALPGEN and POWHEG [29] samples are used to as- sess the systematic uncertainties associated with the choice of generator for
t ¯tproduction, and AcerMC samples are used to assess the uncertainties associated with initial and final state radi- ation (ISR/FSR). The choice of PDF depends on the generator. MRST2007 LO [30] sets are used for HERWIG , CTEQ6L1 [31] with ALPGEN . The background predictions are normalised to the theoretical cross sections, including higher-order QCD corrections when available, as detailed in Ref. [32].
Direct stop pair production samples are generated using PYTHIA6 and HERWIG++ [33]. Sig- nal cross sections are calculated to NLO in the strong coupling constant, including the resum- mation of soft gluon emission at next-to-leading-logarithmic accuracy (NLO + NLL) [34–36].
The nominal cross section and the uncertainty are taken from an envelope of cross section pre- dictions using different PDF sets and factorisation and renormalisation scales, as described in Ref. [37].
All MC samples are produced using the ATLAS MC11c parameter tune [38] and a GEANT4 [39]
based detector simulation [40]. MC samples are re-weighted such that the number of additional proton–proton interactions per bunch crossing (pile-up) agrees with that expected in data.
4 Object Reconstruction
Electron candidates are reconstructed from energy clusters in the electromagnetic calorimeters matched to a track in the ID. They are required to have
pT>20 GeV,
|η|<2.47 and to pass the
“medium” shower shape and track selection criteria of Ref. [41].
Muons are reconstructed using an algorithm [42] that combines information from the ID and MS. Candidate muons are required to have
pT>10 GeV,
|η|<2.4, and be reconstructed with a sufficient number of hits in the pixel, SCT and TRT detectors. In order to reject muons originating from cosmic rays, events containing muon candidates with a distance of closest approach of greater than 1 mm to the primary vertex in the
zdirection, or an impact parameter of greater than 0.2 mm, are rejected. The primary vertex itself is defined as the vertex with the highest summed track
p2T.
Jet candidates are reconstructed using the anti-k
tjet clustering algorithm [43] with a distance
parameter of
R=0.4. The measured jet energy is corrected for inhomogeneities and for the non-
compensating nature of the calorimeter using
pTand
ηdependent correction factors based on
MC simulation validated with extensive test-beam and collision-data studies. Furthermore,
the reconstructed jet is modified such that its direction points to the primary vertex and events containing jets likely to have arisen from detector noise or cosmic rays are rejected [44]. Only jet candidates with corrected transverse momenta
pT>20 GeV and
|η|<4.5 are retained.
Following object reconstruction, candidate jets and leptons may point to the same energy deposits in the calorimeter. These overlaps are resolved by first discarding any jet candidates within
∆R<0.2 of an electron. Then, any electron or muon candidate remaining within
∆R<0.4 of any surviving jet is also discarded.
The missing transverse momentum two-vector,
pmissT, and its magnitude
ETmiss, are computed from the negative of the vector sum of the
pTof the reconstructed electrons, muons and jets, and all calorimeter clusters with
|η|<4.9 not associated with such objects.
Following the overlap removal, electrons must additionally pass the “tight” electron criteria of Ref. [41], and be isolated such that the scalar
pTsum of tracks within a cone of
∆R<0.2 around the electron candidate (not including the electron track) must be less than 10% of the electron
pT. Muons must also be isolated such that the
pTsum of tracks (not including the muon track) within
∆R<0.2 is less than 1.8 GeV. Jets are further required to lie within
|η|<2.5 and have a reasonably high fraction of track
pTassociated with the primary vertex. This reduces the presence of jets arising from uncorrelated soft collisions (pile-up) and discards jets without reconstructed tracks.
A
b-tagging algorithm [45] is used to identify jets containing ab-hadron decay. The algo-rithm uses a multivariate technique based on the properties of the secondary vertex, of tracks within the jet, and of the jet itself. The nominal
b-tagging efficiency, computed on
t ¯tMC events, is on average 60%, with a misidentification (mis-tag) rate for
c-quark (light-quark/gluon) jetsof less than 10% (1%).
5 Event Selection
Application of beam, detector and data-quality requirements gives a total integrated luminos- ity of 4.7
±0.2 fb
−1, measured as described in Refs. [46, 47]. The data are selected with a three- level trigger system used to select single lepton events, using requirements that vary with the data-taking period. The tightest electron trigger has an efficiency of
∼97% for electrons with
pT>25 GeV. The equivalent muon trigger reaches an efficiency plateau of
∼75% (
∼90%) in the barrel (end-caps) for muons with
pT>20 GeV . Collision events are selected by requiring a reconstructed vertex with at least five associated tracks, consistent with the beam spot posi- tion. Two signal regions are defined containing either exclusively one or two charged leptons (
ℓ=e,µ) in the final state, hereafter referred to as the 1- and 2-lepton channels respectively.
In the 1-lepton channel, events are required to contain the minimum number of objects ex- pected from the semi-leptonic decay of the
t ¯tsystem. Exactly one lepton is required, which must have
pT>25 GeV ( 20 GeV ) for the electron (muon) channel and fulfill the trigger require- ments. Events with an additional electron (muon) with
pT>20 GeV (10 GeV) are rejected to ensure no events are selected by both the 1- and 2-lepton channels. A minimum of four jets is re- quired in the event, at least two of which must pass the
b-tagging requirements and at least two must fail them. Events are required to have a missing transverse momentum of
ETmiss>40 GeV.
Background from multi-jet processes, in which jets are misidentified as leptons, is rejected by requiring that the transverse mass (
mT) of the lepton and
ETmissis larger than 30 GeV .
The invariant mass of the hadronic top decay products (m
thad) is used as an additional dis-
criminating variable. In scenarios where the stop is lighter than the top,
mthadwill tend to be
lower than for background
t ¯tprocesses, as illustrated in Fig. 1(a). Since there is an ambigu-
ity as to which
b-jet arises from the hadronic top decay (and additional ambiguities at higherjet multiplicities), the hadronic decay products are tagged using the following algorithm: for every possible combination of light and
b-tagged jets in the event, the invariant masses mWhad(=
mj j),
mlepW(assuming that the lepton and
ETmissarise from the
W→ℓνdecay),
mhadtand
mlept(the leptonic top mass) are calculated. A top estimator of
Ptot=P(mWhad)P(mlepW )P(mlept )P(mhadt )is assigned to this combination, where
P(m)is related to the probability for reconstructing a parti- cle of mass
m, assuming a Gaussian probability density function with mean values taken from Ref. [48] and experimentally measured widths. The combination which maximises
Ptotis used to assign one
b-jet and two light flavour jets (oneb-jet, the lepton andETmiss) as arising from the hadronic (leptonic) decay of the top quark. Events are then required to have
mhadt <µˆ
−0.5 ˆ
σ,where
µˆ and
σˆ are the mean and width respectively of a Gaussian fit to the
mthaddistribution in a 40 GeV window around the top mass. This approach is taken to reduce some of the systematic uncertainties, as detailed in Section 6.
In the 2-lepton channel, the following requirements are imposed to ensure that the event contains the required number of objects consistent with the di-leptonic decay of the
t ¯tsys- tem. Exactly two oppositely-charged leptons are required which pass the selection described in Section 4. For same-flavour pairs, the highest
pTlepton is required to have
pT>25 GeV (20 GeV) for electrons (muons). In the case of different flavour pairs, either the electron must have
pT>25 GeV or the muon
pT>20 GeV . At least two jets are required in the event, of which the two with highest
pTare assumed to originate from the
t ¯tprocess. At least one of these two jets is required to be
b-tagged. The event is required to fulfillETmiss>40 GeV and the invariant mass of the two leptons
(mℓℓ)must satisfy 30
<mℓℓ<81 GeV .
In order to distinguish between stop and top pair production the mass scale subsystem variable
√s(sub)min
[49] is employed. The variable is constructed by dividing an event topology into a subsystem comprising both visible and invisible particles originating from the process of interest. The remaining visible particles are labeled as coming from upstream processes such as the underlying event or ISR. With these definitions, the minimum invariant mass compatible with the subsystem is:
√s(sub)min = (
q
m2(sub)+pT2(sub)+ q
(mmiss)2+ ETmiss22
−
pT(sub)+pmissT 212
,
(1)
where
m(sub)and
pT(sub)are the invariant mass and the transverse momentum of the visible sub- system particles. The variable
mmissrepresents the assumed invariant mass of all the invisible particles in the event. The final term in Eq. 1 is a two-vector sum representing the boost correc- tion in the transverse plane caused by upstream processes. In this analysis
√s(sub)min
is calculated assuming each event arises from
t ¯tproduction, with the invisible subsystem comprising one or two neutrinos, and therefore
mmiss=0 in Eq. 1. With this assumption, the
√s(sub)min
distribution for
t ¯tbackground events is expected to peak at around
mt ¯t=2m
t≃345 GeV . On the other hand, stop pair production will peak at lower values if the mass difference between the stop and the neutralino is lower than the top mass, as illustrated in Fig. 1(b) and 1(d). Signal events are therefore selected by imposing an upper limit on
√s(sub)min
.
In the 1-lepton channel, the visible subsystem comprises the single lepton, two light and
two
b-jets giving the highest estimator in the algorithm described above. In the 2-lepton chan-
nel, the two leptons and the two leading jets are used. In both channels, an upper limit on
√s(sub)min
has been chosen with a value which maximises the expected signal efficiency with re- spect to background rejection, across a range of scenarios described in Section 1. In the 1-lepton channel, the optimal requirement found is
√s(sub)min <
250 GeV, defining a signal region hereafter referred to as 1LSR. In the 2-lepton channel two signal regions are defined, the first requiring
√s(sub)min <
225 GeV (2LSR1), and the second (tighter) signal region (2LSR2) with
√s(sub)min <
235 GeV together with an upper limit on the invariant mass of the two leptons and two jets (
mℓℓj j) re- quiring
mℓℓj j<140 GeV.
6 Background Estimation
The dominant SM background process in the 1-lepton (2-lepton) channel arises from semi- leptonic (di-leptonic)
t ¯tdecays, comprising 60% (80%) of the total background. The second most significant background in the 1-lepton (2-lepton) channel arises from
W(Z/
γ∗) produc- tion in association with jets from heavy flavour quarks. For both channels, similar methods are used to estimate these backgrounds. For each channel and background process a control region is defined that is rich in the background of interest. The region is kinematically similar to the signal region but distinct from it, such that the signal and control regions have no events in common. For a control region containing
NCRobsobserved events (corrected for the contam- ination from other backgrounds), the number of events in the signal region is calculated as
NSR= (NSRMC×NCRobs)/NCRMC, where
NSRMCand
NCRMCare the MC-based estimates in the signal and control regions respectively. The advantage of this method is that many systematic uncertain- ties partially cancel out.
In the 1-lepton channel, the
t ¯tbackground is determined with a control region defined by identical cuts to the signal region, except that
µˆ
−0.5 ˆ
σ<mhadt <µˆ
+0.5 ˆ
σand
√s(sub)min <
320 GeV, with a
t ¯tpurity of 93%. The definition of a control region using these fitted parameters re- duces the systematic uncertainties related to the jet energy scale and resolution. A high-purity
W+b-jets control region is more difficult to define due to the kinematic similarity with
t ¯tevents, which have a higher fiducial cross section. A control region can, however, be defined with 38%
purity for
Wevents by requiring
mthad>250 GeV and
mb¯b<50 GeV. As the
t ¯tcontamination in this region is still relatively high (60%), the
Wand
t ¯tcontributions are determined simultane- ously in both control regions.
In the 2-lepton channel, the
t ¯tbackground (including dileptonic
W tdecays) is determined using a control region identical to the signal region except that
mℓℓ>101 GeV and
√s(sub)min <
325 GeV, with 94% purity of
t ¯tevents. The
Zbackground is determined in a region requiring two same-flavour leptons, 81
<mℓℓ<101 GeV and
√s(sub)min <225 GeV , with a
Zpurity of 90%.
The contribution to the background from events where one of the jets is misidentified as a lepton, or where a lepton from a
bor
chadron decay is selected (refered to as “fake” lepton background), is estimated using a data-driven technique in both channels [41, 50]. The prob- ability that a jet is misidentified as a lepton is estimated by relaxing the electron and muon identification criteria to obtain control samples dominated by multi-jet production. In the 1- lepton channel, the main contribution is from multi-jet events. In the 2-lepton channel, the dominant contribution is from processes containing one real and one fake lepton, such as
Wor semi-leptonic
t ¯tdecays. The contribution from events containing two fake leptons was found to be negligible.
Other less significant processes in the 1-lepton channel include
Z/γ∗+jets and single top
quark production. Dibosons and
t ¯t+X (X =W,Z,WW,b¯b)give a minor contribution to both
channels. The contribution to the total background from these processes (referred to as “Oth-
0 50 100 150 200 250 300 350 400 450 500
Events / 10 GeV
1 10 102
103
104
105
106
1-lepton, >= 2 bjets
Data 2011 SM Total Top W Others Multi-jet
)=(170,140,70) GeV 1
χ∼0 1, χ∼± 1,
~t (
)=(180,140,20) GeV 1
χ∼0 , 1 χ∼± 1,
~t ( = 7 TeV
s
-1, L dt = 4.7 fb
∫
ATLAS Preliminary
[GeV]
had
mt
0 50 100 150 200 250 300 350 400 450 500
Data / SM
0 0.5 1 1.5 2
>
(a)
0 100 200 300 400 500 600 700 800 900 1000
Events / 25 GeV
1 10 102
103
104
105
(sub) cut smin
1-lepton, SR, no
Data 2011 SM Total Top W Others Multi-jet
)=(170,140,70) GeV 1
χ∼0 1, χ∼± 1, t~ (
)=(180,140,20) GeV 1
χ∼0 , 1 χ∼± 1, t~ ( = 7 TeV
s
-1, L dt = 4.7 fb
∫
ATLAS Preliminary
[GeV]
(sub)
smin
0 100 200 300 400 500 600 700 800 900 1000
Data / SM
0 0.5 1 1.5 2
>
(b)
40 60 80 100 120 140 160 180 200 220
Events / 5 GeV
1 10 102
103
104
105
2-lepton
Data 2011 SM Total Top Z + Drell Yan Fakes Others
) = (170,140,70) GeV 0
χ∼1
±, χ∼1 1, t~ (
) = (180,140,20) GeV 0
χ∼1
±, χ∼1 1, t~ (
ATLAS Preliminary = 7 TeV s
-1, L dt = 4.7 fb
∫
L dt = 4.7 fb-1, s = 7 TeV∫
[GeV]
mll
40 60 80 100 120 140 160 180 200 220
Data / SM
0 0.5 1 1.5 2
>
(c)
0 100 200 300 400 500 600 700 800 900 1000
Events / 25 GeV
1 10 102
103
104
105
< 81 GeV 2-lepton, 30 < mll
Data 2011 SM Total Top Z + Drell Yan Fakes Others
) = (170,140,70) GeV 0
χ∼1
±, χ∼1 1,
~t (
) = (180,140,20) GeV 0
χ∼1
±, χ∼1 1,
~t (
ATLAS Preliminary = 7 TeV s
-1, L dt = 4.7 fb
∫
L dt = 4.7 fb-1, s = 7 TeV∫
[GeV]
(sub)
smin
0 100 200 300 400 500 600 700 800 900 1000
Data / SM
0 0.5 1 1.5 2
>
(d)
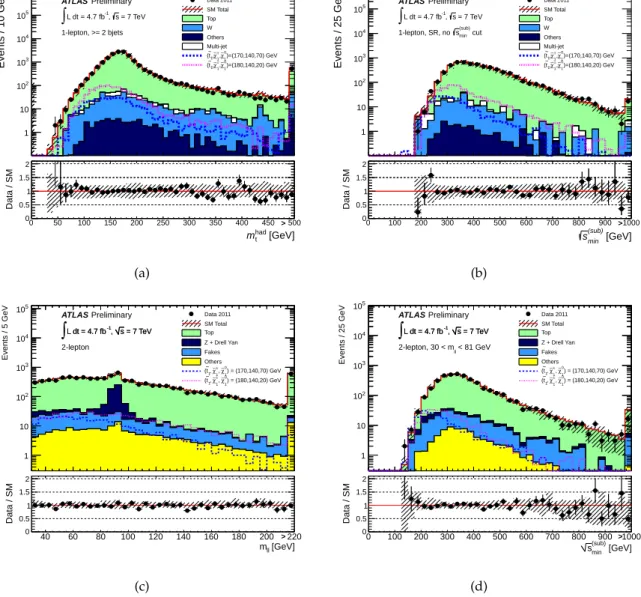
Figure 1: The 1-lepton channel
mhadtdistribution after all requirements except those on
mhadtand
√s(sub)min
(a), and the
√s(sub)min
distribution after all requirements except that on
√s(sub)min
(b). For the 2-lepton channel, the
mℓℓdistribution is shown after all requirements except those on
mℓℓand
√s(sub)min
(c), and the
√s(sub)min
distribution, before the requirements on
√s(sub)min
itself (d). In all the cases, the MC contributions are normalised to the expected event yield in the corresponding control regions, except in (c), for which no additional normalisation is applied to the
ZMC prediction. The hatched bands display the total uncertainties on the background expectation and the final bin in each histogram contains the integral of all events with values greater than the upper axis bound. The dashed lines show the expectations for two signal models with stop (neutralino) masses of 170 (70) and 180 (20) GeV, both with a chargino mass of 140 GeV.
The bottom panels show the ratio of data to the expected background (points) and the total uncertainty on the background (hatched area).
ers” in the following and in Fig. 1) is 2.5% (2%) in the 1-lepton (2-lepton) channel, and are taken directly from the MC prediction.
Distributions of
√s(sub)min
in the 1-lepton control regions can be found in Fig. 2, while the
0 200 400 600 800 1000 1200 1400 1600
Events / 50 GeV
1 10 102
103
104
105
1-lepton, Top CR
Data 2011 SM Total Top W Others Multi-jet
)=(170,140,70) GeV 1
χ∼0 1, χ∼± 1,
~t (
)=(180,140,20) GeV 1
χ∼0 , 1 χ∼± 1,
~t ( = 7 TeV
s
-1, L dt = 4.7 fb
∫
ATLAS Preliminary
[GeV]
(sub)
smin
0 200 400 600 800 1000 1200 1400 1600
Data / SM
0 0.5 1 1.5 2
>
(a)
300 400 500 600 700 800 900 1000
Events / 20 GeV
1 10 102
103
1-lepton, W CR
Data 2011 SM Total Top W Others Multi-jet
)=(170,140,70) GeV 1
χ∼0 1, χ∼± 1, t~ (
)=(180,140,20) GeV 1
χ∼0 , 1 χ∼± 1, t~ ( = 7 TeV
s
-1, L dt = 4.7 fb
∫
ATLAS Preliminary
[GeV]
(sub)
smin
300 400 500 600 700 800 900 1000
Data / SM
0 0.5 1 1.5 2
>
(b)
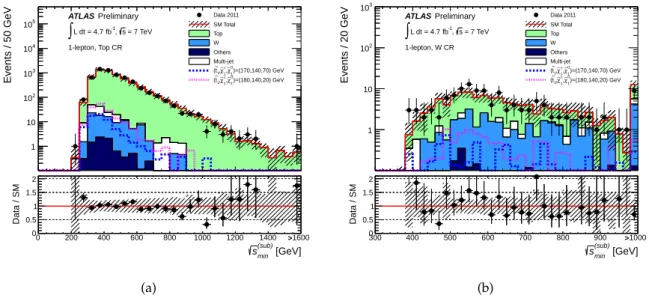
Figure 2: The 1-lepton
√s(sub)min
distributions shown in the top (before the
√s(sub)min
cut) (a) and
W(b) control regions as described in the text. The MC distributions are shown after the nor- malisation of the
t ¯tand
Wcontributions to the corresponding control region yields. The hatched bands display the total uncertainties on the background expectation and the final bin in each histogram contains the integral of all events with values greater than the upper axis bound.
The dashed lines show the expectations for two signal models with stop (neutralino) masses of 170 (70) and 180 (20) GeV, both with a chargino mass of 140 GeV. The bottom panels show the ratio of data to the expected background (points) and the total uncertainty on the background (hatched area).
corresponding 2-lepton distributions are shown in Fig. 3(a) and 3(b) for the top and
Zcontrol regions respectively. Fig. 3(c) also shows the distribution of
mℓℓj jbefore the final selection requirements which define 2LSR2.
7 Systematic Uncertainties
The contribution to the systematic uncertainty from the jet energy scale (JES) uncertainty is cal- culated by shifting the
pTof all jets up and down by
pTand
ηdependent factors, which vary from 5–3% for jets with
pTfrom 20–60 GeV. Repeating the analysis with these
pTshifts applied to the MC leads to variations on the final background estimate of 6–10% depending on the sig- nal region. The uncertainty due to the jet energy resolution (JER) is calculated by smearing the
pTof each jet by factors depending on the jet
pTand
η. The smearing on a single jet is typicallyaround 10%, and results in an overall uncertainty of 1–10%. Uncertainties in the lepton identifi- cation efficiency amount to a 1% systematic uncertainty. The uncertainty on the
ETmissdue to the energy scale of calorimeter clusters not associated with jets and electrons is evaluated using the method described in Ref. [51], extended to include dedicated pile-up uncertainties. The effect is up to 9% depending on the signal region. The uncertainty due to
b-tagging is evaluated byvarying the
b-tagging efficiency and mis-tag rates within the uncertainties of the measured val-ues [52, 53], giving an effect of 1% in all signal regions. The uncertainty associated with pile-up re-weighting is evaluated by varying the number of interactions per bunch-crossing by 10%.
The overall effect on the predicted background yield is at most 3%.
0 100 200 300 400 500 600 700 800 900 1000
Events / 25 GeV
1 10 102
103
104
> 101 GeV 2-lepton mll
Data 2011 SM Total Top Z + Drell Yan Fakes Others
) = (170,140,70) GeV 0
χ∼1
±, χ∼1 1, t~ (
) = (180,140,20) GeV 0
χ∼1
±, χ∼1 1, t~ (
ATLAS Preliminary = 7 TeV s
-1, L dt = 4.7 fb
∫
L dt = 4.7 fb-1, s = 7 TeV∫
[GeV]
(sub)
smin
0 100 200 300 400 500 600 700 800 900 1000
Data / SM
0 0.5 1 1.5 2
>
(a)
0 100 200 300 400 500 600 700 800 900 1000
Events / 25 GeV
1 10 102
103
104
< 101 GeV 2-lepton 81 < mll
Data 2011 SM Total Top Z + Drell Yan Fakes Others
) = (170,140,70) GeV 0
χ∼1
±, χ∼1 1,
~t (
) = (180,140,20) GeV 0
χ∼1
±, χ∼1 1,
~t (
ATLAS Preliminary = 7 TeV s
-1, L dt = 4.7 fb
∫
L dt = 4.7 fb-1, s = 7 TeV∫
[GeV]
(sub)
smin
0 100 200 300 400 500 600 700 800 900 1000
Data / SM
0 0.5 1 1.5 2
>
(b)
0 100 200 300 400 500 600 700 800
Events / 20 GeV
1 10 102
103
104
< 81 GeV 2-lepton, 30 < mll
Data 2011 SM Total Top Z + Drell Yan Fakes Others
) = (170,140,70) GeV 0
χ∼1
±, χ∼1 1,
~t (
) = (180,140,20) GeV 0
χ∼1
±, χ∼1 1,
~t (
ATLAS Preliminary = 7 TeV s
-1, L dt = 4.7 fb
∫
L dt = 4.7 fb-1, s = 7 TeV∫
[GeV]
mlljj
0 100 200 300 400 500 600 700 800
Data / SM
0 0.5 1 1.5 2
>
(c)
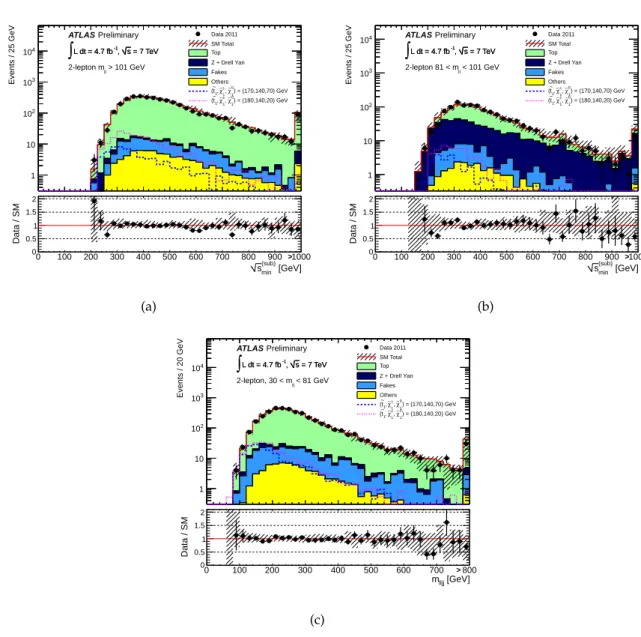
Figure 3: The 2-lepton
√s(sub)min
regions shown in the top (a) and
Z(b) control regions defined in the text, before applying the upper limit on
√s(sub)min
itself. The
mℓℓj jdistribution is also shown (c)
after the requirement 30
<mℓℓ<81 GeV. In all the cases, the top contribution is normalised to
the control region yield but the additional
Znormalisation is only taken into account in (c). The
hatched bands display the total uncertainties on the background expectation and the final bin
in each histogram contains the integral of all events with values greater than the upper axis
bound. The dashed lines show the expectations for two signal models with stop (neutralino)
masses of 170 (70) and 180 (20) GeV, both with a chargino mass of 140 GeV. The bottom panels
show the ratio of data to the expected background (points) and the total uncertainty on the
background (hatched area).
Number of events
Process 1LSR 2LSR1 2LSR2
Top 24
±3
±5 89
±6
±10 36
±2
±5
W
+jets 6
±1
±2 n/a n/a
Z
+jets 0.5
±0.3
±0.3 11
±4
±3 3
±1
±1
Fake leptons 7
±1
±2 12
±5
±11 6
±4
±4
Others 0.3
±0.1
±0.1 2.7
±0.9
±0.7 0.9
±0.2
±0.5
Total SM 38
±3
±7 115
±8
±15 46
±4
±7
Data 50 123 47
m˜t
1 =
170 GeV,
mχ˜01 =
70 GeV 26
±2
±6 57
±3
±6 36
±2
±4
m˜t1 =
180 GeV,
mχ˜01 =
20 GeV 20
±2
±4 41
±3
±5 27
±2
±3 95% CL upper limits
σvis
(expected) [fb] 4.2 9.3 4.6
σvis
(observed) [fb] 6.1 11 5.2
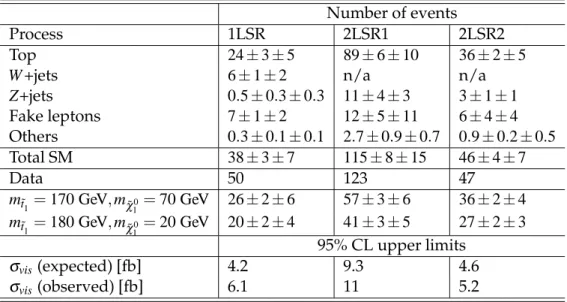
Table 1: Predicted and observed number of events in all signal regions together with their statistical and systematic uncertainties. No values are shown for the
W+jets contribution in the 2-lepton channel as these are included in the fake contribution. The expected number of events for two signal scenarios, both with a chargino mass of 140 GeV, are also shown. The observed and expected upper limits at 95% confidence level on
σvis=σ·A·εare also given.
Theoretical uncertainties on the
t ¯tbackground due to the choice of generator are evalu- ated by comparing event yields from MC@NLO to those from POWHEG with the same parton shower model ( HERWIG ). The parton shower uncertainties are then calculated by comparing samples generated with the HERWIG and PYTHIA parton shower models, with the same gener- ator ( POWHEG ). The uncertainty due to ISR/FSR is assessed using AcerMC samples with vari- ations of PYTHIA parameters related to the ISR branching phase-space and the FSR low-
pTcutoff. These variations are chosen to produce jet activity in
t ¯tevents that is consistent with the data [54, 55]. The total uncertainty on the
t ¯testimate due to these effects amounts to 10–15%.
Uncertainties due to the PDF choice and errors are found to be negligible.
In the 1-lepton channel, the theoretical uncertainty in the
Westimate due to variations of the factorisation, renormalisation and matching scales is found to be 15%. Similar uncertainties on the
Z/γ∗contribution in the 2-lepton channel are 9% (2%) in 2LSR1 (2LSR2).
Uncertainties on the data-driven background from fake leptons arise from the lepton fake rate determination and from the definition of the fake-enriched control regions. The effect is between 45–84% of the fake contribution.
Theoretical uncertainties on stop pair production are calculated as described in Section 3.
Signal uncertainties related to the JES, JER and
b-tagging are treated as fully correlated withthe respective background uncertainties. Finally, the luminosity uncertainty is 3.9%.
8 Results and Interpretation
Table 1 reports the observed number of events in data and the SM predictions for the signal regions of the 1- and 2-lepton channels. In all SRs, the data are in good agreement with the SM expectations. Fig. 1 shows the observed
mhadtand
√s(sub)min
(m
ℓℓand
√s(sub)min
) distributions
for the 1-lepton (2-lepton) channels compared to the SM predictions. MC estimates for these
predictions are used, where the total prediction and systematic uncertainty are scaled to match
the results obtained from the top and
W+jets (Z+jets) 1-lepton (2-lepton) control regions. Theexpected distributions for two MSSM scenarios are also shown for illustrative purposes.
The results are translated into 95% confidence-level (CL) upper limits on contributions from new physics using the CL
sprescription [56]. The three signal regions are used to set limits on the visible cross section
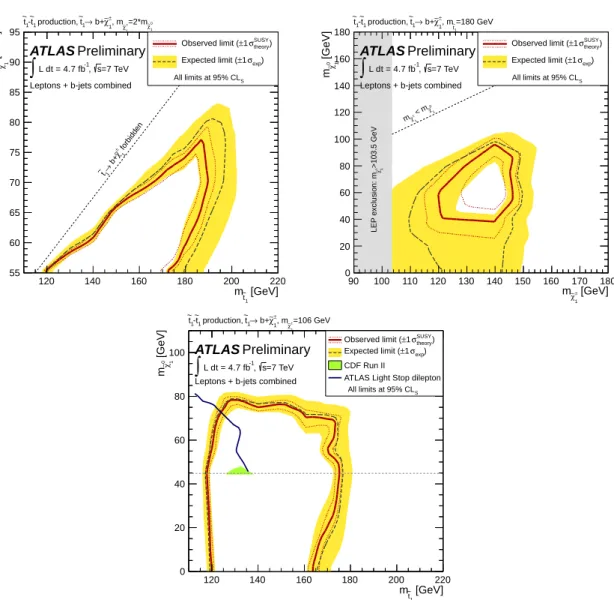
2of new physics models, as shown in Table 1. Results are interpreted in the MSSM scenarios described in Section 1. Fig. 4 presents the expected and observed limits, using a combination of 1LSR and the best expected limit from either 2LSR1 or 2LSR2. The effect of signal contamination in the control regions (typically 5–10% depending on the signal point) is taken into account. In the gaugino universality scenario, stop masses from 120 GeV up to the top mass are excluded for
mχ˜01=
55 GeV. The sensitivity of the search is also evaluated for a stop mass of 180 GeV whilst varying the chargino-neutralino mass difference. In the scenario with
mχ˜±1 =
106 GeV, stop masses are excluded from 120 GeV up to the top mass for
mχ˜01 =
55 GeV.
Neutralino masses of 75 GeV are excluded for 130
<m˜t1 <
155 GeV.
9 Conclusions
A search has been performed for top squarks with masses near or lower than the top quark mass. Good agreement is observed between data and the SM predictions in all channels. The results allow limits to be set in the
t˜
1−χ˜
10mass plane. In the two MSSM scenarios considered, stop masses from 120 GeV up to the top mass are excluded for
mχ˜01 =
55 GeV.
2The visible cross section,σvis, is defined by the product of the new physics production cross section, acceptance Aand efficiencyε.
[GeV]
t1
m~
120 140 160 180 200 220
[GeV]0 1χ∼m
55 60 65 70 75 80 85 90 95
0 χ∼1
±=2*m
χ∼1
±, m χ∼1
→ b+
t1
production, ~ t1
-~ t1
~
=7 TeV s
-1, L dt = 4.7 fb
∫
Leptons + b-jets combined
ATLAS Preliminary
forbidden
± χ∼1
→1 b+
~t
theory) σSUSY
±1 Observed limit (
exp) σ
±1 Expected limit (
All limits at 95% CLS
[GeV]
± χ∼1
m 90 100 110 120 130 140 150 160 170 180 [GeV]0 1χ∼m
0 20 40 60 80 100 120 140 160 180
=180 GeV
t1
, m~
±
χ∼1
→ b+
t1
production, ~ t1
-~ t1
~
>103.5 GeV±1χ∼LEP exclusion: m
=7 TeV s
-1, L dt = 4.7 fb
∫
Leptons + b-jets combined
ATLAS Preliminary
0 χ∼1
< m
± χ1
m∼
theory) σSUSY
±1 Observed limit (
exp) σ
±1 Expected limit (
All limits at 95% CLS
[GeV]
t1
m~
120 140 160 180 200 220
[GeV]0 1χ∼m
0 20 40 60 80 100
=106 GeV
± χ∼1
±, m χ∼1
→ b+
t1
production, ~ t1
-~ t1
~
=7 TeV s
-1, L dt = 4.7 fb
∫
Leptons + b-jets combinedATLAS Preliminary theory)
σSUSY
±1 Observed limit (
exp) σ
±1 Expected limit ( CDF Run II
ATLAS Light Stop dilepton All limits at 95% CLS
Figure 4: Exclusion limits at 95% CL for the three scenarios described in the text. The dashed black and solid red lines show the expected and observed limits, respectively, including all uncertainties except for the theoretical signal cross section uncertainty (PDF and scale). The yellow bands around the expected limits show the
±1σ results. The lines around the observed limits represent the results obtained when moving the nominal signal cross section up or down by the
±1σ theoretical uncertainty. For the scenarios at fixed chargino mass, results are com- pared to previous exclusion limits from the Tevatron and ATLAS experiments, where the low- est neutralino mass considered was
mχ˜01 =
45 GeV, indicated by the horizontal dotted line.
References
[1] H. Miyazawa, Baryon Number Changing Currents, Prog. Theor. Phys.
36 (6)(1966) 1266–1276.
[2] R. Ramond, Dual Theory for Free Fermions, Phys. Rev.
D3(1971) 2415–2418.
[3] Y. A. Golfand and E. P. Likhtman, Extension of the Algebra of Poincare Group Generators and Violation of p Invariance, JETP Lett.
13(1971) 323–326. [Pisma
Zh.Eksp.Teor.Fiz.13:452-455,1971].
[4] A. Neveu and J. H. Schwarz, Factorizable dual model of pions, Nucl. Phys.
B31(1971) 86–112.
[5] A. Neveu and J. H. Schwarz, Quark Model of Dual Pions, Phys. Rev.
D4(1971) 1109–1111.
[6] J. Gervais and B. Sakita, Field theory interpretation of supergauges in dual models, Nucl. Phys.
B34
(1971) 632–639.
[7] D. V. Volkov and V. P. Akulov, Is the Neutrino a Goldstone Particle?, Phys. Lett.
B46(1973) 109–110.
[8] J. Wess and B. Zumino, A Lagrangian Model Invariant Under Supergauge Transformations, Phys. Lett.
B49(1974) 52.
[9] J. Wess and B. Zumino, Supergauge Transformations in Four-Dimensions, Nucl. Phys.
B70(1974) 39–50.
[10] P. Fayet, Supersymmetry and Weak, Electromagnetic and Strong Interactions, Phys. Lett.
B64(1976) 159.
[11] P. Fayet, Spontaneously Broken Supersymmetric Theories of Weak, Electromagnetic and Strong Interactions, Phys. Lett.
B69(1977) 489.
[12] G. R. Farrar and P. Fayet, Phenomenology of the Production, Decay, and Detection of New Hadronic States Associated with Supersymmetry, Phys. Lett.
B76(1978) 575–579.
[13] P. Fayet, Relations Between the Masses of the Superpartners of Leptons and Quarks, the Goldstino Couplings and the Neutral Currents, Phys. Lett.
B84(1979) 416.
[14] S. Dimopoulos and H. Georgi, Softly Broken Supersymmetry and SU(5), Nucl. Phys.
B193(1981) 150.
[15] M. Carena, G. Nardini, M. Quiros, and C. E. Wagner, The Effective Theory of the Light Stop Scenario, JHEP
0810(2008) 062.
[16] M. Carena, G. Nardini, M. Quiros, and C. Wagner, The Baryogenesis Window in the MSSM, Nucl. Phys.
B812(2009) 243–263.
[17] LEP SUSY Working Group (ALEPH, DELPHI, L3, OPAL), Notes LEPSUSYWG/01-03.1 and 04-01.1, http://lepsusy.web.cern.ch/lepsusy/Welcome.html.
[18] CDF Collaboration, Search for Pair Production of Supersymmetric Top Quarks in Dilepton Events from
p ¯pCollisions at
√s
= 1.96 TeV, Phys. Rev. Lett.
104(2010) 251801.
[19] ATLAS Collaboration, Search for light scalar top quark pair production in final states with two leptons with the ATLAS detector in
√s=
7 TeV proton–proton collisions,
ATLAS-CONF-2012-059, https://cdsweb.cern.ch/record/1453787 .
[20] ATLAS Collaboration, The ATLAS Experiment at the CERN Large Hadron Collider, JINST
3(2008) S08003.
[21] S. Frixione, B. R. Webber, JHEP 06 (2002) 029; S. Frixione, P. Nason and B. R. Webber, JHEP 08 (2003) 007; S. Frixione, E. Laenen and P. Motylinski, JHEP 03 (2006) 092.
[22] P. M. Nadolsky et al., Implications of CTEQ global analysis for collider observation, Phys. Rev.
D78
(2008) 013004, arXiv:0802.0007 [hep-ph] .
[23] M. L. Mangano, M. Moretti, F. Piccinini, R. Pittau, and A. D. Polosa, ALPGEN, a generator for hard multiparton processes in hadronic collisions, JHEP
07(2003) 001.
[24] J. Alwall, M. Herquet, F. Maltoni, O. Mattelaer, and T. Stelzer, MadGraph 5 : Going Beyond, JHEP
1106(2011) 128, arXiv:1106.0522 [hep-ph] .
[25] T. Sjostrand, S. Mrenna, and P. Skands, PYTHIA 6.4 physics and manual, JHEP
05(2006) 026.
[26] G. Corcella et al., HERWIG 6: An event generator for hadron emission reactions with interfering gluons (including supersymmetric processes), JHEP
01(2001) 010.
[27] B. P. Kersevan and E. Richter-Was, The Monte Carlo event generator AcerMC version 2.0 with interfaces to PYTHIA 6.2 and HERWIG 6.5, 2004. arXiv:hep-ph/0405247 .
[28] J. F. J. Butterworth and M. Seymour, Multiparton interactions in photoproduction at HERA, Z. Phys.
C72(1996) 637–646.
[29] S. Frixione, P. Nason, and C. Oleari, Matching NLO QCD computations with Parton Shower similations: the POWHEG method, JHEP
11(2007) 070.
[30] A. Sherstnev and R. Thorne, Parton Distributions for LO Generators, Eur. Phys. J.
C55(2008) 553–575, arXiv:0711.2473 [hep-ph] .
[31] J. Pumplin et al., New generation of parton distributions with uncertainties from global QCD analysis, JHEP
0207(2002) 012, arXiv:hep-ph/0201195 [hep-ph] .
[32] ATLAS Collaboration, Search for supersymmetry in pp collisions at
√s= 7 TeV in final states with missing transverse momentum and b-jets with the ATLAS detector, Phys.Rev.
D85(2012) 112006, arXiv:1203.6193 [hep-ex] .
[33] M. Bahr et al., Herwig++ Physics and Manual, Eur. Phys. J.
C58(2008) 639–707.
[34] W. Beenakker, M. Kramer, T. Plehn, M. Spira, and P. M. Zerwas, Stop production at hadron colliders, Nucl. Phys.
B515(1998) 3–14.
[35] W. Beenakker, S. Brensing, M. Kramer, A. Kulesza, E. Laenen, and I. Niessen,
Supersymmetric top and bottom squark production at hadron colliders, JHEP.
1008(2010) 098.
[36] W. Beenakker, S. Brensing, M. Kramer, A. Kulesza, E. Laenen, et al., Squark and gluino
hadroproduction, Int. J. Mod. Phys.
A26(2011) 2637–2664.
[37] M. Kramer, A. Kulesza, R. van der Leeuw, M. Mangano, S. Padhi, et al., Supersymmetry production cross sections in pp collisions at
√s
= 7 TeV, arXiv:1206.2892 [hep-ph] . [38] ATLAS Collaboration, ATL-PHYS-PUB-2010-014
https://cdsweb.cern.ch/record/1303025 (2010) and ATLAS-CONF-2010-031 https://cdsweb.cern.ch/record/1277665 (2010).
[39] GEANT4 Collaboration, S. Agostinelli et al., GEANT4: A simulation toolkit, Nucl. Instrum.
Meth.
A506(2003) 250–303.
[40] ATLAS Collaboration, The ATLAS Simulation Infrastructure, Eur. Phys. J.
C70(2010) 823–874.
[41] ATLAS Collaboration, Electron performance measurements with the ATLAS detector using the 2010 LHC proton-proton collision data, Eur. Phys. J.
C72(2012) 1909.
[42] ATLAS Collaboration, Muon reconstruction efficiency in reprocessed 2010 LHC p-p collision data recorded with the ATLAS detector, ATLAS-CONF-2011-063 (2011)
https://cdsweb.cern.ch/record/1345743 .
[43] M. Cacciari, G. P. Salam, and G. Soyez, The anti-k
Tjet clustering algorithm, JHEP
04(2008) 063.
[44] ATLAS Collaboration, Jet energy measurement with the ATLAS detector in proton-proton collisions at
√s
= 7 TeV, arXiv:1112.6426 [hep-ex] . Submitted to Eur. Phys. J. C.
[45] ATLAS Collaboration, Commissioning of the ATLAS high-performance b-tagging algorithms in the 7 TeV collision data, ATLAS-CONF-2011-102, 2010.
https://cdsweb.cern.ch/record/1369219 .
[46] ATLAS Collaboration, Luminosity Determination in pp Collisions at
√s=7 TeV Using the
ATLAS Detector at the LHC, Eur.Phys.J.
C71(2011) 1630, arXiv:1101.2185 [hep-ex] . [47] ATLAS Collaboration, Luminosity Determination in pp Collisions at
√s
= 7 TeV using the ATLAS Detector in 2011, ATLAS-CONF-2011-116
http://cdsweb.cern.ch/record/1376384 (2011).
[48] Particle Data Group Collaboration, K. Nakamura et al. J. Phys.
G37(2010) 075021.
[49] P. Konar, K. Kong, K. T. Matchev, and M. Park, RECO level
√smin
and subsystem
√ smin: Improved global inclusive variables for measuring the new physics mass scale in
ETevents at hadron colliders, JHEP
1106(2011) 041.
[50] ATLAS Collaboration, Searches for supersymmetry with the ATLAS detector using final states with two leptons and missing transverse momentum in
√s
= 7 TeV proton-proton collisions, Phys.Lett.
B709(2012) 137–157.
[51] ATLAS Collaboration, Performance of Missing Transverse Momentum Reconstruction in Proton-Proton Collisions at 7 TeV with ATLAS, Eur. Phys. J.
C72(2012) 1844.
[52] ATLAS Collaboration, Observation of energetic jets in
ppcollisions at
√s=