ATLAS-CONF-2013-007 10/03/2013
ATLAS NOTE
ATLAS-CONF-2013-007
March 1, 2013
Minor Revision: March 10, 2013
Search for strongly produced supersymmetric particles in final states with two same-sign leptons and jets with the ATLAS detector using 21 fb
−1of
proton–proton collisions at √
s = 8 TeV
The ATLAS Collaboration
Abstract
A search for the production of supersymmetric particles decaying into final states with jets,
b-jets, missing transverse momentum and two isolated leptons,eor
µ, with the sameelectric charge (same-sign leptons) is presented. The analysis uses a data sample collected during 2012, which corresponds to a total integrated luminosity of 20.7 fb
−1of
√s=
8 TeV proton–proton collisions recorded with the ATLAS detector at the Large Hadron Collider.
No deviation from the Standard Model expectation is observed. Exclusion limits are derived for a mSUGRA
/CMSSM model, which is compatible with a mass of around 126 GeV for the lightest Higgs boson, and for a wide variety of simplified models of supersymmetry. The result significantly extends previous exclusion limits from several searches for Supersym- metry.
A technical problem has been found in the pseudo-experiments used to make Table 4 in the version of March 1. The excluded range in that table is somewhat expanded and the text includes a minor correction. None of the figures or conclusions have been changed.
c
Copyright 2013 CERN for the benefit of the ATLAS Collaboration.
Reproduction of this article or parts of it is allowed as specified in the CC-BY-3.0 license.
1 Introduction
Supersymmetry (SUSY) [1–9] predicts new bosonic partners for the fermions and fermionic partners for the bosons of the Standard Model (SM). In the MSSM [10–14], which is an R-parity conserving minimal supersymmetric extension of the SM, the lightest supersymmetric particle (LSP) is stable and weakly in- teracting, and SUSY particles are pair-produced in proton–proton collisions. In a large variety of models, the LSP is the lightest neutralino, ˜
χ01. The coloured superpartners of quarks and gluons, the squarks ( ˜ q) and gluinos ( ˜
g), are expected to be produced in strong interaction processes at the Large Hadron Collider(LHC). Their decays via cascades ending with the LSP would produce striking experimental signatures.
The undetected LSP results in missing transverse momentum (
pTmissand its magnitude E
missT). The final states also contain multiple jets and possibly leptons. In this note, events with two leptons of the same electric charge (same-sign leptons) and multiple jets are used to search for strongly produced supersym- metric particles. This search is motivated by the fact that gluinos are Majorana fermions, which implies that, when produced in pairs, their decay chains have a high probability to produce same-sign (SS) lepton pairs.
In the MSSM, the scalar partners of right-handed and left-handed quarks, ˜ q
Rand ˜ q
L, can mix to form two mass eigenstates, ˜ q
1and ˜ q
2, where ˜ q
1denotes the lighter particle. The RL mixing e
ffect is proportional to the corresponding SM fermion masses and therefore becomes important for the third generation. Large mixing can yield a bottom squark, ˜ b
1, and a top squark, ˜ t
1, mass eigenstates which are significantly lighter than other squarks. Light ˜ t
1and ˜ b
1squarks, and gluinos are also favoured by natural SUSY [15, 16]. Consequently, ˜ b
1and ˜ t
1could be produced with large cross sections at the LHC, either directly in pairs, or through ˜
gg˜ production with subsequent ˜
g→b b ˜
1or ˜
g→t˜ t
1decays (gluino-mediated production). Several possible decay chains can lead to same-sign leptons. For instance, the gluino- mediated top squark production, followed by the decay ˜ t
1 →t
χ˜
01, leads to four top quarks in the final state, which can produce same-sign lepton pairs when decaying leptonically. Alternatively, the decay via a chargino ( ˜
χ±1) , ˜ t
1 →b
χ˜
±1 →bW
±χ˜
01can also lead to same-sign lepton pairs. Since the production of same-sign lepton pairs is rare in the Standard Model, searches based on this signature benefit from low background.
With the expected final states, the search utilizes same-sign electron and muon pairs (ee, eµ,
µµ),missing transverse momentum, b-quark jets (b-jets) and multiple high-p
Tjets. Three event classes are distinguished depending on the number of jets identified as originating from b-quark decays; zero (b- jet veto) ,
≥1 or
≥3 b-jets. Background to these event classes arises from Standard Model processes with pairs of real isolated same-sign leptons, for instance from t¯ t
+W
/Zand from W
±W
±, WZ and ZZ processes (diboson). Other backgrounds (mainly from t¯ t ) consist of one real lepton and another fake lepton, which denotes hadrons mis-identified as leptons, leptons originating from heavy flavour decays, and electrons from photon conversions. A third class of background arises from a mis-measurement of the lepton charge, mainly from Z
/γ∗and t¯ t production processes.
The current analysis follows the method used for the earlier ATLAS publication made with 2.05 fb
−1at 7 TeV [17], and the one using 5.8 fb
−1at 8 TeV [18], but it has a substantially increased sensitivity since it uses the full 2012 data set of 20.7 fb
−1at 8 TeV. In addition, identification of the b-jets (b- tagging) is used, and more signal regions are introduced and optimized to consider a wider variety of signal models.
2 SUSY models
The results of the measurement are interpreted in model independent limits on the event yields from new
physics processes in the signal regions. Additionally, model dependent exclusion limits are provided in
the parameter space of several SUSY models.
b s
1
~ t ~ t g
1
~
b b ~
1 1
~
b
01
1 ~
~
,
m
m
0 1 (*)
1 ~
~
W1
~ b b ~ g
1
~ t
0 1
~ t
Gluino-stop ( ) on-shell
Gluino-stop ( ) degenerate ( )
Gluino-stop ( ) off-shell ( )
t ~
10m
g~ m
t~ m
tGluino-stop ( ) on-shell ( )
t ~
10m
g~ m
~t m
tGluino-stop (bs) RPV
q
q
g ~
~
1
' ~ q
0 2
~ q
0 1 (*)
~ W
, ~
~
~
~ ,
Gluino-squark (via W) Gluino-squark (via slepton)
1 1~ t ~ b
0 1 (*)
~ W
direct sbottom ( ) fixed
t ~
1 direct sbottom ( ) variedt ~
1 01
~
m
0 1
~
m
' ~
1~ q q
0 2
~
~ q q
, ~
~
~
~ ,
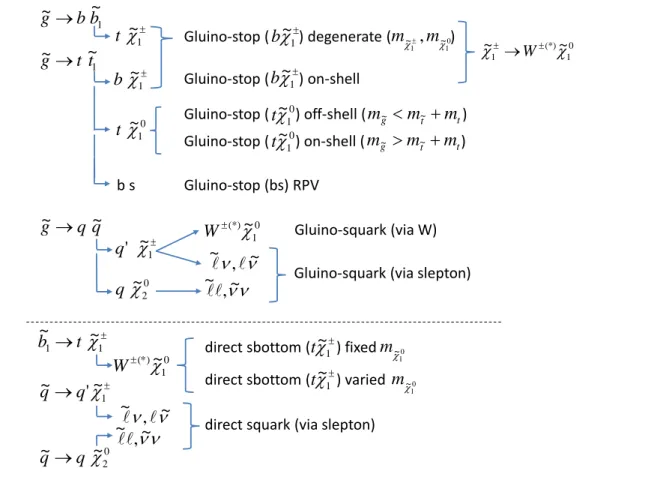
direct squark (via slepton)Figure 1: Overview of the simplified models considered in the analysis. The common feature is the strong pair production of supersymmetric particles, e.g. pp
→ g˜
g,˜ b ˜ b ¯˜ or ˜ q q. They di ¯˜
ffer in the decay sequences and mass assignments.
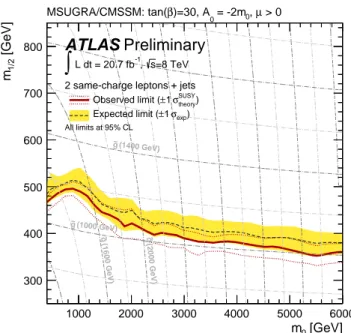
The first model considered is the mSUGRA
/CMSSM model [19–24] with the parameters tan(β)
=30, A
0 =−2 m
0and
µ >0, which can accommodate a lightest Higgs boson mass around 126 GeV. Only strong production and associated electroweak (gluino-gaugino, squark-gaugino) processes are included.
Results are expressed as a function of m
0and m
1/2.
Moreover, model dependent limits are derived in several simplified SUSY models. Figure 1 shows a summary of the models considered in this note. They are characterized by strong pair production of the supersymmetric partners of the gluon, b-quark and light quarks. The first class of simplified models are the gluino-stop models, where gluinos are produced in pairs and decay into a t˜ t
1pair (or a b b ˜
1pair, in one of the models considered) with a branching ratio of 100%. The models differ in the decay chain of the ˜ t
1and in the sparticle masses. Prompt leptons are produced in top quark decays. In the second class gluinos are also produced in pairs, but they decay into q q ˜ with leptons produced either via W bosons or sleptons. The third class considers direct production of bottom squark pairs, leading to prompt leptons from W bosons and top quarks. The fourth class describes the pair production of first or second generation squarks ( ˜ q) yielding prompt leptons from slepton decays.
The simplified models have the following detailed properties:
In the Gluino-stop (t
χ˜
01
) o
ff-shell (m
g˜ <m˜t+mt) model, gluinos are produced in pairs and assumed
to be lighter than all squark flavours. The top squark ˜ t
1is the lightest squark. Gluinos decay through
mediation of a virtual (off-shell) top squark to a pair of top quarks and the lightest neutralino (LSP),
g
˜
→t˜ t
∗ →t¯ t
χ˜
01. In the simulation the mass of the top squark is set to m
t˜1 =2.5 TeV and the masses of all other squarks are much higher (decoupled). The final state is therefore characterized by the presence of four top quarks and two LSPs. Same-sign leptons are expected to result from top quark decays. Results are interpreted in the parameter space of the gluino and LSP masses.
The Gluino-stop (
tχ˜
01
) on-shell (m
g˜ > m˜t +mt) model is similar to the previous one, but the top squark ˜ t
1is lighter than m
g˜−m
t. Thus the gluino decays into an on-shell ˜ t
1, which decays further into t
χ˜
01. The neutralino mass is set to 60 GeV. The final state contains four top quarks and two LSPs. Same-sign leptons are expected to result from top quark decays. Limits are expressed as a function of the gluino and ˜ t
1masses.
In the Gluino-stop (b
χ˜
±1
) on-shell model the ˜ t
1is the lightest squark, all other squarks are heavier than the gluino and m
g˜ >m
t˜1 +m
t, such that the decay ˜
g →t ˜
1t has a branching ratio of 100%. Top squarks are assumed to decay exclusively via ˜ t
1 →b
χ˜
±1. The chargino mass is set to 120 GeV and the neutralino mass to 60 GeV, hence the chargino ˜
χ±1decays through a virtual W boson ( ˜
χ±1 →W
∗±χ˜
01) into a three-body final state. Therefore the gluino decays via the sequence ˜
g→t˜ t
1→tb
χ˜
±1 →tbW
∗±χ˜
01, leading to final states with pairs of top and bottom quarks, LSPs and decay products of the virtual W bosons. Same-sign leptons are expected to result from top quark decays and the W bosons. Limits are expressed as a function of the gluino and ˜ t
1masses.
In the Gluino-stop (b
χ˜
±1
) degenerate (m
χ˜±,mχ˜0) model, gluinos are assumed to be lighter than all squarks and ˜ t
1and ˜ b
1are the lightest squarks. Pair production of gluinos is the only process taken into account, with gluinos decaying via virtual stops or sbottoms with a branching ratio of 100% assumed for
˜
t
∗1 →b
χ˜
±1and ˜ b
∗1 →t
χ˜
∓1, respectively. A small mass di
fference (
∆M
=2 GeV) is assumed between ˜
χ±1and ˜
χ01, such that ˜
χ±1decays into ˜
χ01plus very soft particles X. Therefore, both chains of gluino decays
g˜
→t˜ t
∗→tb
χ˜
±1 →tb
χ˜
01+X and ˜
g→b b ˜
∗→bt
χ˜
∓1 →bt
χ˜
01+X e
ffectively result into the same three-body final state (tb
χ˜
01) with similar kinematics. The final state is characterized by the presence of two top, two bottom quarks and two LSPs. Same-sign leptons can arise from the decays of the top quarks (which can be of the same charge). The results are interpreted as a function of the gluino and LSP masses.
The Gluino-stop (bs) RPV model [25] considers the production of gluino pairs with subsequent gluino decays to t˜ t. Top squarks are assumed to decay with an R-parity and baryon number violating
λ00323 =1 coupling as ˜ t
→sb. Other squarks are not considered in this simplified model. Gluino pair production dominates for all but very light top squarks, and the only decay mode is ˜
g→t˜ t
→tsb. The final state consists of two top quarks, two b-jets and two light quark jets and moderate missing transverse momentum. Same-sign lepton combinations can arise from top decays. Limits are expressed as function of the gluino and top squark masses.
The Gluino-squark (via W) model describes ˜
g˜gproduction with a subsquent gluino decay ˜
g→q q. ˜ The squark decays further into a quark and chargino, which in turn decays into a W boson and the LSP. The chargino mass is related to the LSP mass by m
χ˜± =2
·m
χ˜0. From the gluino decay chain
g˜
→q q ˜
→qqW
χ˜
01one expects final states with four light jets, two W bosons, two LSPs and no b-jets.
Prompt same-sign leptons in the event can arise from the decays of the W bosons. Limits are expressed as a function of the gluino and LSP masses.
The Gluino-squark (via sleptons) model again considers ˜
gg˜ production. The gluino decays with
equal probability as ˜
g→q q ˜
→˜
±1or ˜
g→q q ˜
→˜
02. Then the ˜
χ±1decays with equal probability
into a slepton and a neutrino or into a lepton and a sneutrino. The ˜
χ02decays with equal probability into
a slepton and a lepton or a neutrino and a sneutrino. Finally the slepton decays into a lepton and a ˜
χ01,
or the sneutrino decays into a neutrino and a ˜
χ01. The masses of the ˜
χ±1and ˜
χ02are assumed to be equal
to the average of the gluino and the LSP masses, and the slepton and sneutrino masses are assumed to be equal to the average of the ˜
χ±1/χ˜
02and the LSP masses. All three flavours of sleptons are considered and are degenerate in mass. Squark masses are assumed to be much larger than the gluino masses. The decay chains
g
˜
→˜
±1 →˜
→qq`ν
χ˜
01 g˜
→˜
±1 →qq`˜
ν→qq`ν
χ˜
01 g˜
→˜
02→qq`
`˜
→qq``
χ˜
01 g˜
→˜
02→qqν˜
ν→qqνν
χ˜
01can lead to events with up to two charged leptons in the final state. Thus final states can contain four light jets, up to four charged leptons and missing transverse energy. Prompt same-sign lepton pairs can appear via the slepton or gaugino decays. Limits are expressed in the parameter space of gluino and LSP masses.
The Direct sbottom (t
χ˜
±1
) model assumes that only direct pair production of bottom squarks is relevant and a bottom squark decays only via ˜ b
→t
+χ˜
∓1followed by the chargino decay ˜
χ∓1 →W
(∗)∓+χ˜
01. The fixed
mχ˜0model assumes m
χ˜0 =60 GeV and the varied
mχ˜0model m
χ˜0 =m
χ˜±/2. Final statesconsist of pairs of top quarks, W bosons (real or virtual) and missing transverse momentum. Same-sign dilepton combinations arise from the decays of the top quarks and the W bosons. Limits are expressed as a function of the ˜ b and ˜
χ±1masses.
Finally the Direct-squark (via sleptons) model is similar to the Gluino-squark (via slepton) model.
However, in this case the first step is the direct pair production of ˜ q ( first and second generation only) followed by the decays ˜ q
→q
χ˜
±1or ˜ q
→q
χ˜
02with equal probability. The same mass assignments for ˜
χ±1,
χ˜
02, sleptons and sneutrinos and the same decays for the ˜
χ±1and the ˜
χ02are used as in the Gluino-squark (via slepton) model.
The resulting decay chains are
˜
q
→q
χ˜
±1 →q
`ν˜
→q`ν
χ˜
01˜
q
→q
χ˜
±1 →q`˜
ν→q`ν
χ˜
01˜
q
→q
χ˜
02→q`
`˜
→q``
χ˜
01˜
q
→q
χ˜
02→qν˜
ν→qνν
χ˜
01.Final states contain two light jets, up to four charged leptons and missing transverse momentum. Prompt same-sign dilepton combinations can appear via the slepton or gaugino decays. Limits are expressed in the parameter space of the squark and LSP masses.
3 Signal and background simulation
Simulated Monte Carlo (MC) events are used to model the SUSY signal efficiency, to optimize the event
selection requirements and to aid in the description of the Standard Model backgrounds. Only back-
grounds which produce prompt same-sign leptons are estimated from MC simulation, i.e. t¯ t production
plus bosons (W/Z/H) and diboson production plus jets. Samples of t¯ tV
+jets,t¯ t
+WW and VVV
+jets(V
=W
,Z) are generated with M
adG
raph[26] interfaced to P
ythia[27]. P
ythia8 [28] is used to model
t¯ tH production. VV
+jets production is modeled with S
herpav1.4.1 [29] and contain matrix elements
for up to three final state partons. These samples use the default Sherpa parametrization for the renor-
malization and factorization scales and require a dilepton invariant mass m
`` >0.1 GeV. The theoretical
cross sections are normalized to NLO calculations and the uncertainties are estimated to be 30% for the t¯ tW and t¯ tZ (motivated by [30]), and 7% for diboson production (computed with MCFM [31] with scale, PDF and
αsuncertainties taken into account). Other sources of background such as t¯ t(+jets), W/Z
+jets,Wγ, t¯ tγ and single-top production are estimated with data-driven methods.
The SUSY signal samples were generated with the HERWIG
++[32] and M
adG
raphprograms using the PDF set CTEQ6L1 [33]. Signal cross sections are calculated to next-to-leading order in the strong coupling constant, adding the resummation of soft gluon emission at next-to-leading-logarithmic accu- racy (NLO
+NLL) [34–38]. The nominal cross section and the uncertainty are taken from an envelope of cross section predictions using different PDF sets and factorization and renormalization scales, as de- scribed in Ref. [39]. The theoretical uncertainties of SUSY signal processes depend on the parameter choices; they are typically around 25% for gluino pair production and 15% for squark pair production.
The simulation includes the effect of multiple pp interactions and is weighted to reproduce the ob- served distribution of the average number of collisions per bunch crossing. MC samples are processed through a detector simulation [40] based on Geant4 [41] or on a fast simulation using a parameterisation of the performance of the ATLAS electromagnetic and hadronic calorimeters [42]. Simulated events are reconstructed in the same manner as the data.
4 Event selection and reconstruction
The ATLAS detector [43] features tracking detectors surrounded by a 2 T superconducting solenoid, calorimeters, and a muon spectrometer in a toroidal magnetic field. The calorimeter system, with accep- tance covering the pseudorapidity
1range
|η|<4.9, consists of a high-granularity liquid-argon calorime- ters with lead, copper, or tungsten absorbers and an iron scintillator calorimeter. Events are selected by a three level trigger system.
4.1 Event selection
Two di
fferent trigger strategies are used to cover the full phase space for signal selection and control samples. For the signal regions with the E
missT >150 GeV requirement, the E
missT-only triggers are used, which reach close to 100% efficiency in this region of phase space. For low E
missTregions a single lepton trigger is used if the leading lepton has p
T>40 GeV (muons) or p
T >70 GeV (electrons) and a dilepton trigger is employed if the leading lepton p
Tis below those thresholds. These triggers are chosen to reach plateau efficiencies in the phase space of interest. The electron triggers reach constant efficiencies
>95%and muon triggers have constant e
fficiencies between 75% and 100%, depending on the pseudorapidity region.
Jets are reconstructed from three-dimensional calorimeter energy clusters by using the anti-k
talgo- rithm [44,45] with a radius parameter of 0.4. Jet energies are corrected [46] for detector inhomogeneities, the non-compensating nature of the calorimeter, and the impact of multiple overlapping pp interactions, using factors derived from test beam, cosmic ray, pp collision data and from the detailed Geant4 detector simulation. Jets are required to have p
T >40 GeV and
|η|<2.8. If b-tagging is required, the threshold is lowered to p
T >20 GeV and a neural network based b-tagging algorithm [47] with a 70% e
fficiency operating point is used to identify jets containing a b-hadron decay.
Electron candidates must satisfy the “tight
++” selection criteria described in Ref. [48] reoptimized for 2012 data and are required to fulfill p
T >20 GeV,
|η| <2.47 and to be isolated, i.e. the to- tal p
Tof additional charged particles or calorimeter energy inside a cone in the
η−φplane of radius
1The pseudorapidity is defined in terms of the polar angle θas η = −ln tan(θ/2) and the rapidity is defined asy = ln[(E+pz)/(E−pz)]/2. The separation between final state particles is defined as∆R=p
(∆y)2+(∆φ)2and is Lorentz invariant under boosts along thez-axis. The transverse momentum is denoted aspT.
∆
R
=0.3 around the electron must be smaller than 16% and 18%, respectively, of the electron p
T. The charged track assigned to the electron candidate must have a longitudinal impact parameter z
0satisfying
|z0
sin
θ|<0.4 mm and fulfill the requirement for the significance of the transverse impact parameter of d
0/σ(d0)
<3.
Muon candidates are identified by matching an extrapolated inner detector track and one or more track segments in the muon spectrometer [49, 50]. They are required to fulfill p
T >20 GeV,
|η|<2.4 and to be isolated, i.e. similar track and calorimeter isolation requirements are used as for electrons, but with isolation cuts of 12% of the muon momentum. The same impact parameter requirements as for electrons are applied.
To resolve overlaps between reconstructed jets and leptons, jets within a distance of
∆R
=0.2 of an electron candidate are rejected. Furthermore, any lepton candidate with a distance
∆R
<0.4 to the closest remaining jet is discarded.
The calculation of E
missT[51] is based on the vectorial sum of the p
Tof reconstructed objects (jets, leptons, photons) as well as calorimeter energy clusters (with
|η| <4.9) not belonging to reconstructed objects. A track-based method [52] is applied to suppress event pile-up (additional pp collisions su- perimposed on the hard physics process from multiple interactions) and to hence improve the E
missTresolution.
A primary vertex with a position consistent with the beam spot envelope and made of at least five tracks is required [53]. Events containing cosmic rays and detector noise are rejected using dedicated quality criteria [54]. Events of interest are selected if the two leading leptons passing the requirements described above have the same electric charge.
4.2 Signal region
The signal regions are optimised using the SUSY models listed in Section 2 and employing the following kinematic variables: effective mass, m
eff, defined as the scalar sum of the transverse momenta of the two leading leptons, the selected jets and E
missT; the transverse mass, computed from the leading lepton,
`, andthe missing transverse momentum as m
T = q2p
`TE
missT(1
−cos[∆
φ(`,E
missT)]). Slightly different cuts are applied for model independent limits (discovery case) and model dependent exclusion limits (exclusion case). To derive exclusion limits, the signal regions are made exclusive to each other and are statistically combined.
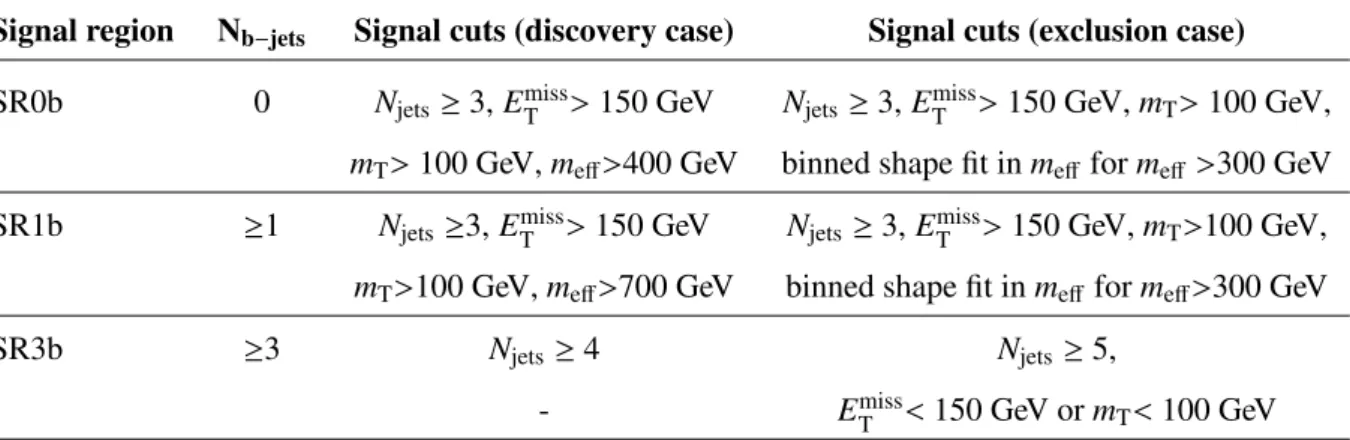
Three signal regions are defined (see also Table 1 for a detailed specification of the selection require- ments):
•
SR0b: A b-jet veto is applied. Events are required to have at least three jets, and large E
Tmissand transverse mass. Furthermore, a cut on m
effis applied only for the discovery case, whereas for exclusion limits this cut is omitted and a binned shape fit in the m
effdistribution is performed.
•
SR1b: Events are required to contain at least one b-jet and three other jets. The same cuts on E
missTand m
Tas for SR0b are applied, but m
effis required to be
>700 GeV.
•
SR3b: Events are required to contain at least three b-jets and at least four jets for the discovery case. For the exclusion case, at least 5 jets are required and the cuts on E
Tmissand m
Tof SR0b and SR1b are inverted, in order to make this signal region statistically independent from the other two.
The requirement on the number of jets and b-jets is independent throughout the analysis, i.e. a b-jet
may be counted as well in the jet category. SR1b is motivated by the majority of the signatures targeted
by this analysis, which correspond to final states with several b-jets. The signal region SR0b with a veto
on the presence of b-jets in the event is complementary to SR1b and is sensitive to the gluino-squark and
Signal region N
b−jetsSignal cuts (discovery case) Signal cuts (exclusion case) SR0b 0 N
jets≥3, E
missT >150 GeV N
jets≥3, E
Tmiss>150 GeV, m
T>100 GeV,
m
T>100 GeV, m
eff>400 GeVbinned shape fit in m
efffor m
eff>300 GeVSR1b
≥1N
jets≥3,E
missT >150 GeV N
jets≥3, E
Tmiss>150 GeV, m
T>100 GeV,m
T>100 GeV,m
eff>700 GeVbinned shape fit in m
efffor m
eff>300 GeVSR3b
≥3N
jets≥4 N
jets≥5,
- E
missT <150 GeV or m
T<100 GeV
Table 1: Definition of the signal regions. The cuts for the discovery and exclusion cases are shown separately. For all signal regions, two leading leptons with p
T >20 GeV and of the same electric charge are required. Jets are selected with p
T >40 GeV while b-jets are required to have p
T >20 GeV.
direct squark models, which do not result in enhanced production of b-quarks. The b-jet veto helps to suppress the t¯ t-like background, which otherwise dominates the event selection with several jets. The third signal region, SR3b, does not require large values of E
Tmiss, m
effor m
T. It is therefore targeted at compressed regions of the phase-space (i.e. small mass di
fferences) in models involving third generation squarks, which feature large b-jet multiplicities and small missing transverse momentum.
5 Backgrounds
5.1 Background estimation
Searches in events with two same-sign leptons are characterized by very low backgrounds. Three main classes of backgrounds can be distinguished: prompt same-sign lepton pairs, charge mis-measurement and fake leptons.
SM sources of events of prompt same-sign leptons with jets arise mainly from the production of a W or Z boson, decaying leptonically, in association with t¯ t, where at least one of the top quarks decays leptonically, and from diboson background (WZ, ZZ) in association with jets. These backgrounds are estimated from MC.
Background from charge mis-measurement consists of events with two opposite-sign leptons (OS) for which the charge of an electron is mis-identified. The dominant mechanism of charge mis-identification is due to the radiation of a hard photon bremsstrahlung followed by an asymmetric conversion for which the electron with the opposite charge dominates (e
± →e
±γ →e
±e
±e
∓). The probability of mis- identifying the charge of a muon is negligible. Previous studies [17, 18] show that the background from lepton charge mis-measurement is dominated by dilepton t¯ t events. It is estimated in this analysis using a fully data-driven technique to determine the charge flip probability as function of the electron p
Tand
ηfrom Drell-Yan events. The rate is measured using the ratio of SS to OS electron pairs with an invariant mass compatible with the Z boson within 15 GeV. The probability of electron charge mis-measurement is found to vary from approximately 10
−4to 0.02 in the range 0
≤ |η| ≤2.5 and 20
<p
T <200 GeV.
For the background estimation, this probability is then applied to data regions with the same kinematic requirements as the signal regions but with opposite-sign leptons.
Previous studies [18] show that the fake lepton background is dominated by t¯ t events where one
lepton comes from the decay of a b-hadron and the other from one of the W bosons. This background
is estimated from the data using a similar method as in Ref. [17] by loosening the lepton identification and isolation criteria, yielding classes of “tight” and “loose” leptons. The method counts the number of observed events containing loose-loose, loose-tight, tight-loose and tight-tight lepton pairs (pairs are ordered by p
T). Using four linear equations, the number of events in the signal region with combi- nations of fake and prompt lepton pairs can be determined. The parameters of the equations contain two types of probabilities for electrons and muons separately: the probability for a loose fake lepton and the probability for a loose prompt lepton to pass the tight selection criteria. These probabilities are measured as a function of the lepton p
Tand
ηfrom data. The prompt lepton probabilities are deter- mined from a data sample enriched with prompt leptons from Z
→ `+`−decays, obtained by requiring 80 GeV
<m
`` <100 GeV. The fake lepton probabilities are measured from a data set enriched with one prompt muon (by requiring p
T >40 GeV) and an additional fake lepton. The electron fake rate is determined from two samples of SS eµ events, one with a b-jet veto and another with at least one tagged b-jet. The muon must pass tight selection cuts, whereas the electron must have 20 GeV
<p
T <40 GeV.
The muon fake rate is determined from a sample of SS dimuon events with 20 GeV
<p
T <40 GeV, where at least one of the two muons is required to pass the tight selection criteria. The systematic uncer- tainty of the fake lepton background includes the extrapolation of the fake rate to higher lepton p
Tand the dependency of the fake rate on the event selection.
The signal region SR3b, which requires
≥3 b-jets and
≥4 jets, is dominated by events containing at least one mistagged b-jet. Studies of simulated t¯ t events indicate that the fake lepton rate increases with increasing b-tag multiplicity. Since there is not enough statistics in the data to measure the fake lepton rate in regions with
≥3 b-tags, the fake lepton rate, as obtained from events with at least one b-tag, is multiplied by a factor 1.5
+1.5−0.75and extrapolated to the signal region SR3b. This factor is determined from t¯ t Monte Carlo studies with MC@NLO [55] interfaced to HERWIG [56], using JIMMY [57] for the underlying event. The large systematic uncertainty is motivated by the uncertainty of Monte Carlo estimates for fake leptons and by the limited statistics.
Several systematic uncertainties on the background estimates have been evaluated. For the charge mis-measurement background, the main uncertainties come from the statistical uncertainty of the charge flip probability measurements and from a potential systematic bias of the data driven method which is estimated with Monte Carlo simulations. For fake leptons, the main uncertainties come from the sta- tistical uncertainty of the loose-to-tight probability measurements, the subtraction of background from charge mis-measurement and prompt leptons, and from a potential systematic bias estimated by vary- ing the event selection of the loose-to-tight measurements with Monte Carlo simulations. Finally, for prompt same-sign lepton pairs, the main uncertainties come from systematic variations of the jet energy scale, b-tagging efficiency, trigger efficiency, lepton identification efficiency and pile-up modelling in the Monte Carlo simulations. Additional uncertainties are assigned corresponding to different acceptance predictions from alternative generators. For t¯ t
+V production M
adG
raphis compared with A
lpgen. For diboson production Sherpa is compared with PowHeg. The process W
±W
±is not included in the PowHeg diboson simulation, but simulated separately with M
adG
raphinterfaced to P
ythia. For the 2012 data set the preliminary uncertainty of the integrated luminosity is
±3.6% based on the calibration proceduredescribed in Ref. [58].
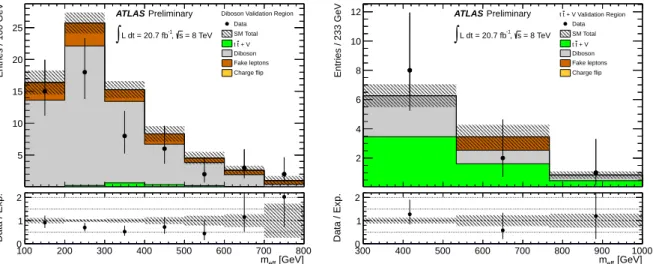
5.2 Validation of background estimates
The background estimates obtained from Monte Carlo simulations and data driven techniques are checked
in events with two same-sign leptons, where the leptons are selected as described in Section 4.1. Fig-
ure 2–4 show the control plots for the ee, eµ and
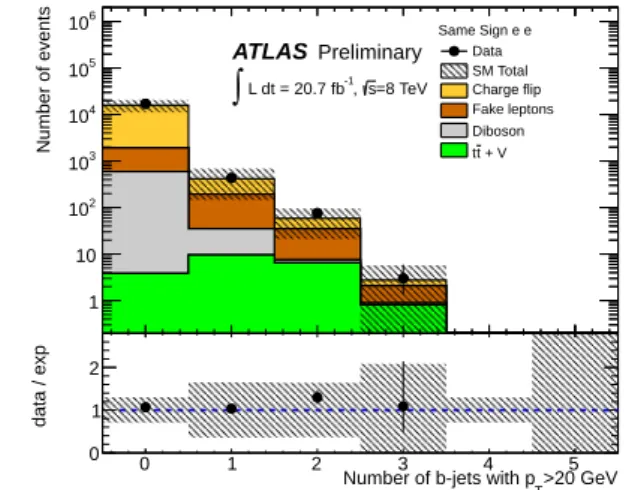
µµchannels respectively . Figure 2 shows the jet and
b-jet multiplicity distributions for the ee channel with individual contributions of the major background
classes. Good agreement is found between data and the SM expectation. The uncertainty bands include
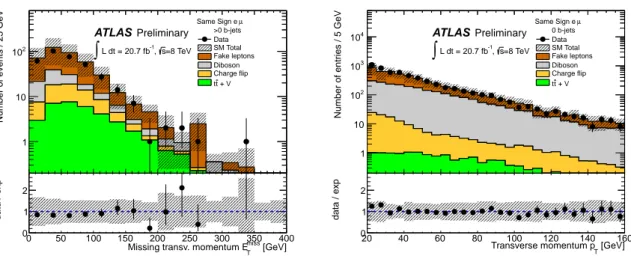
statistical and systematic uncertainties. Similarly, Figure 3 shows as validation plots for the eµ-channel
the missing transverse momentum distribution for events with at least one b-jet and the lepton p
Tdis- tribution for events with a b-jet veto. Finally, for the di-muon channel Figure 4 displays the e
ffective mass distribution with a veto on b-jets and the transverse mass distribution for events with at least one b-jet. For all channels good agreement between data and background prediction is obtained within the estimated systematic uncertainties. In addition, to validate the Monte Carlo description of events with high b-jet multiplicity containing both real and fake b-tags, a sample of events containing opposite-sign dilepton pairs and
≥3 b-jets has been studied. Distributions have been found to agree well, in particular the p
Tdistributions of the b-jets.
Three regions are devised to validate the dominant backgrounds of the prompt same-sign leptons, which are estimated by Monte Carlo simulation, i.e. t¯ tW , t¯ tZ and dibosons. These validation regions are not used to constrain these backgrounds in the fits to the signal regions but to verify the validity of the MC predictions.
The validation region for t¯ tW (VR-ttW) uses exactly two same-sign muons (no electrons) to reduce the background of fake leptons and charge mis-measurement. The event selection requires one or more jets with p
T >30 GeV, exactly two b-jets with p
T >20 GeV, 20
<E
Tmiss <120 GeV and a transverse mass m
T >80 GeV.
The validation region for t¯ tZ (VR-ttZ) requires three leptons (e or
µ), where the two leading leptonsmust have p
T>20 GeV and the third lepton p
T >10 GeV. A pair of opposite-sign, same-flavour leptons is required with the invariant mass of 83 GeV
<m
`+`− <96 GeV. In addition, the event selection requires two or more jets with p
T >40 GeV, one or two b-jets with p
T >20 GeV, 20
<E
missT <120 GeV and m
eff>300 GeV.
The dibosons validation region (VR-diboson) requires two same-sign muons to reduce the fake and charge mis-measurement backgrounds. In addition, the event selection requires two or more jets with p
T >20 GeV, no tagged b-jet with p
T >20 GeV, 20
<E
Tmiss<120 GeV and a transverse mass of m
T >100 GeV.
>40 GeV Number of jets with pT
0 1 2 3 4 5 6
Number of events
1 10 102
103
104
105
106 Same Sign e e
Data SM Total Charge flip Fake leptons Diboson
+ V t t
ATLASPreliminary
=8 TeV s
-1, L dt = 20.7 fb
∫
>40 GeV Number of jets with pT
0 1 2 3 4 5 6
data / exp
0 1
2 >20 GeV
Number of bjets with pT
0 1 2 3 4 5
Number of events
1 10 102
103
104
105
106 Same Sign e e
Data SM Total Charge flip Fake leptons Diboson
+ V t t
ATLASPreliminary
=8 TeV s
-1, L dt = 20.7 fb
∫
>20 GeV Number of b-jets with pT
0 1 2 3 4 5
data / exp
0 1 2
Figure 2: ee channel: Distributions of the jet multiplicity ( p
T>40 GeV) (left) and of the b-jet multiplicity ( p
T >20 GeV) (right).
The number of observed events and expected events from background sources are shown in Table 2
for each validation region. The uncertainties on the number of expected background events include
systematic uncertainties (cf. Section 5.1). Figure 5 shows the effective mass distributions in the diboson
and in the combined VR-ttW and VR-ttZ validation regions. The background checks in the validation
region provide confidence that the MC simulations predict the SM background rate of prompt like-sign
lepton pairs in events with multiple jets and b-jets within a factor of approximately 2, where the accuracy
[GeV]
miss
Missing transv. momentum ET
0 50 100 150 200 250 300 350 400
Number of events / 25 GeV
1 10 102
µ Same Sign e
>0 b-jets Data SM Total Fake leptons Diboson Charge flip
+ V t t
ATLASPreliminary
=8 TeV s
-1, L dt = 20.7 fb
∫
[GeV]
miss
Missing transv. momentum ET
0 50 100 150 200 250 300 350 400
data / exp
0 1
2 Transverse momentum (first 2 lead lept) [GeV]
20 40 60 80 100 120 140 160
Number of entries / 5 GeV
1 10 102
103
104
µ Same Sign e
0 b-jets Data SM Total Fake leptons Diboson Charge flip
+ V t t
ATLASPreliminary
=8 TeV s
-1, L dt = 20.7 fb
∫
[GeV]
Transverse momentum pT
20 40 60 80 100 120 140 160
data / exp
0 1 2
Figure 3: eµ channel: Missing transverse momentum distribution after lepton selection with at least one b-jet (left). Distributions of the p
Tof the selected leptons with a b-jet veto (right).
Effective mass (inclusive) [GeV]
0 100 200 300 400 500 600 700 800 900 1000
Number of events / 25 GeV
1 10 102
103
104
µ µ Same Sign
0 b-jets Data SM Total Diboson Fake leptons
+ V t t Charge flip
ATLASPreliminary
=8 TeV s
-1, L dt = 20.7 fb
∫
>40) [GeV]
Effective mass (jets pT
0 100 200 300 400 500 600 700 800 900 1000
data / exp
0 1
2 Transverse mass (lead lepton) [GeV]
0 50 100 150 200 250 300
Number of events / 20 GeV
1 10 102
µ µ Same Sign
>0 b-jets Data SM Total Fake leptons Diboson
+ V t t Charge flip
ATLASPreliminary
=8 TeV s
-1, L dt = 20.7 fb
∫
[GeV]
Transverse mass mT
0 50 100 150 200 250 300
data / exp
0 1 2
Figure 4:
µµchannel: Effective mass distribution after lepton selection with a veto on b-jets (left).
Transverse mass distribution after lepton selections with at least one b-jet (right).
is limited by the data statistics in the validation region. Monte Carlo simulations show that in general the expected contamination from SUSY signal processes in the validation regions is small, but for specific models like the Direct sbottom model it can be as large as
∼25% in the VR-ttW region.
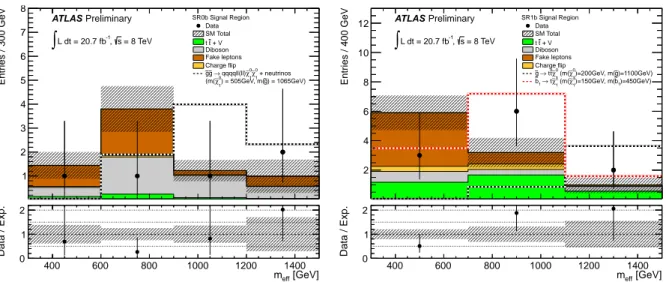
6 Results
Table 3 presents the number of observed events and expected background events in the three signal
regions for the discovery (upper table) and exclusion cases (lower table). The background for the SR0b
region is dominated by events containing fake leptons and dibosons (both with large uncertainties). In
signal regions SR1b and SR3b the largest background contribution and uncertainty is expected from t¯ t
+V
events. The p
0values indicate the p-value of the measurement for the background only hypothesis. Good
agreement is observed between the data and the SM expectation. A comparison of tables A and B shows,
that the event sample for the exclusion case has a larger background contribution from fake leptons in
SR1b. This is due to the relaxed m
effcut in the exclusion case sample. Figure 6 shows the effective mass
Event classes VR-diboson VR-ttW VR-ttZ
Observed events 54 9 4
Expected background events 74±13 4.2±1.9 8.0±2.0
Expectedtt¯+V events 1.6±0.8 2.7±1.5 3.2±1.1
Expected diboson events 60±7 0.4±0.1 3.9±1.3
Expected fake lepton events 12±11 1.1±1.1 0.9±0.5
Expected charge mis-meas. events 0 0 0
Table 2: Number of observed data events and expected events from background sources in the valida- tion regions (VR-diboson, VR-ttW and VR-ttZ). The quoted background errors include statistical and systematic uncertainties.
obs_x_VRVVmtup_meff
Entries / 100 GeV
5 10 15 20 25
ATLAS Preliminary = 8 TeV s -1, L dt = 20.7 fb
∫
Diboson Validation Region Data SM Total
+ V t t Diboson Fake leptons Charge flip
[GeV]
meff
100 200 300 400 500 600 700 800
Data / Exp.
0 1
2 obs_x_VRttV_meff
Entries / 233 GeV
2 4 6 8 10
12 ATLAS Preliminary
= 8 TeV s -1, L dt = 20.7 fb
∫
+ V Validation Region t
t Data SM Total
+ V t t Diboson Fake leptons Charge flip
[GeV]
meff
300 400 500 600 700 800 900 1000
Data / Exp.
0 1 2
Figure 5: Effective mass distributions in the VR-dibosons (left) and sum of VR-ttW and VR-ttZ (right).
distribution for SR0b and SR1b using the exclusion case cuts. The fake lepton background contributes mainly at low m
effin SR1b.
7 Interpretations
Since the observed number of events in the signal regions agrees with the SM expectation, the data are used to place model independent upper limits on the number of signal events and on the visible cross- section (σ), where denotes the product of acceptance and efficiency. In addition, model dependent exclusion limits are provided in a mSUGRA
/CMSSM model and in simplified models as described in Section 2. All limits are determined with a fit based on the profile likelihood method using asymptotic formulae [59] and correspond to 95% CL limits using the CL
s[60] calculation. For the model indepen- dent limits, the main results are calculated using pseudo-experiments and the asymptotic formulae are used for comparisons.
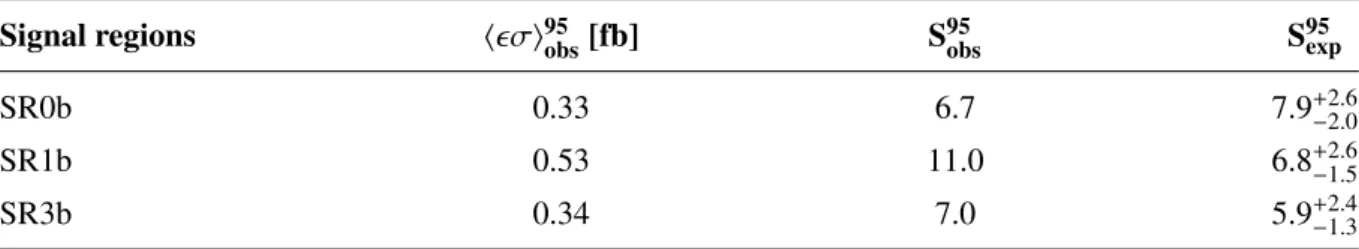
7.1 Model-independent limits
The model-independent upper limits based on the observed and expected number of events in the signal
regions for the discovery case, and calculated with pseudo-experiments, are shown in Table 4.
hσi95obsis
A) Discovery case SR0b SR1b SR3b
Observed events 5 8 4
Expected background events 7.5±3.3 3.7±1.6 3.1±1.6
Expectedt¯t+Vevents 0.5±0.4 2.2±1.0 1.7±0.8
Expected diboson events 3.4±1.0 0.7±0.4 0.1±0.1
Expected fake lepton events 3.4±3.1 0.3+−0.31.1 0.9+−0.91.4 Expected charge mis-measurement events 0.1±0.1 0.5±0.2 0.4±0.1
p0 0.50 0.11 0.36
B) Exclusion case SR0b SR1b SR3b
Observed events 5 11 1
Expected background events 7.5±3.2 10.1±3.9 1.8±1.3
Expectedt¯t+Vevents 0.5±0.4 3.4±1.5 0.6±0.4
Expected diboson events 3.4±1.1 1.4±0.7 <0.1
Expected fake lepton events 3.4±2.9 4.4±3.1 1.0±1.1
Expected charge mis-measurement events 0.2±0.1 0.8±0.3 0.1±0.1
p0 0.5 0.39 0.5
Table 3: Number of observed data events and expected backgrounds for the signal regions SR0b, SR1b and SR3b. The event counts correspond to the signal selection for the discovery limits (table A) and the exclusion limits (table B). p
0denotes the p-value of the observed events for the background only hypothesis. The quoted background errors include statistical and systematic uncertainties.
obs_x_SR0b_meff
Entries / 300 GeV
1 2 3 4 5 6 7 8
ATLAS Preliminary = 8 TeV s
-1, L dt = 20.7 fb
∫
SR0b Signal Region Data SM Total
+ V t t Diboson Fake leptons Charge flip
+ neutrinos 0 1 χ∼
0 1 χ∼
qqqqll(ll)
→
~g g~
) = 1065GeV) g~ ) = 505GeV, m(
0 χ∼1 (m(
[GeV]
meff
400 600 800 1000 1200 1400
Data / Exp. 0 1
2 obs_x_SR1b_meff
Entries / 400 GeV
2 4 6 8 10
12 ATLAS Preliminary = 8 TeV s
-1, L dt = 20.7 fb
∫
SR1b Signal Region Data SM Total
+ V t t Diboson Fake leptons Charge flip
)=1100GeV) g~ )=200GeV, m(
0 1 χ∼
0 (m(
1 χ∼
t
→ t g~
)=450GeV) b1 )=150GeV, m(~
± χ∼1
± (m(
χ∼1
→ t b1
~
[GeV]
meff
400 600 800 1000 1200 1400
Data / Exp. 0 1 2