ATLAS-CONF-2012-059 04June2012
ATLAS NOTE
ATLAS-CONF-2012-059
June 2, 2012
Search for light scalar top quark pair production in final states with two leptons with the ATLAS detector in √
s = 7 TeV proton–proton collisions
The ATLAS Collaboration
Abstract
A search is presented for the pair production of light scalar top quarks in
√s =
7 TeV proton–proton collisions with the ATLAS detector at the Large Hadron Collider. This anal- ysis uses the full data sample collected during 2011 running that corresponds to a total integrated luminosity of 4.7 fb
−1. Light scalar top quarks are searched for in events with two leptons (e,
µ), large missing transverse momentum and at least one jet in the final state. Noexcess over Standard Model expectations is found. By assuming that the light scalar top de- cays to a
bquark in addition to an (on-shell) chargino of mass 106 GeV whose decay occurs through a virtual
Wboson, light scalar top quark masses below 130 GeV are excluded for neutralino masses below 65 GeV. This extends the previous limit set by the CDF experiment in the same scenario, which assumes that the neutralino mass is heavier than 45 GeV.
c
Copyright 2012 CERN for the benefit of the ATLAS Collaboration.
Reproduction of this article or parts of it is allowed as specified in the CC-BY-3.0 license.
1 Introduction
Weak-scale supersymmetry (SUSY) [1–9] is an extension to the Standard Model (SM) that provides a solution to the instability of the scalar SM sector with respect to new high-scale physics. For each known boson or fermion, SUSY introduces a particle with identical quantum numbers except for a difference of half a unit of spin. In the framework of a generic R-parity conserving minimal supersymmetric extension of the SM (MSSM) [10–14], SUSY particles are produced in pairs and the lightest supersymmetric particle (LSP) is stable. In a large variety of models, the LSP is the lightest neutralino, ˜
χ01, which is only weakly interacting. The scalar partners of right-handed and left-handed quarks, ˜
qRand ˜
qL, mix to form two mass eigenstates, ˜
q1and ˜
q2, with ˜
q1being the lighter one. In the case of the supersymmetric partner of the top quark (˜
t, stop), large mixing effects can lead to one stop mass eigenstate, ˜t1, that is significantly lighter than the other squarks. Depending on the SUSY particle mass spectrum, their decay can result in final states topologically similar to
t¯tevents.
In this note, a search for direct stop pair production is presented, considering a SUSY particle mass hierarchy such that
m(t)>m(˜t1)
>(m( ˜
χ±1)
+mb) and the ˜
t1decays exclusively via
b+χ˜
±1. The mass of all other supersymmetric particles are set to be above 2 TeV, and large stop gauge mixing results in
m(˜t2)
m(˜t1) so that only ˜
t1pair production is considered. The chargino ( ˜
χ±1) mass is set to 106 GeV (above the present exclusion limits [15]) and it is assumed to decay through a virtual
Wboson ( ˜
χ±1 →W(∗)χ˜
01), with
mχ˜01 >
45 GeV. Stops within a mass range between 110 GeV and 160 GeV would be produced with relatively large cross sections – between 245 and 41 pb. In this search, di-lepton final states (l
=e, µ) areconsidered. Although these events could contribute to an anomaly in the measured
t¯tcross section, the relative contribution would be small due to the low transverse momenta of the visible decay products.
Events are required to contain at least one energetic jet, large missing transverse energy (E
missT) and low transverse momenta (p
T) leptons, to target the light stop final state.
Results of a search for direct stop production in the same scenario have been previously reported by the CDF [16] experiment.
2 The ATLAS detector
The ATLAS detector [17] is a multi-purpose particle physics apparatus with a forward-backward sym- metric cylindrical geometry and nearly 4π coverage in solid angle
1. It contains four superconducting magnet systems, which comprise a solenoid surrounding the inner tracking detector (ID), and the barrel and two end-cap toroids supporting a muon spectrometer. The ID consists of a silicon pixel detector, a silicon microstrip detector (SCT), and a transition radiation tracker (TRT). In the pseudorapidity region
|η|<
3.2, high-granularity liquid-argon (LAr) electromagnetic (EM) sampling calorimeters are used. An iron-scintillator tile calorimeter provides coverage for hadron detection over
|η| <1.7. The end-cap and forward regions, spanning 1.5
< |η| <4.9, are instrumented with LAr calorimetry for both EM and hadronic measurements. The muon spectrometer surrounds the calorimeters and consists of a system of precision tracking chambers (|η|
<2.7), and detectors for triggering (|η|
<2.4).
3 Simulated event samples
Monte Carlo (MC) simulated event samples are used to develop and validate the analysis procedure and to evaluate the SM backgrounds in the signal region. Production of top quark pairs is simulated with MC@NLO 4.01 [18], using a top quark mass of 172.5 GeV. Samples of
Wto
lνand Z/
γ∗to
ll, produced1ATLAS uses a right-handed coordinate system with its origin at the nominal interaction point in the centre of the detector and thez-axis along the beam pipe. Cylindrical coordinates (r, φ) are used in the transverse plane,φbeing the azimuthal angle around the beam pipe. The pseudorapidityηis defined in terms of the polar angleθbyη=−ln tan(θ/2).
with accompanying jets (of both light and heavy flavour), are obtained with ALPGEN 2.14 [19]. Dibo- son (WW,
WZ, ZZ) production is simulated with HERWIG 6.520 [20] and single top production withMC@NLO 4.01. Fragmentation and hadronisation for the ALPGEN 2.14 and MC@NLO 4.01 sam- ples are performed with HERWIG 6.520, using JIMMY 4.31 [21] for the underlying event. Expected diboson yields are normalised using NLO QCD predictions obtained with MCFM [22, 23]. The top- quark contribution is normalised to approximate next-to-next-to-leading order (NNLO) calculations [24].
The inclusive
Wand
Z/γ∗production cross sections are normalised to the next-to-next-to-leading order (NNLO) cross sections obtained using FEWZ [25]. ALPGEN 2.14 and PowHeg [26] samples are used to assess the systematic uncertainties associated with the choice of generator for
t¯tproduction, and Ac- erMC [27] samples are used to assess the uncertainties associated with initial and final state radiation (ISR
/FSR) [28]. The choice of the PDFs depends on the generator. CT10 [29] sets are used for all MC@NLO samples. MRST LO** [30] sets are used with HERWIG and PYTHIA, and CTEQ6L1 [31]
with ALPGEN 2.14. The stop production models are simulated using PYTHIA 6.425 [32]. Signal cross sections are calculated to next-to-leading order in the strong coupling constant, including the resumma- tion of soft gluon emission at next-to-leading-logarithmic accuracy (NLO
+NLL) [33–35]. An envelope of cross section predictions is defined using the 68% C.L. ranges of the CTEQ6.6 (including the
αSun- certainty) and MSTW 2008 NLO [36] PDF sets, together with independent variations of the factorisation and renormalisation scales by factors of two or one half. The nominal cross section value is taken to be the midpoint of the envelope and the uncertainty assigned is half the full width of the envelope, closely following the PDF4LHC recommendations [37]. All MC samples are produced using a GEANT4 [38]
based detector simulation [39]. The e
ffect of multiple proton-proton collisions from the same or di
fferent bunch crossings is incorporated into the simulation by overlaying additional PYTHIA minimum bias events onto hard-scattering events. Simulated events are weighted to match the distribution of the mean number of interactions per bunch crossing observed in data.
4 Data and event selection
The analysed 7 TeV proton-proton collision data were recorded between March and October 2011. Af- ter applying the beam, detector and data-quality requirements, the data sample corresponds to a total integrated luminosity of 4.7 fb
−1. Events are triggered using a combination of single and double lep- ton triggers. The single electron triggers vary with the data-taking period, and the tightest of these has an efficiency (all efficiencies are quoted with respect to reconstructed leptons, passing the baseline lepton definitions) of
∼97% for electrons with pT >25 GeV. The single muon trigger used for all data- taking periods reaches an e
fficiency plateau of
∼75% (∼90%) in the barrel (end-caps) for muons with pT >20 GeV. The double lepton triggers reach similar plateau efficiencies, but at lower
pTthresholds (greater than 17 GeV for electrons passing the dielectron trigger, and greater than 12 GeV for muons passing the dimuon trigger; for the electron-muon trigger the thresholds are 15 and 10 GeV for electrons and muons respectively). If a lepton has an offline
pTabove the single lepton trigger plateau threshold in a given event, the relevant single lepton trigger is used. Double lepton triggers are used for events with no such lepton. An exception to this rule is applied in the
µµchannel. In this case when one lepton has
pT>
20 GeV and the second
pT >12 GeV, a logical OR of both triggers is used to recover efficiency.
Jet candidates are reconstructed using the anti-k
tjet clustering algorithm [40] with a distance param- eter of 0.4. The inputs to this algorithm are three-dimensional calorimeter clusters seeded by cells with energy significantly above the expected electronic and pileup noise. Jet momenta are constructed by per- forming a four-vector sum over these cell clusters, treating each as an (E, ~
p) four-vector with zero mass.The jet candidates are corrected for the e
ffects of calorimeter non-compensation, inhomogeneities and
energy loss in material in front of the calorimeter, by using
pTand
η-dependent calibration factors basedon MC simulations and validated with extensive test-beam and collision-data studies [41]. Furthermore,
the reconstructed jet is modified such that the jet direction points to the primary vertex, defined as the vertex with the highest summed track
p2T, instead of the geometrical centre of the ATLAS detector. Only jet candidates with corrected transverse momenta
pT >20 GeV and
|η|<4.5 are subsequently retained.
Jets likely to have arisen from detector noise or cosmic rays are rejected [41]. Electron candidates are required to have
pT >10 GeV,
|η| <2.47, and pass the “medium” shower shape and track selection criteria of Ref. [42]. Muon candidates are reconstructed using either a full muon spectrometer track matched to an ID track, or a muon spectrometer segment matched to an extrapolated ID track [43]. They must be reconstructed with su
fficient hits in the pixel, SCT and TRT detectors. They are required to have
pT>
10 GeV and
|η|<2.4.
Following object reconstruction, overlaps between candidate jets and leptons are resolved. Any jet candidate lying within a distance
∆R= p(
∆η)2+(
∆φ)2of 0.2 of an electron is discarded. Subsequently, any electron or muon candidate remaining within a distance
∆R =0.4 of any surviving jet candidate is discarded.
The measurement of the missing transverse momentum two-vector
pmissT, and its magnitude
ETmiss, is based on the transverse momenta of all electrons, muons and jets as described above, and of all calorime- ter clusters with
|η|<4.5 not associated to such objects.
Following overlap removal, electrons are further required to have
pT >17 GeV and to pass the
“tight” [42] quality criteria, which places additional requirements on the ratio of calorimetric energy to track momentum, and the fraction of high-threshold hits in the TRT. Electrons are also required to be isolated: the
pTsum of tracks above 1 GeV within a cone of size
∆R <0.2 around each electron candidate (excluding the electron candidates themselves) is required to be less than 10% of the electron
pT. Muons must have
pT >12 GeV and must be isolated: the
pTsum of tracks within a cone of size
∆R<
0.2 around the muon candidate is required to be less than 1.8 GeV. Jets are subject to the further requirements
pT >25 GeV,
|η|<2.5 and the “jet vertex fraction”
2is reasonably high (> 0.75).
A
b-tagging algorithm [44] (JetFitter-CombNN), which exploits the topological structure of weak b- andc-hadron decays inside a candidate jet, is used to identify jets containing ab-hadron decay. Thenominal
b-tagging efficiency, computed from
t¯tMC events, is on average 60%, with a misidentification (mis-tag) rate for light-quark/gluon jets of less than 1%. Factors are applied to all MC samples to correct for small discrepancies in the
b-tagging performance observed in data with respect to simulation.During part of the data-taking period, a localised electronics failure in the electromagnetic calorime- ter created a dead region (∆
η×∆φ≈1.4
×0.2). For jets in this region, a correction to their energy is made using the energy depositions in the neighbouring cells, and is propagated to
EmissT. If the energy correc- tion exceeds 10 GeV or 10% of the
ETmiss, the event is discarded. Events with reconstructed electrons in the calorimeter dead region are also rejected.
Events in the signal and control regions are subject to the following requirements. The primary vertex in the event must have at least five associated tracks and each event must contain exactly two selected leptons (electrons or muons) of opposite sign. Both of these leptons must additionally satisfy the full list of signal lepton requirements, and the dilepton invariant mass,
mll, must be greater than 20 GeV across all flavour combinations. In addition, events in the signal region must have at least one jet with
pT >25 GeV,
ETmiss >20 GeV, missing transverse energy significance
3 Emiss,sig.T >7.5 GeV
1/2to reject multijet events, and highest lepton
pT <30 GeV (to provide further rejection of the dominant dileptonic
t¯tbackground). Events in the
eeand
µµchannels are subject to a further requirement on the dilepton invariant mass to reject events arising from
Zproduction and decay. This selection, summarised in Table 1, has a low signal efficiency, but strong background rejection. The main factor in the efficiency loss is the lowest lepton
pTrequirements needed to reach the e
fficiency plateau of the dilepton triggers.
2The jet vertex fraction quantifies the fraction of track transverse momentum associated to a jet which comes from the primary vertex. It removes jets within the tracker acceptance which originated from uncorrelated soft collisions.
3In this paper,Emiss,sig.T =ETmiss/√
HT, whereHTis the scalar sum of the jet and lepton transverse momenta in each event.
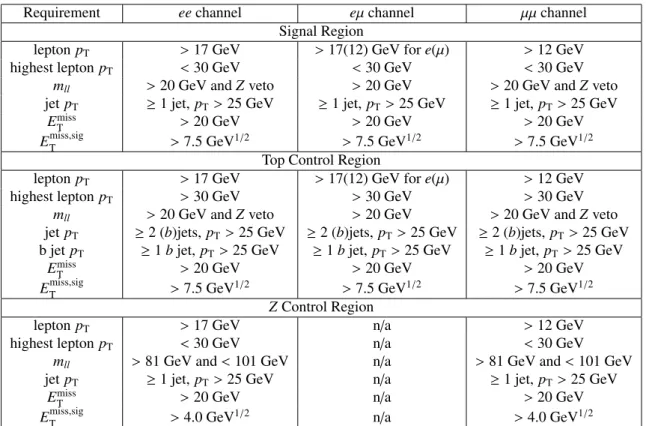
Requirement eechannel eµchannel µµchannel Signal Region
leptonpT >17 GeV >17(12) GeV fore(µ) >12 GeV highest leptonpT <30 GeV <30 GeV <30 GeV
mll >20 GeV andZveto >20 GeV >20 GeV andZveto jetpT ≥1 jet,pT>25 GeV ≥1 jet,pT >25 GeV ≥1 jet,pT>25 GeV
ETmiss >20 GeV >20 GeV >20 GeV
Emiss,sigT >7.5 GeV1/2 >7.5 GeV1/2 >7.5 GeV1/2
Top Control Region
leptonpT >17 GeV >17(12) GeV fore(µ) >12 GeV highest leptonpT >30 GeV >30 GeV >30 GeV
mll >20 GeV andZveto >20 GeV >20 GeV andZveto jetpT ≥2 (b)jets,pT>25 GeV ≥2 (b)jets,pT>25 GeV ≥2 (b)jets, pT>25 GeV b jetpT ≥1bjet,pT>25 GeV ≥1bjet,pT>25 GeV ≥1bjet,pT>25 GeV
ETmiss >20 GeV >20 GeV >20 GeV
Emiss,sigT >7.5 GeV1/2 >7.5 GeV1/2 >7.5 GeV1/2
ZControl Region
leptonpT >17 GeV n/a >12 GeV
highest leptonpT <30 GeV n/a <30 GeV
mll >81 GeV and<101 GeV n/a >81 GeV and<101 GeV jetpT ≥1 jet,pT>25 GeV n/a ≥1 jet,pT>25 GeV
ETmiss >20 GeV n/a >20 GeV
Emiss,sigT >4.0 GeV1/2 n/a >4.0 GeV1/2
Table 1: Signal region, top control region and Z control region requirements in each flavour channel. The
Zveto rejects events with
mll>81 GeV and
mll<101 GeV.
The kinematic acceptance varies between 0.07% and 0.004% for a neutralino mass of 55 GeV as the stop mass varies between 112 GeV and 160 GeV, and between 0.08% and 0.003% for a stop mass of 140 GeV as the neutralino mass varies between 45 GeV and 95 GeV (the detector efficiency for these points is
∼40%).
5 Background estimation
The dominant SM background after signal selection requirements arises from fully leptonic
t¯tevents, with the next most significant background being
Z/γ∗+jets. Single top,
W+jets, diboson and multijet events give much smaller expected contributions.
The fully leptonic
t¯tbackground in the signal region is obtained by extrapolating the number of
t¯tevents measured in a suitable control region (CR), after correcting for contamination from non-t¯
tevents, into the signal region (SR). This extrapolation, detailed in Eq. 1, uses the ratio from MC of the number of
t¯tevents in the signal region to those in the control region.
(Nt¯t)SR=((Ndata)CR−(Nnon-t¯t,MC)CR)(Nt¯t,MC)SR
(Ntt,¯MC)CR (1)
The CR is designed to give a reasonable top yield, whilst minimising signal contamination. CR
are chosen to be kinematically similar to the signal region to minimise systematic uncertainties due to
extrapolation. Selection requirements for the top control region are summarised in Table 1. In this
analysis, models with small stop-chargino mass difference are considered, and hence soft
b-jets areexpected in the signal events which are not efficiently tagged. By requiring a
b-jet in the top controlregion a high-purity sample of top events is obtained, with a maximum signal contamination in the considered signal models of
∼7% (for low
mχ˜01
, high
mt˜). The percentage of SM, non-t¯
tevents in the CR is
<5% across all channels. The resulting evaluated
t¯tbackground contributions are consistent with the expected MC yields in all channels within the uncertainties. Signal contamination is taken into account when setting the exclusion limit in the next section by including, for each signal model, the expected signal yield in the top control region in the term (N
non-t¯t,MC)
CRin equation 1.
The contribution from
Z/γ∗+jets events to the signal region (fromeeand
µµevents) is evaluated in a similar way. Data is used to obtain the normalisation of the
Z/γ∗background in a suitable CR and MC is once more used to extrapolate from CR to SR using an analogous equation to Eq 1. This method is used separately for each of the
eeand
µµchannels (with selection requirements for the
ZCR as summarised in Table 1), whereas the contribution to
eµ(including those from
Z/γ∗→ττ) is taken directly from MC. Thecontamination from non-Z/γ
∗+jets SM events in the CR is less than 5%, and the signal contamination less than 4%. The resulting evaluated
Zbackground contributions are consistent with the expected MC yields in the
eeand
µµchannels within the uncertainties. The effect of signal contamination of the
Zcontrol region on the final exlcusion limit can be neglected to a very good approximation.
Single top,
W+jets (including heavy-flavour contributions) and diboson backgrounds are evaluated in the signal region directly from MC.
The tight requirement on
Emiss,sig.Theavily suppresses the multijet background. A semi data-driven technique, called a “template fit”, is used to verify that this background is small, and to assign an un- certainty on the yield in the signal region. The isolation requirements on the electrons and muons are reversed to enhance the multijet content of selected events. The requirements are inverted in the signal region, prior to application of the
ETmiss,sig.requirement. The shape of the
Emiss,sig.Tdistribution in data for this inverted selection (after subtracting the dominantly electroweak background using MC) is then compared to the equivalent distribution in data for the “normal” isolation requirements in order to vali- date that inverting the lepton isolation does not distort the shape of the distribution. The “normal” and
“inverted” shapes were found to agree very closely for the full range of distributions considered in the analysis. The inverted
Emiss,sig.Tdistribution is then re-normalised to match the distribution after nominal isolation requirements. Passing this correctly normalised template through the remaining requirements gives the multijet yield in the signal region. It is found to be small in all channels, making up less than 2% of the total background.
6 Systematic uncertainties
The total systematic uncertainty on the expected background in the combined flavour channel (the sum
of
ee,eµand
µµevents) is 9.8%, and is dominated by the uncertainties on the two largest backgrounds
(dileptonic
t¯tand
Z+jet events). The largest source of systematic uncertainty on thet¯tbackground eval-
uation is the uncertainty on the jet energy scale (JES), with smaller contributions coming from the jet
energy resolution (JER) uncertainty [41], the theory and MC modelling uncertainties (using the prescrip-
tions described in Ref. [45]), the systematic uncertainties in
b-tagging efficiency [44], and the uncertaintyarising from limited MC and data statistics. Uncertainties [42, 46, 47] in lepton reconstruction and iden-
tification (momentum and energy scales, resolutions and e
fficiencies) give smaller contributions. The
primary source of uncertainty on the
Z/γ∗+jets background estimate in the combined flavour channel isthe jet energy resolution uncertainty, with smaller contributions coming from the statistical and jet energy
scale uncertainties. Theoretical uncertainties on the
Z/γ∗+jets background are investigated by varying
the PDF and renormalisation scales. An uncertainty on the luminosity of 3.9% [48, 49] is included in the
systematic uncertainty calculation for backgrounds taken directly from MC simulation. The dominant
uncertainties on these backgrounds are the jet energy scale and statistical uncertainties. The systematic
uncertainty on the multijet yield is obtained by varying the range in which the template fit is performed,
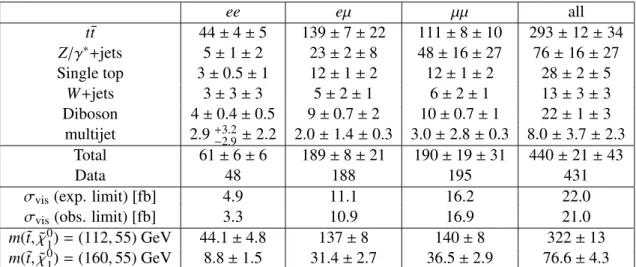
ee eµ µµ
all
t¯t44
±4
±5 139
±7
±22 111
±8
±10 293
±12
±34
Z/γ∗+jets5
±1
±2 23
±2
±8 48
±16
±27 76
±16
±27 Single top 3
±0.5
±1 12
±1
±2 12
±1
±2 28
±2
±5
W+
jets 3
±3
±3 5
±2
±1 6
±2
±1 13
±3
±3 Diboson 4
±0.4
±0.5 9
±0.7
±2 10
±0.7
±1 22
±1
±3
multijet 2.9
+−2.93.2±2.2 2.0
±1.4
±0.3 3.0
±2.8
±0.3 8.0
±3.7
±2.3 Total 61
±6
±6 189
±8
±21 190
±19
±31 440
±21
±43
Data 48 188 195 431
σvis
(exp. limit) [fb] 4.9 11.1 16.2 22.0
σvis
(obs. limit) [fb] 3.3 10.9 16.9 21.0
m(˜t,χ
˜
01)
=(112, 55) GeV 44.1
±4.8 137
±8 140
±8 322
±13
m(˜t,χ˜
01)
=(160, 55) GeV 8.8
±1.5 31.4
±2.7 36.5
±2.9 76.6
±4.3 Table 2: The expected and observed numbers of events in the signal region for each flavour channel.
In the combined flavour column (“all”), the statistical uncertainty (first uncertainty quoted, includes limited MC statistics, and limited data statistics in the CR where appropriate) on the various background estimates have each been added in quadrature whilst the systematic uncertainties (second uncertainty quoted) have been combined taking into account the correlations between background sources. Observed and expected upper limits at 95% confidence level on the visible cross section
σvis =σ×A×are also shown. The expected signal yields and statistical uncertainties on the yields are quoted for the two mass points illustrated in the figures.
and using the maximum deviation of the final yield to assign the uncertainty.
In the considered
m( ˜χ01)
−m(˜t) mass plane the theoretical uncertainty on each of the signal crosssections is 16%. These arise from considering the cross section envelope defined using the 68% C.L.
ranges of the CTEQ6.6 and MSTW 2008 NLO PDF sets, and independent variations of the factorisation and renormalisation scales (see Section 3). Further uncertainties on the numbers of predicted signal events arise from the JES uncertainty (7-15%), the JER uncertainty (1-7%), the luminosity uncertainty (3.9%), the uncertainties on calorimeter clusters used to calculate
ETmiss(2-6%), the statistical uncertainty from finite MC statistics (4-20%) and smaller contributions from uncertainties on lepton reconstruction and identification, where the quoted ranges display the maximum variation observed using all signal models considered in this analysis.
7 Results and interpretation
Table 2 compares the observations in data in each flavour channel and the combined flavour channel in the signal region with the evaluated background contributions. Good agreement is observed across all channels, and the absence of evidence for light scalar top production allows a limit to be set on the cross-section for non-SM physics,
σvis = σ× ×A, for which this analysis has an acceptance Aand e
fficiency . The limits are calculated using the modified frequentist CL
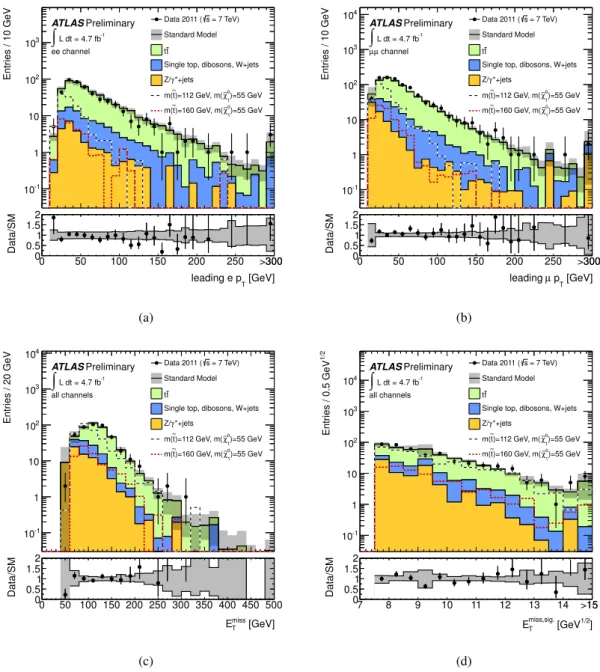
sprescription [50] by comparing the number of observed events in data with the SM expectation. All systematic uncertainties and their correlations are taken into account via nuisance parameters using a profile likelihood technique [51]. In Fig. 1, the highest lepton
pTdistributions in the
eeand
µµchannels are illustrated along with the
EmissTand
Emiss,sig.Tdistributions of data and simulated events in the signal region. The observed data yield is in good agreement with the SM prediction in the combined flavour channel given in Table 2.
The results in the combined channel are used to place exclusions at 95% confidence level in the
m(˜t)-0 50 100 150 200 250 300
Entries / 10 GeV
10-1
1 10 102
103
= 7 TeV) s Data 2011 ( Standard Model
t t
Single top, dibosons, W+jets
*+jets γ Z/
)=55 GeV
1
χ∼0
)=112 GeV, m(
~t m(
)=55 GeV
1
χ∼0
)=160 GeV, m(
~t m(
ATLASPreliminary L dt = 4.7 fb-1
∫
ee channel[GeV]
leading e pT
0 50 100 150 200 250 300
Data/SM 00.511.5
2
>300
(a)
0 50 100 150 200 250 300
Entries / 10 GeV
10-1
1 10 102
103
104 Data 2011 (s = 7 TeV)
Standard Model t t
Single top, dibosons, W+jets
*+jets γ Z/
)=55 GeV
1
χ∼0
)=112 GeV, m(
~t m(
)=55 GeV
1
χ∼0
)=160 GeV, m(
~t m(
ATLASPreliminary L dt = 4.7 fb-1
∫
µ channel µ[GeV]
pT
µ leading
0 50 100 150 200 250 300
Data/SM 00.511.5
2
>300
(b)
0 50 100 150 200 250 300 350 400 450 500
Entries / 20 GeV
10-1
1 10 102
103
104
= 7 TeV) s Data 2011 ( Standard Model
t t
Single top, dibosons, W+jets
*+jets γ Z/
)=55 GeV
1
χ∼0
)=112 GeV, m(
~t m(
)=55 GeV
1
χ∼0
)=160 GeV, m(
~t m(
ATLASPreliminary L dt = 4.7 fb-1
∫
all channels[GeV]
T
Emiss
0 50 100 150 200 250 300 350 400 450 500
Data/SM
0 0.5 1 1.5 2
(c)
7 8 9 10 11 12 13 14 15
1/2Entries / 0.5 GeV
10-1
1 10 102
103
104
= 7 TeV) s Data 2011 ( Standard Model
t t
Single top, dibosons, W+jets
*+jets γ Z/
)=55 GeV
1
χ∼0
)=112 GeV, m(
~t m(
)=55 GeV
1
χ∼0
)=160 GeV, m(
~t m(
ATLASPreliminary L dt = 4.7 fb-1
∫
all channels1/2] [GeV
T miss,sig.
E
7 8 9 10 11 12 13 14 15
Data/SM
0 0.5 1 1.5 2
>15
(d)
Figure 1: The highest electron and muon
pTdistributions in the same flavour
ee(a) and
µµ(b) channels,
before the requirement on the highest lepton
pT, and the
EmissTdistribution (c) and
Emiss,sig.Tdistribu-
tion (d) after all other signal region requirements. The data and evaluated background components are
reported. The hashed band indicates the total experimental uncertainty on the expectation. The dashed
lines give the expectations for signal models with stop masses of 112 GeV and 160 GeV, respectively,
and a neutralino mass of 55 GeV. The final histogram bins in (a) and (b) include the integrals of all events
with
pT >300 GeV. The final bin in (d) includes all events with an
ETmiss,sig.of at least 15. The bottom
panels show the ratio of the data to the expected background (points) and the systematic uncertainty on
the background (hashed area).
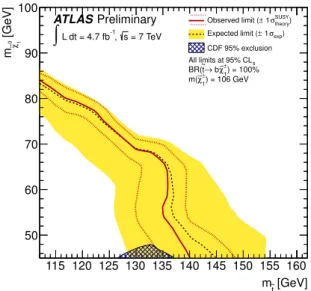
[GeV]
~t
m 115 120 125 130 135 140 145 150 155 160 [GeV] 10χ∼m
50 60 70 80 90 100
ATLASPreliminary = 7 TeV s
-1, L dt = 4.7 fb
∫
) = 100%
1 χ∼±
→ b
~t BR(
) = 106 GeV 1 χ∼± m(
theory) σSUSY
± 1 Observed limit (
exp) σ
± 1 Expected limit ( CDF 95% exclusion All limits at 95% CLs
Figure 2: 95% exclusion limit in the
m˜t-m
χ˜01
mass plane, with
mχ˜±1=
106 GeV. The dashed black and solid red lines show the 95% CL
sexpected and observed limits, respectively, including all uncertainties except for the theoretical signal cross section uncertainty (PDF and scale). The yellow band around the expected limit shows the
±1σresult. The
±1σlines around the observed limit represent the results obtained when moving the nominal signal cross section up or down by the theoretical uncertainty. Illustrated also is the 95% CDF exclusion quoted in Ref. [16].
m( ˜χ01
) mass plane, using the CL
sprescription. The resulting limits are shown in Figure 2. Illustrated are the 95% CL
sexpected (dashed black) and observed limits (solid red), respectively, obtained by including all uncertainties except the theoretical signal cross section uncertainty. The yellow band indicates the impact of the experimental uncertainties on the expected limit whilst the dashed red lines around the observed limit illustrate the change in the observed limit as the nominal signal cross section is scaled up and down by the 1σ theoretical uncertainty. The observed limit represents a significant extension of the CDF limit [16] for chargino mass of 106 GeV to smaller neutralino and chargino mass differences (the limit extends up to neutralino mass of 82 GeV for a stop mass of 112 GeV). The limit on the stop mass for neutralino masses of 45 GeV (135 GeV) is comparable to the equivalent CDF limit. Increasing the chargino mass by 15 GeV leads to a modest shift of the exclusion limit to higher values of the neutralino mass, with the reach in stop mass being enhanced to a lesser degree due to the falling stop production cross section. For example, for a model with
mt˜ =130 GeV,
mχ˜±1 =
120 GeV and
mχ˜01 =
60 GeV, the value of
A×(0.032%) is slightly higher than for the equivalent model with
mχ˜±1 =