ATLAS-CONF-2012-089 07July2012
ATLAS NOTE
ATLAS-CONF-2012-089
July 7, 2012
Search for Displaced Muon Jets from light Higgs boson decay in proton-proton collisions at √
s = 7 TeV with the ATLAS detector
The ATLAS Collaboration
Abstract
A search is presented for collimated muon pairs produced in the decay of long-lived neutral particles in proton-proton collisions at
√s=
7 TeV center of mass energy, with the ATLAS detector at the LHC. In a sample of 1.94 fb
−1of collision events collected during 2011, the observed data are consistent with the Standard Model background expectations.
Limits on the product of the production cross section and the branching fraction of a Higgs boson decaying to Hidden Valley neutral long-lived particles are derived as a function of the particles’ mean cτ.
c
Copyright 2012 CERN for the benefit of the ATLAS Collaboration.
Reproduction of this article or parts of it is allowed as specified in the CC-BY-3.0 license.
1 Introduction
A search is presented for collimated muon pairs produced in the decay of long-lived neutral particles in proton-proton collisions at
√s
=7 TeV center of mass energy with the ATLAS detector at the LHC.
The benchmark model considered in this analysis consists of a Higgs boson decaying to a new hidden sector of particles which finally produces two sets of collimated muon pairs, but the search described is equally valid for other, distinct models such as heavier Higgs boson doublets, singlet scalars or a Z
0, that predominantly decay to a hidden sector and eventually produce collimated muon pairs.
The Higgs boson [1–3] may have branching fractions that di
ffer from the predictions of the Standard Model (SM). A particularly interesting possibility is that the Higgs boson, with a mass m
Hin the range 100 -140 GeV, decays into states residing in a new light hidden sector of particles. The phenomenology of light hidden sectors has been studied extensively over the past few years [4–8]. Possible characteristic topological signatures of such extensions of the SM are the “Lepton Jets” (LJs). A LJ is a cluster of highly collimated particles: electrons, muons and possibly pions [5, 9–11]. These arise if light unstable particles with masses in the MeV to GeV range (for example dark photons,
γd) reside in the hidden sector and decay predominantly to SM particles. At the LHC, hidden sector particles may be produced with large boosts, causing the visible decay products to form jet-like structures. Hidden sector particles such as
γdmay be long-lived, resulting in decay lengths comparable to, or larger than, the detector dimensions.
The production of LJs can occur through various channels. For instance, in supersymmetric models, the lightest visible superpartner may decay into the hidden sector. Alternatively, a scalar particle that couples to the visible sector may also couple to the hidden sector through Yukawa couplings or the scalar potential. This analysis is focused on the case where the Higgs boson decays, possibly through couplings to supersymmetric particles, to the hidden sector [12, 13]. The SM Higgs boson has a narrow width into SM final states when m
H <2m
W. Consequently, any new (non-SM) couplings to additional states, which reside in a hidden sector, may easily dominate the Higgs branching fraction. Even with new couplings, the total Higgs boson width is typically small, well below a GeV. If a SM-like Higgs boson is discovered, it will remain important to constrain possible rare decays into LJs. Therefore, searches for both prompt and long-lived dark photons decaying into LJs form an important component of the Higgs boson search program. Although a Higgs boson decaying to displaced LJs has never been searched for directly, the OPAL experiment conducted a decay mode independent search at LEP [14].
Neutral particles with large decay lengths and collimated final states represent, from an experimental point of view, a challenge both for the trigger and for the reconstruction capabilities of the detector.
Collimated particles in the final state can be difficult to disentangle due to the finite granularity of the detectors; moreover, in the absence of the central tracking detector information and of the main vertex constraint, it is difficult to reconstruct charged tracks from decay vertices far from the interaction point (IP). The ATLAS detector [15] is equipped with a muon spectrometer (MS) with high granularity tracking detectors and allows for the reconstruction of charged tracks in a “standalone” configuration using only the muon detector information. This is a crucial feature for detecting charged particles not originating from the primary interaction vertex.
The search presented in this analysis focuses on neutral particles decaying to muon jets (MJ) and it is the first ATLAS search for non-prompt MJ; prompt MJ searches have been performed both at the Tevatron [16, 17] and at the LHC [18, 19]. Other searches for displaced decays of a light Higgs to heavy fermion pairs have also been performed at the LHC [20].
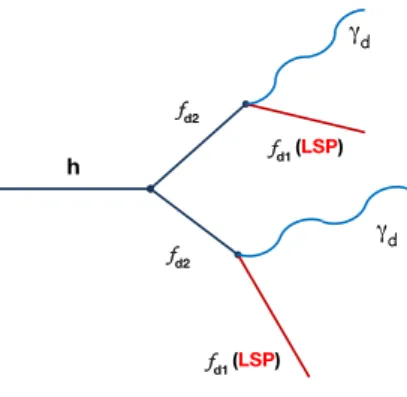
The benchmark channel used for this analysis is a simple scenario where the Higgs boson decays to
a pair of hidden fermions ( f
d2) each of which decays to one long lived
γdand one stable hidden fermion
( f
d1), resulting in two LJs from the
γddecays in the final state (see Figure 1). The benchmark mass of
the
γd(0.4 GeV) is chosen to maximize its decay branching fraction to muons [12]. This choice allows
the analysis strategy to be tuned for the relatively clean environment of the muon spectrometer.
h
γd γd
fd1 (LSP) fd2
fd2
fd1 (LSP)
Figure 1: Schematic picture of the Higgs boson decay chain, H→2( f
d2→f
d1γd), used for the benchmark sample. The Higgs boson decays to two hidden fermions ( f
d2). Each hidden fermion decays to a
γdand to a stable hidden fermion ( f
d1), resulting in two muon jets from the
γddecay in the final state.
2 The ATLAS Detector
ATLAS is a general purpose collider detector [15] consisting of an inner tracking system (ID) embed- ded in a superconducting solenoid, which provides a 2 T magnetic field parallel to the beam direction, electromagnetic and hadronic calorimeters and a muon spectrometer using three air core toroidal magnet systems
1. The trigger system has three levels [21] called Level-1 (L1), Level-2 (L2) and Event Filter (EF). The (L1) is a hardware-based system using information from the calorimeter and muon spectrom- eter, and defines one or more Regions of Interest (RoIs), geometrical regions of the detector, identified by
ηand
φcoordinates, containing interesting physics objects. The L2 and EF (globally called High Level Trigger, HLT) are software-based systems and can access information from all subdetectors. The ID, consisting of silicon pixel and micro strip detectors and a straw tube tracker, provides precision tracking of charged particles for
|η| ≤2.5. The electromagnetic and hadronic calorimeter system covers
|η| ≤
4.9 and, at
η=0, consists of 22 radiation lengths (in the electromagnetic part) and 9.7 interaction lengths. The MS provides a trigger (|
η| ≤2.4) and momentum measurements (|
η| ≤2.7) for charged particles entering the spectrometer. It consists of one barrel and two endcap parts, each with 16 sectors in
φ, equipped with precision tracking chambers and fast detectors for triggering. Monitored Drift Tubes(MDTs) are used for precision tracking in the region
|η| ≤2.0 and Cathode Strip Chambers for 2.0
≤|η| ≤
2.7. The MS detectors are arranged in three stations of increasing distance from the IP: inner, mid- dle and outer. The air core toroidal field allows an accurate charged particle reconstruction independent from the ID information. The trigger chambers (Resistive Plate Chambers in the barrel and the Thin Gap Chambers in the endcaps) are located in middle and outer (only in the barrel) stations. The L1 muon trigger requires hits in the middle station to create a low p
Tmuon RoI or hits in both the middle and outer stations for a high p
TRoI. The muon RoIs have a spatial extent of 0.2×0.2 (
∆η×∆φ) in the barreland of 0.1×0.1 in the endcap. The L1 RoIs are used by the HLT to provide sharp thresholds for muon momenta up to 40 GeV.
1ATLAS uses a right-handed coordinate system with its origin at the nominal interaction point (IP) in the center of the detector and thez-axis coinciding with the beam pipe axis. Thex-axis points from the IP to the center of the LHC ring, and they-axis points upward. Cylindrical coordinates (r,φ) are used in the transverse plane,φbeing the azimuthal angle around the beam pipe. The pseudorapidity is defined in terms of the polar angleθasη=-ln tan(θ/2).
3 Signal and background simulation
The set of parameters used to generate the benchmark samples is listed in Table 1. In the signal Monte Carlo the Higgs boson is generated using the gluon-gluon fusion production mechanism. The gluon- gluon fusion Higgs boson production cross section in pp collisions at
√s
=7 TeV, estimated at the currently highest known order (NNLO) [22], is
σS M =24.0 pb for m
H =100 GeV and
σS M =12.0 pb for m
H=140 GeV.The OPAL decay mode independent search at LEP implies m
H >82 GeV [14]. Furthermore, it is most probable for the Higgs boson to dominantly decay into the hidden sector when m
H <2m
Wsince a heavier Higgs boson has a large partial width into WW and ZZ final states. Therefore, the most interesting parameter space consists of the range m
H=82
−161 GeV, and the representative values m
H=100, 140 GeV are chosen for the benchmark points. The masses of f
d2and f
d1are chosen to be light relative to the Higgs boson mass, and far from the kinematic threshold at m
fd1 +m
γd =m
fd2.
Higgs mass mfd2 mfd1 γdmass cτ (GeV) (GeV) (GeV) (GeV) (mm)
100 5.0 2.0 0.4 47
140 5.0 2.0 0.4 36
Table 1: Parameters of the benchmark samples.
For the dark photon mass chosen in the benchmark model, the
γddecay branching fractions are expected to be [12]: 45% e
+e
−, 45%
µ+µ−, 10%
π+π−. Thus about 20% of the Higgs H
→ γd γd +X decays are expected to have a four-muon final state.
For the signal Monte Carlo simulation the
PYTHIAgenerator [23] is used, linked together with Mad- Graph 4.4.2 [24] and BRIDGE [25], for gluon-gluon fusion production of the Higgs boson and the subsequent decay to hidden sector particles. The cτ values of the
γdin the Monte Carlo simulation is chosen to have 80% of the decays inside the whole sensitive ATLAS detector volume, i.e. up to 7 m in radius and 13 m along the z axis
2around the interaction point (IP). The simulated events are processed through the full ATLAS simulation chain based on GEANT4 [26, 27].
Potential backgrounds include all the processes which lead to real prompt muons in the final state, like the SM processes W
+Jets,Z
+Jets,t¯ t, WW, WZ, and ZZ. However, the main contribution to the background is expected from processes giving a high production rate of secondary muons, such as decays in flight of K/
πand heavy flavor decays in multi-jet production or muons due to cosmic rays, which do not point to the primary vertex position. The SM background samples are generated using
PYTHIA(W
+Jets,and Z
+Jets) and
MC@NLO(t¯ t, WW, WZ, and ZZ). For the multi-jet background evaluation, a data driven method is used. The cosmic ray background evaluation is also done on data. Additional pp interactions in the same and nearby bunch crossings (pile-up) are included in the simulation. All MC samples are re- weighted to reproduce the observed distribution of the mean number of interactions per bunch crossing in the data.
4 The kinematics of the sample
In order to understand the main characteristics of the signal sample that will define the analysis strategy a set of plots at the Monte Carlo generator level of the most relevant kinematics variables is presented.
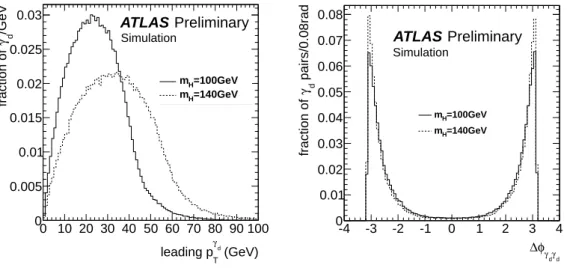
Figure 2 shows the p
Tdistribution of the leading
γd(right) and the
φangle between the two
γd(left).
Due to the small mass of the
γda boost factor of the order of 50 should be expected. The
γdpair is
27 m in radius and 13 m along thezaxis are the locations of the muon trigger system.
emitted approximately back-to-back, with a distortion of the distribution due to the emission of f
d1. The distribution of
∆R
= p(
∆η)2+(
∆φ)2between the two muons from the
γdand the p
Tof the muons are presented in Figure 3. Due to the small mass of the
γdthe
∆R of the two decay muons is almost alwaysbelow 0.1. The p
Tis relatively low but high enough to reach, in a large fraction of the cases, the MS, for which a minimum p
Tof 4 GeV is needed.
(GeV)
γd
leading pT
0 10 20 30 40 50 60 70 80 90 100 /GeV dγfraction of
0 0.005 0.01 0.015 0.02 0.025 0.03
=100GeV mH
=140GeV mH
Preliminary ATLAS
Simulation
γd
γd
φ
∆
-4 -3 -2 -1 0 1 2 3 4
pairs/0.08rad dγfraction of
0 0.01 0.02 0.03 0.04 0.05 0.06 0.07 0.08
=100GeV mH
=140GeV mH
Preliminary ATLAS
Simulation
Figure 2: Distributions of p
Tof the leading
γd(left) and
∆φbetween the two
γd(right) for the signal MC samples with m
H=100 GeV and m
H=140 GeV.
µ
Rµ
∆ 0 0.05 0.1 0.15 0.2 0.25 0.3 0.35 0.4
µµR∆ / 0.004 dγfraction of
0 0.02 0.04 0.06 0.08 0.1 0.12 0.14
=100GeV mH
=140GeV mH
Preliminary ATLAS
Simulation
(GeV)
µ
pT
0 20 40 60
/ GeVµfraction of
0 0.01 0.02 0.03 0.04 0.05 0.06 0.07 0.08
=100GeV mH
=140GeV mH
Preliminary ATLAS
Simulation
Figure 3:
∆R between the two muons from the
γd(left) and the p
Tdistribution of the muons (right) from both
γddecay for the signal MC samples with m
H=100 GeV and m
H=140 GeV.
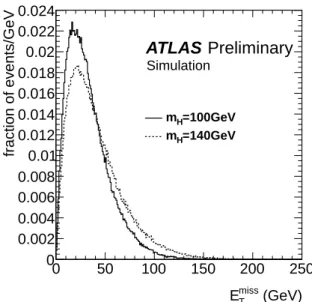
Finally Figure 4 shows the transverse missing energy E
Tmissdistribution of the Monte Carlo sample
computed at the event generator level. Since the two f
d1are emitted similarly to the two
γd, back to back
in
φ, the observedE
missTis quite small and it will not be considered in the signal selection.
(GeV)
miss
ET
0 50 100 150 200 250
fraction of events/GeV
0 0.002 0.004 0.006 0.008 0.01 0.012 0.014 0.016 0.018 0.02 0.022 0.024
=100GeV mH
=140GeV mH
Preliminary ATLAS
Simulation
Figure 4: E
missTin the event at the event generator level, for the signal MC samples with m
H =100 GeV and m
H=140 GeV.
5 Data samples and trigger selection
The dataset used for this analysis was collected during the first part of 2011 at
√s
=7 TeV. Only periods in which all ATLAS subdetectors were operational are used. The total integrated luminosity [28, 29] is 1.94 fb
−1with a 3.7 % uncertainty. All events are required to have at least one reconstructed vertex along the beam line with at least three associated tracks, each with p
T ≥0.5 GeV. The primary interaction vertex is defined as being the vertex whose constituent tracks have the largest sum of p
2T.
This analysis deals with
γddisplaced decays with final states containing only muons. Signal events are therefore characterized by a four-muon final state, with the four muons coming from two displaced decay vertices. Due to the relatively low p
Tof the muons and to the displaced decay vertex, a low p
Tmulti muon trigger with muons reconstructed only in the MS is needed. In order to have an acceptably low trigger rate at a low p
Tthreshold, a multiplicity of at least three muons must be required. Candidate events are collected using an unprescaled HLT trigger with three reconstructed muons of p
T ≥6 GeV, seeded by a L1 request of three muon RoIs. These muons are reconstructed only in the MS, since muon tracks, originating after the pixel detector, will not have a matching track in the ID tracking system. The trigger efficiency for the Monte Carlo signal samples, defined as the fraction of events passing the trigger requirement with respect to the events selected applying the analysis selection criteria (defined in Section 6) is 0.32
±0.01
statfor m
H =100 GeV and 0.31±0.01
statfor m
H =140 GeV.The main reason for the relatively low trigger efficiency is the small opening
∆R between the two muons of the
γddecay. From the
∆R distribution on the signal Monte Carlo
∆R
≤0.1 is expected, as shown in Figure 3. This value of
∆R is often smaller than the L1 trigger granularity; in this case the L1 will produce only one RoI. Therefore the trigger only fires if at least one of the
γdproduces two distinct L1 RoIs. The single
γdRoI e
fficiency,
ε2RoI(
ε1RoI), defined as the fraction of
γdpassing the o
ffline selection that give two (one) trigger RoIs is 0.296
±0.004 (0.626
±0.004 ) for m
H =100 GeV and 0.269
±0.003 (0.653
±0.003) for m
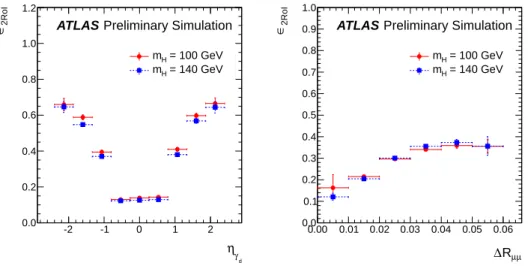
H =140 GeV. Figure 5 shows theε2RoIas function of the dark photon
ηand of the
∆R of the two muons from the
γddecay. The di
fferent trigger granularity between the barrel and the endcap and the consequent change in
ε2RoIas function of
ηis clearly visible.
The systematic uncertainty on the trigger efficiency is estimated using a sample of J/ψ
→µ+µ−with
∆
R
≤0.1 from collision data and on a corresponding sample of Monte Carlo events, using the tag and probe method. The tag is a combined muon, defined as a “standalone” muon combined at the ID level, associated with the trigger feature and with a “good ID track”, defined as a track having the number of hits in the pixel detector N
pixel ≥1, the number of hits in the Semi Conductor Tracker N
SCT≥6 and the number of hits in the Transition Radiation Tracker N
TRTtotal ≥6. The probe is a “good ID track” which, when combined with the tag track, makes an invariant mass within the J/ψ mass window. A muon RoI, different from the one associated with the tag, that matches in
ηand
φwith the probe, is searched for. The ratio between the number of probes with matched RoI and the number of probes without match gives the
εTP2ROI/εTP1ROIratio.
The values of
εTP2ROI/εTP1ROI=0.42
±0.05 for the J/ψ
→µ+µ−data and
εTP2ROI/εTP1ROI=0.39
±0.05 for the corresponding Monte Carlo sample are obtained. The relative statistical uncertainty on the di
fference between these two estimates has been assumed as systematic uncertainty on the trigger efficiency, and it amount to 17%.
γd
η
-2 -1 0 1 2
2RoI∈
0.0 0.2 0.4 0.6 0.8 1.0 1.2
= 100 GeV mH
= 140 GeV mH
Preliminary Simulation ATLAS
µ
Rµ
∆ 0.00 0.01 0.02 0.03 0.04 0.05 0.06
2RoI∈
0.0 0.1 0.2 0.3 0.4 0.5 0.6 0.7 0.8 0.9 1.0
= 100 GeV mH
= 140 GeV mH
Preliminary Simulation ATLAS
Figure 5:
ε2RoIas a function of the
ηof the
γdand of the
∆R of the muon pair for the 100 GeV and 140 GeV Higgs boson mass Monte Carlo samples. The e
fficiency decrease at small values of
∆R and the different trigger granularity between the barrel and the endcap are clearly visible.
6 Muon Jets reconstruction and event selection
MJs from
γddisplaced decays are characterized by a pair of muons in a narrow cone, produced away from the primary vertex of the event. Consequently tracks reconstructed only in the MS with a good quality fit [30] are used. MJs are identified using a simple clustering algorithm that associates all the muons in cones of
∆R
<0.2, starting with the muon with highest p
T. The size
∆R
<0.2 of the cone takes into account the multiple scattering of the muons in the calorimeters. All the muons found in the cone are associated to a MJ. After this procedure, if any muons are unassociated with a MJ the search is repeated for this remainder, again starting with the highest p
Tmuon. This continues until all possible MJs are formed. The MJ direction and momentum are obtained from the vector sum over all muons in the MJ. Only MJs with two reconstructed muons are accepted and only events with two MJs are kept for the subsequent analysis.
The possible contribution to the background of SM processes which lead to real prompt muon pairs
in the final state, is evaluated using Monte Carlo samples. After the trigger and the requirements of
having two MJ in the event their contributions have been found to be negligible. The only significant
(GeV)
isol
ET
0 5 10 15 20
/ 0.6GeVµfraction of
0.00 0.05 0.10 0.15 0.20 0.25 0.30 0.35 0.40
Ldt = 1.94fb-1
∫
=7TeV, s data, µ µ
→ Z
= 100 GeV mH
= 140 GeV mH
Preliminary ATLAS
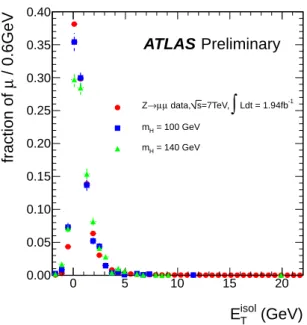
Figure 6: Calorimetric isolation around the MJ direction. The calorimetric isolation variable E
Tisolis defined as the difference between the transverse energy E
Tin a cone
∆R
2 =0.4 around the highest p
Tof the MJ and the E
Tin a cone
∆R
1 =0.2. The distribution of the isolation variable E
isolTfor the two signal Monte Carlo samples with m
H =100 GeV and m
H =140 GeV is compared with the isolation around the muons of a Z
→µµsample from collision data.
background sources are expected from processes giving a high production rate of secondary muons, such as decays in flight of K
/πand heavy flavor decays in multi-jet production or muons not pointing to the primary vertex due to cosmic rays.
In order to separate the signal from the background a number of discriminating variables have been studied. The multi-jet background can be significantly reduced by using calorimeter isolation around the MJ direction. The calorimetric isolation variable E
Tisolis defined as the difference between the transverse calorimetric energy E
Tin a cone
∆R
2=0.4 around the highest p
Tmuon of the MJ and the E
Tin a cone
∆
R
1=0.2, see Figure 6.
The isolation modeling is validated for real isolated muons with a sample of muons coming from Z
→ µµdecays. The distribution obtained on the Z
→ µµsample shows a good agreement with the distribution obtained on the signal Monte Carlo samples, as shown in Figure 6. To further improve the signal to background ratio, two additional discriminating variables are used:
∆φbetween the two MJs and
Σp
TIDfor the MJs, defined as the sum of the transverse momentum of the tracks, identified with the ID, inside a cone
∆R
<0.4 around the direction of the MJ
3.
For the background coming from cosmic rays muons (mainly pairs of parallel cosmic muons crossing the detector) a cut on the impact parameters of the muon tracks with respect to the primary interaction vertex is used.
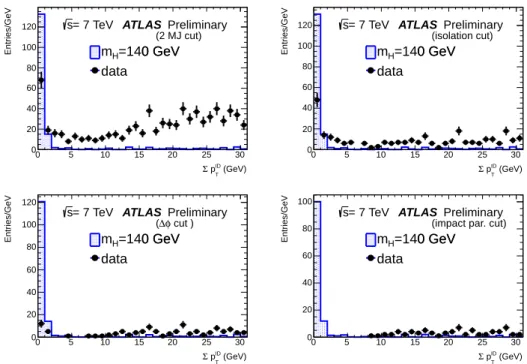
After the optimization of the cuts, the final set of selection criteria are the following:
•
topology cut: events are required to have two MJs, N
MJ=2
•
MJ isolation: require MJ isolation with E
isolT ≤5 GeV for both MJs in the event (see Figure 6)
3The muon tracks of MJ in the ID, if any, are not removed from the isolation sum, so that prompt muons, which give a reconstructed track in both the ID and MS, will contribute to theΣpIDT . As a consequence a cut onΣpTIDof a few GeVwill remove prompt MJs or MJs with very short decay length.
(GeV)
ID
pT
Σ
0 5 10 15 20 25 30
Entries/GeV
0 20 40 60 80 100 120
=140 GeV mH
data
=140 GeV mH
data ATLAS
= 7 TeV
s Preliminary
(2 MJ cut)
(GeV)
ID
pT
Σ
0 5 10 15 20 25 30
Entries/GeV
0 20 40 60 80 100 120
=140 GeV mH
data
=140 GeV mH
data ATLAS
= 7 TeV
s Preliminary
(isolation cut)
(GeV)
ID
pT
Σ
0 5 10 15 20 25 30
Entries/GeV
0 20 40 60 80 100 120
=140 GeV mH
data
=140 GeV mH
data ATLAS
= 7 TeV
s Preliminary
cut ) φ
∆ (
(GeV)
ID
pT
Σ
0 5 10 15 20 25 30
Entries/GeV
0 20 40 60 80 100
=140 GeV mH
data
=140 GeV mH
data ATLAS
= 7 TeV
s Preliminary
(impact par. cut)
Figure 7: Distribution of
Σp
TIDof the MJ at di
fferent steps of the event selection criteria: after the requirement of the signal topology (top left), after the isolation cut (top right), after the
|∆φ|cut (bottom left), and after the impact parameters cut (bottom right). The black dots are the data, the blue histogram is the signal Monte Carlo with m
H =140 GeV.
•
require
|∆φ| ≥2 between the two MJs (see Figure 2)
•
require opposite charge of the two muons in a MJ
•
require a cut on the transverse and longitudinal impact parameters of the muons with respect to the primary vertex :
|d0|<200 mm and
|z0|<270 mm
•
require
Σp
IDT <3 GeV for both MJ (see Figure 7)
The result of the selection at different steps of the cut flow is shown in Figure 7 and summarized in Table 2. No events survive the selections in the data sample whereas the expected number of signal events from Monte Carlo simulation are 75 and 48 for Higgs boson masses of 100 and 140 GeV, respectively.
The method for the estimation of the background yields, quoted in Table 2, will be discussed in Section 6.
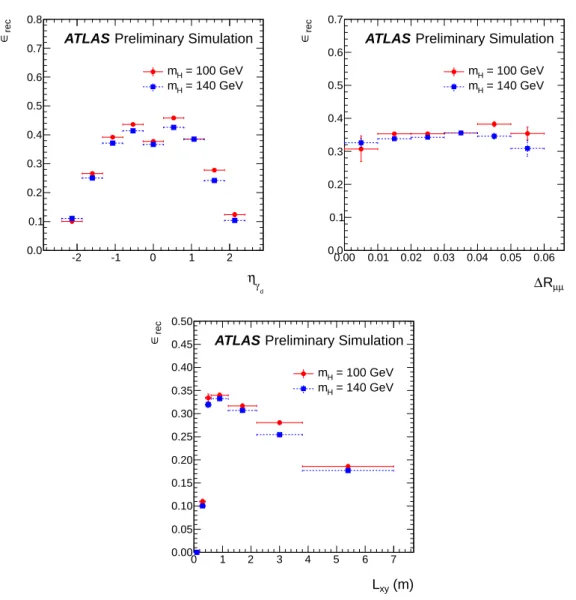
The resulting single
γdreconstruction e
fficiency at the end of the selection, defined as the ratio between the number of
γdin the spectrometer acceptance (|
η| ≤2.4) with both muons having p
T ≥6 GeV and the number of
γdat the end of the o
ffline selection, is shown in Figure 8 as function of
η, ofthe opening
∆R of the two muons from the
γddecay and of the decay length in the transverse plane, L
xy, of the
γd. The drop of the reconstruction efficiency at very short L
xyis a consequence of the
Σp
TIDcut.
The systematic uncertainty on the reconstruction e
fficiency is evaluated using a tag and probe method
by comparing the reconstruction e
fficiency
εTPrecon a sample of J/ψ
→ µ+µ−from collision data and
on a J/ψ
→ µ+µ−Monte Carlo sample. The tag is a combined muon (MS track with a combined
reconstruction in the ID); the probe is a “good ID track” which, when combined with the tag track,
makes an invariant mass within the J/ψ mass window. To measure the reconstruction e
fficiency the ID
probe track is associated to a “standalone” muon track, different to the one associated to the tag. The
result is shown in Figure 9.
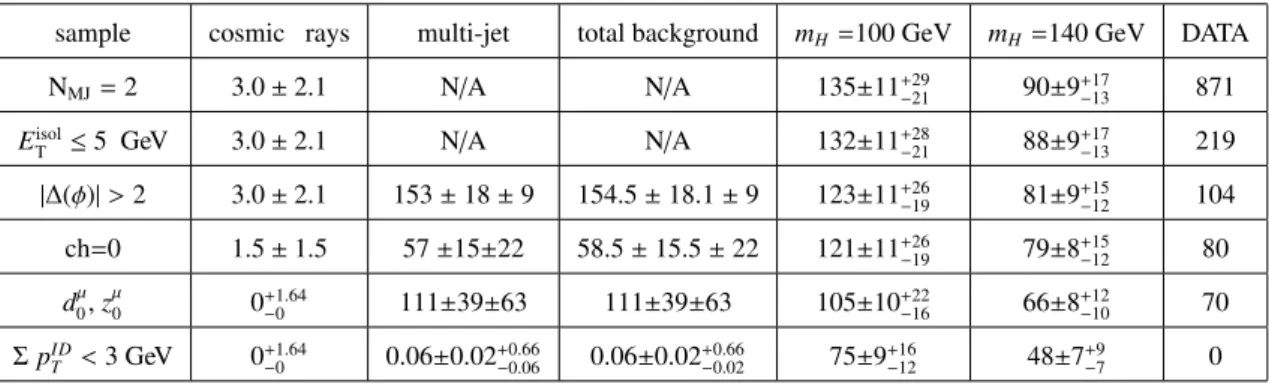
sample cosmic rays multi-jet total background mH =100 GeV mH=140 GeV DATA
NMJ=2 3.0±2.1 N/A N/A 135±11+−2129 90±9+17−13 871
EisolT ≤5 GeV 3.0±2.1 N/A N/A 132±11+−2821 88±9+−1713 219
|∆(φ)|>2 3.0±2.1 153±18±9 154.5±18.1±9 123±11+−1926 81±9+−1215 104 ch=0 1.5±1.5 57±15±22 58.5±15.5±22 121±11+−1926 79±8+−1215 80 dµ0,zµ0 0+−01.64 111±39±63 111±39±63 105±10+−1622 66±8+−1012 70 ΣpIDT <3 GeV 0+−01.64 0.06±0.02+−0.060.66 0.06±0.02+−0.020.66 75±9+−1216 48±7+9−7 0
Table 2: Cut flow for the signal selection on signal Monte Carlo, the corresponding cosmic rays back- ground, the multi-jet background estimatation from the ABCD method (described in Section 6) and the data; all the numbers of events are normalized to an integrated luminosity of 1.94 fb
−1. The first uncer- tainties are statistical, and the second systematic.
The relative difference between the result obtained from the J/ψ
→ µ+µ−data and the J/ψ
→ µ+µ−MC sample in the same range of
∆R
≤0.1 of the signal is taken as systematic uncertainty on the reconstruction efficiency.
7 Multi-jet and cosmic rays backgrounds evaluation
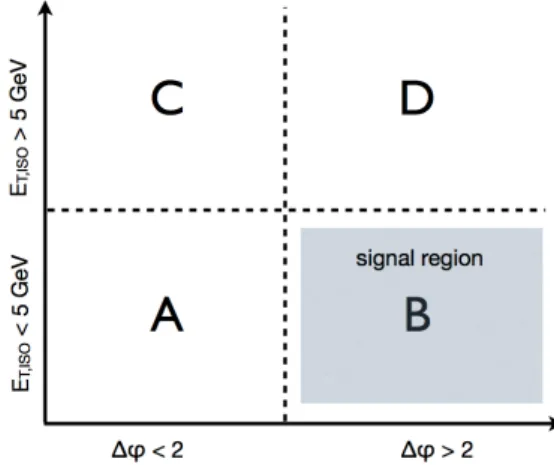
In order to estimate the multi-jet background contamination in the signal region we use a data driven method, a 2D ABCD method slightly modified to cope with the problem of the very low statistics in the control regions. The ABCD method assumes that two variables can be identified, which are relatively uncorrelated, and which can each be used to separate signal and background. The assumption is made that the multi-jet background distribution can be factorized in the MJ isolation and the MJ
|∆φ|plane.
The region B, defined by E
isolT <5 GeV and
|∆φ| >2, is the signal region (see Figure 10). Neglecting the signal contamination in region A, C and D (E
Tisol >5 GeV or
|∆φ| <2) the number of multi-jet background events in the signal region can be evaluated as N
B =N
D×N
A/NC. The problem of the very low statistics in the control regions is handled by not directly counting the number of events surviving the cut on the last discriminating variable
Σp
IDTin the 3 control regions but by integrating from zero up to the nominal cut on the
Σp
IDTa functional form describing the
Σp
IDTdistributions with parameters fitted in each region. The functional model has been varied to estimate systematic uncertanties.
The values of N
A, N
C, and N
Das a function of the cut on the final discriminant variable
Σp
IDT, are extracted by modeling the
Σp
TIDdistributions with bifurcated gaussian templates, with parameters fitted from the data in the corresponding regions, and by integrating the fitted function in the range 0
< Σ
p
IDT <3 GeV. The extracted yields are N
A =(7.1
±1.5
stat)
·10
−3, N
C =(1.81
±1.0
stat)
·10
−2and N
D =(1.51
±0.07
stat)
·10
−1and the estimated number of multi-jet background events in the signal region is N
B =0.06
±0.02
stat. Possible sources of systematic uncertainties related to the background estimation method are also evaluated. The pdf template model is changed and the procedure to estimate the number of multi-jet background events in the signal region is repeated. The difference in N
Bis taken as systematic uncertainty of the modeling of the multi-jet background shape and it amounts to
±0.66.The e
ffect of a possible signal leakage in the background regions is also considered and it is found to be negligible.
The background induced by muons from cosmic rays showers is evaluated using events collected by
the same trigger that has been used on collision events, active when there are no collisions (empty bunch
γd
η
-2 -1 0 1 2
rec∈
0.0 0.1 0.2 0.3 0.4 0.5 0.6 0.7 0.8
= 100 GeV mH
= 140 GeV mH
Preliminary Simulation ATLAS
µ
Rµ
∆
0.00 0.01 0.02 0.03 0.04 0.05 0.06
rec∈
0.0 0.1 0.2 0.3 0.4 0.5 0.6 0.7
= 100 GeV mH
= 140 GeV mH
Preliminary Simulation ATLAS
xy (m) L
0 1 2 3 4 5 6 7
rec∈
0.00 0.05 0.10 0.15 0.20 0.25 0.30 0.35 0.40 0.45 0.50
= 100 GeV mH
= 140 GeV mH
Preliminary Simulation ATLAS
Figure 8:
γdreconstruction efficiency
εrecas a function of the
η, of the∆R and of the transverse decay length of the
γdfor m
H =100 GeV and m
H =140 GeV. The reconstruction e
fficiency is defined as the ratio between the number of
γdin the spectrometer acceptance (|
η| ≤2.4) with both muons of p
T ≥6 GeV and the number of
γdat the end of the offline selection. The drop of the reconstruction efficiency at very short decay lengths is a consequence of the
Σp
TIDcut.
crossings) and rescaling the events by the collision to empty ratio (1.26) and of the active time (1.18)
4. No events survived the requirements on the impact parameters with respect to the primary vertex (|d
0|<200 mm and
|z0|<270 mm), resulting in a cosmic rays contamination estimate of 0
+1.64−0. The final yields for the different background sources are summarized in Table 2.
8 Systematic uncertainties
The following effects are considered as possible sources of systematic uncertainties:
4The trigger in the empty bunch crossing was not active in all the runs.
Tag-Probe
∆R
0.0 0.1 0.2 0.3 0.4
TP rec∈
0.0 0.2 0.4 0.6 0.8 1.0
data ψ J/
ψ MC J/
= 100 GeV mH
= 140 GeV mH
Preliminary ATLAS
= 7TeV s
Ldt = 1.94fb-1
∫
Figure 9: Tag and probe reconstruction efficiency
εT Precas a function of the
∆R between the two muons, evaluated on a sample of J/ψ
→ µ+µ−from collision data and on a corresponding sample of Monte Carlo events. For completeness the
εT Precfor the signal Monte Carlo, evaluated with a similar tag and probe method is also shown.
Figure 10: Definition of regions used for the ABCD method.
• Luminosity
The overall normalization uncertainty of the integrated luminosity is 3.7 % [28, 29].
• Muon momentum resolution
The systematic uncertainty on the momentum resolution for standalone muons has been evaluated by shifting the momenta of the muons by scale factors derived from data-Monte Carlo agreement, and by observing the effect of this shifts on the signal efficiency. The overall effect of the muon momentum resolution uncertainty has been found to be negligible.
• Trigger
The systematic uncertainty on the single
γdtrigger e
fficiency, evaluated using a tag and probe
method is 17%.
• Reconstruction efficiency
The systematic uncertainty on the reconstruction e
fficiency, evaluated using a tag and probe method from the single
γdreconstruction efficiency, is 13%.
• Effect of pile-up
The systematic uncertainty related to the e
ffect of pile-up on the signal e
fficiency is evaluated by comparing the number of signal events after all the selection criteria on the signal Monte Carlo sample, with and without the pile-up re-weighting applied. This systematic uncertainty has been found to be negligible.
• Effect ofΣ
p
IDT cutSince the
Σp
IDTcut could a
ffect the minimum cτ value that can be excluded, the e
ffect of this cut on the signal Monte Carlo has been studied. A variation of 10% on the
Σp
TIDcut results in a relative variation of
<1% on the signal.
• Background evaluation
The systematic uncertainties that can affect the background estimation are related to the data driven method used. The functional model used to fit
Σp
IDTdistribution is varied to evaluate the systematic related to the modeling shape, which also describe the e
ffect of the
Σp
IDTcut on the background estimation. This systematic uncertainty amount to
±0.66 events. The effect of signal leakage is also evaluated and it has been found to be negligible.
9 Results and interpretation
The acceptance e
fficiency for the selection criteria described above is evaluated for the signal Monte Carlo benchmark samples (see Table 1) as a function of mean cτ of the
γd. From the signal acceptance efficiency, the number of expected signal events assuming 100% branching fraction for H
→ γd γd+X are predicted. These numbers, together with the expected number of background events (multi-jet and cosmic rays), and with the number of observed events surviving the selection criteria in 1.94 fb
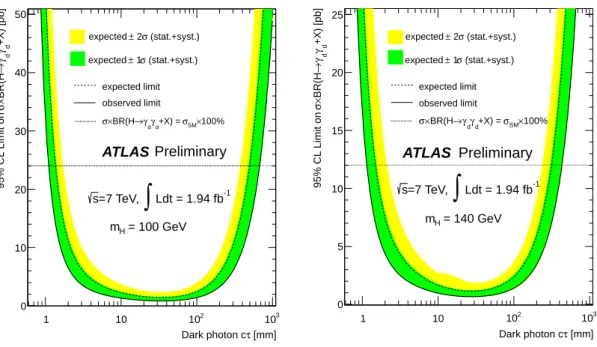
−1, are used as input to obtain 95% upper confidence limits. Using the CLs method [31], the expected 95%
upper limits on the the cross section times branching fraction for the process H
→γdγd+X as function of the dark photon mean cτ for m
H =100 GeV and m
H =140 GeV are set. These limits are plotted on Figure 11 as a function of the mean cτ of the dark photon.
Assuming 100% branching fraction of H
→γdγd+X, a wide range of
γdmean cτ are excluded at the 95% CL, as shown in Table 3.
Higgs boson mass excluded cτrange
(GeV) (mm)
100 1 mm≤cτ≤670 mm 140 1 mm≤cτ≤430 mm
Table 3: Ranges of
γdmean cτ excluded at 95% CL for the signal with m
H=100 GeV and for the signalwith m
H=140 GeV, assuming 100% branching fraction of H
→γdγd+X.
10 Conclusions
A search for a light Higgs boson decaying into a pair of hidden fermions ( f
d2), each of which decays to
a
γdand to a stable hidden fermion ( f
d1), resulting in two muon jets from the
γddecay in the final state,
[mm]
τ Dark photon c
1 10 102 103
+X) [pb] dγ dγ→BR(H×σ95% CL Limit on
0 10 20 30 40 50
= 100 GeV mH
(stat.+syst.) σ
± 2 expected
(stat.+syst.) σ
± 1 expected
ATLAS Preliminary
Ldt = 1.94 fb-1
∫
=7 TeV, s
observed limit expected limit
×100%
σSM
+X) = γd
γd
→
×BR(H σ
[mm]
τ Dark photon c
1 10 102 103
+X) [pb] dγ dγ→BR(H×σ95% CL Limit on
0 5 10 15 20 25
= 140 GeV mH
(stat.+syst.) σ
± 2 expected
(stat.+syst.) σ
± 1 expected
ATLAS Preliminary Ldt = 1.94 fb-1
∫
=7 TeV, s
observed limit expected limit
×100%
σSM
+X) = γd
γd
→
×BR(H σ