ATLAS-CONF-2016-074 08August2016
ATLAS NOTE
ATLAS-CONF-2016-074
5th August 2016
Search for a high-mass Higgs boson decaying to a pair of W bosons in p p collisions at √
s = 13 TeV with the ATLAS detector
The ATLAS Collaboration
Abstract
A search for a high-mass Higgs boson is performed in the H
→W W
→`ν`νdecay channel using pp collision data corresponding to an integrated luminosity of 13.2 fb
−1, collected at a centre-of-mass energy of 13 TeV by the ATLAS detector at the Large Hadron Collider.
No evidence of a high-mass Higgs boson is found. Upper limits on
σH ×BR(H→W W ) as a function of the Higgs boson mass and width are obtained in the mass range between 300 GeV and 3 TeV.
©2016 CERN for the benefit of the ATLAS Collaboration.
Reproduction of this article or parts of it is allowed as specified in the CC-BY-4.0 license.
1 Introduction
A Higgs boson with a mass around 125 GeV was discovered in 2012 by the ATLAS [1] and CMS [2]
collaborations at the LHC. While its properties have so far been measured to be consistent with the Standard Model (SM) Higgs boson, h, with a mass of 125 GeV [3, 4], the search for an extended Higgs sector is still motivated in many scenarios beyond the SM [5, 6]. In particular, it is important to confirm that the unitarisation of W W scattering at high energies is achieved completely by the SM Higgs boson or whether another neutral boson contributes to this unitarisation.
This note reports the results of a search for a heavy neutral scalar decaying to two W bosons, which then decay leptonically in the H
→W W
→`ν`νfinal state; only di
fferent-flavour lepton pairs in the final state are considered. The analysis is based on two datasets collected by the ATLAS detector in 2015 and early 2016 at a centre-of-mass energy
√s
=13 TeV corresponding to an integrated luminosity of 13.2 fb
−1. The dataset of 2015 has been analysed earlier this year [7].
This search follows closely the previous analysis [7], but with a few changes, as follows. The lower edge of the mass range is extended down to 300 GeV, instead of 600 GeV. Previously, separate categories for zero-, one-, and at least two-jets were defined. For this analysis, categories with one- and at least two-jets are optimised for a vector boson fusion (VBF)-like signal and the remaining category is quasi-inclusive for a gluon gluon fusion (ggF)-like signal. The VBF phase space has been excluded from the ggF category phase space so that the ggF and VBF categories are orthogonal to each other. The discriminating variable used for this search is an estimator of the W W invariant mass known as the transverse mass (m
T), defined in Section 5.
The search sensitivity depends on the assumed Higgs boson width. Two di
fferent hypotheses are tested:
a narrow width approximation (NWA), where the width of the heavy Higgs boson is smaller than the experimental resolution, and a large width assumption (LWA), where widths of 5%, 10%, and 15% of the heavy Higgs boson mass are considered. The choice of the width range for the heavy Higgs boson is motivated by the fact that, for several of the most relevant BSM models, widths above 15% are already excluded by the experimental data [5]. For example, the parameter space not yet excluded in two-Higgs- doublet models constrains the width of a SM-like heavy Higgs boson to be
<10%. Moreover, in Higgs triplet models [6], indirect constraints from the mass of the W boson also restrict significantly the possible widths of a heavy Higgs boson. For the NWA hypothesis, the interference e
ffects between the heavy Higgs boson and the SM production of dibosons are negligible. For the LWA hypothesis, the e
ffects of the interference with the SM diboson continuum and the 125 GeV Higgs boson have been neglected.
The note is organised as follows. Section 2 describes the ATLAS detector. The data and simulated samples are listed in Section 3. The reconstructed objects are defined in Section 4, the event selections in Section 5, and the background estimation techniques in Section 6. Systematic uncertainties are discussed in Section 7 and the results are presented in Section 8. Finally, the conclusions are given in Section 9.
2 ATLAS detector
The ATLAS detector [8] is a general-purpose particle detector used to investigate a broad range of physics
processes. It includes an inner tracking detector (ID) surrounded by a superconducting solenoid magnet,
electromagnetic and hadronic calorimeters and a muon spectrometer (MS) providing a toroidal field from
air-core superconducting magnets. The ID consists of a silicon pixel detector including the insertable B- Layer [9], which was installed before the start of Run-2, a silicon strip detector, and a straw tube tracker.
It is situated inside a 2 Tesla field produced by the solenoid magnet and provides precision tracking of charged particles with pseudorapidity
1 |η| <2.5. The straw tube detector also provides transition radiation measurements for electron identification. The calorimeter system covers the pseudorapidity range
|η| <4.9. It is composed of sampling calorimeters with either liquid argon or scintillator tiles as the active medium, and lead, steel, copper, or tungsten as the absorber material. The MS provides muon identification and momentum measurements for
|η| <2.7. The ATLAS detector has a two-level trigger system to select events for o
ffline analysis.
3 Data and simulation samples
The data used in this analysis was collected with single-electron and single-muon triggers. The single- electron (single-muon) triggers have a threshold at 20 GeV (15 GeV) for the first trigger level while the high-level trigger is a combination of triggers and depends on the data taking period, the lowest threshold being always at 24 GeV (between 20 and 24 GeV). The lepton trigger e
fficiencies are measured using Z boson candidates as a function of lepton p
Tand
η. The single-lepton trigger efficiencies are approximately70% for muons with
|η| <1.05, 90% for muons in the range 1.05
< |η| <2.40, and
≥90% for electrons in the range
|η| <2.40. Data quality criteria are applied to ensure that events are recorded with stable beam conditions and with all relevant subdetector systems operational.
Samples of simulated signal and background events are used to optimise the event selection and estim- ate the signal acceptance and the background yields from various SM processes. The sample for the NWA heavy Higgs boson signal is produced with Powheg-Box 2.0 [10] using the CT10 parton distribu- tion functions (PDF) set [11], interfaced with P
ythia8.186 [12]. For the LWA heavy Higgs boson signal, events are simulated using M
adG
raph5_
aMC@NLO [13] with P
ythia8.186 and the NNPDF23LO PDF set [14]. The mass of the heavy Higgs boson signals considered in this analysis spans the range between 300 GeV (400 GeV for LWA) and 3 TeV . Samples have been generated in steps of 100 GeV up to 1 TeV, and in steps of 200 GeV thereafter. The main sources of SM background include events from the produc- tion of t t, single-top, dibosons (W W ¯ , W Z and Z Z), Z/γ
∗+jets (γ∗being a virtual photon) and W
+jets.Single-top and t¯ t simulated events are generated with P
owheg-B
ox2.0 using the CT10 PDF interfaced to P
ythia6.428 [15] for parton showering, with the P
erugia2012 [16] tune and CTEQ6L1 PDF for the underlying event description. EvtGen 1.2.0 [17] is used to model properties of the bottom and charm hadron decays. The mass of the top quark is set to m
t =172.5 GeV. Diboson samples are generated with S
herpa2.1.1 [18] using the CT10 PDF. Production of W and Z bosons in association with jets is also simulated using Sherpa 2.1.1 with the CT10 PDF, where b- and c-quarks are treated as massive particles.
The
gg →W W production includes also the contribution of the SM Higgs boson (h) at 125 GeV and the interference e
ffects between the two. The VBF part of the SM Higgs boson is generated with the same generators as for the NWA samples.
1ATLAS uses a right-handed coordinate system with its origin at the nominal interaction point (IP) in the centre of the detector and thez-axis along the beam pipe. The x-axis points from the IP to the centre of the LHC ring, and the y-axis points upwards. Cylindrical coordinates (r, φ) are used in the transverse plane,φbeing the azimuthal angle around the beam pipe.
The pseudorapidity is defined in terms of the polar angleθasη =−ln tan(θ/2). Angular distance is measured in units of
∆R≡ q
∆η2+∆φ2.
The e
ffect of multiple pp interactions in the same and neighbouring bunch crossings (pile-up) is included by overlaying minimum-bias collisions, simulated with Pythia 8.186, on each generated signal and back- ground event. The number of overlaid collisions is such that the distribution of the average number of interactions per pp bunch crossing in the simulation matches that observed in the data (on average about 20 interactions per bunch crossing). The generated samples are processed through a Geant4-based de- tector simulation [19, 20], with the standard ATLAS reconstruction software used for collision data.
4 Object definition
Events are required to have at least one primary vertex with a minimum of two associated tracks, each with transverse momentum p
T >400 MeV. If there is more than one vertex reconstructed in the event that meets these conditions, the one with the largest track
Pp
T2is chosen as the primary vertex and is subsequently used for the calculation of the main physics objects in this analysis.
Electrons are selected from clusters of energy deposits in the calorimeter that match a track reconstructed in the ID. They are identified using the likelihood identification criterion described in Ref. [21]. The levels of identification are categorised as “LooseLH”, “MediumLH” and “TightLH”, which correspond to approximately 96%, 94% and 88% identification efficiencies for an electron with transverse energy (E
T) of 100 GeV, where E
Tis the magnitude of the transverse component of the electron momentum as measured using the electromagnetic calorimeter. The electrons used in this analysis are required to pass at least the “MediumLH” selections and be within
|η|<2.47, excluding the transition region between the barrel and endcaps in the LAr calorimeter (1.37
< |η|<1.52).
Muons are reconstructed by combining ID and MS tracks that have consistent trajectories and curvatures [22].
Based on the quality of the reconstruction and identification, muon candidates are defined as “Loose”,
“Medium” and “Tight”, with increasing purity but decreasing e
fficiency. The reconstruction e
fficiencies for muons originating from the decay of W bosons for these definitions are approximately 98%, 96%
and 92%, respectively [23]. The muon candidates used in this analysis are required to pass at least the
“Medium” selections and have
|η| <2.5.
To ensure that leptons originate from the interaction point, a requirement of
|d
0|/σd0 <5 (3) is imposed on the electrons (muons) and
|z
0sin
θ| <0.5 mm is applied on both lepton types, where d
0and z
0are respectively the transverse and longitudinal impact parameter of the lepton with respect to the primary vertex and
σd0is the uncertainty on the measured d
0. In addition, the leptons are required to be isolated from other tracks and calorimetric activity. This is done by applying p
T- and
η-dependent isolationcriteria. For muons, the calorimeter isolation is based on energy deposits in the calorimeter within a cone
∆R = p
(
∆η)2+(
∆φ)2of 0.2 around the muons. The muon track isolation uses a variable cone size starting at
∆R =0.3 and shrinking with the p
Tof the muon [24]. For electrons, the same calorimeter isolation as for the muons is used while the electron track isolation uses a variable cone size starting at
∆R =
0.2. The efficiency of these isolation requirements is 90% for both leptons with p
Tof 25 GeV, rising to 99% at 60 GeV.
Jets are reconstructed from three-dimensional clusters of energy deposits in the calorimeter using the
anti-k
talgorithm [25] with a distance parameter of R
=0.4. The four-momenta of the jets are calculated
as the sum of the four-momenta of their constituents, which are assumed to be massless. The jets are
required to have p
T >30 GeV and
|η|<4.5.
For jets with p
T <60 GeV, the “jet vertex tagger” (JVT) variable [26], a multivariable tagger, is used to suppress jets from pile-up events. In addition, jets are discarded if they are within a cone of size
∆R<0.2 of an electron candidate, or if they have fewer than three associated tracks and are within a cone of size
∆R <
0.2 of a muon candidate. For the remaining jet-lepton pairings within
∆R <0.4, the lepton is rejected if the jet passes the JVT requirement.
Jets are considered to contain a b-hadron (b-tagged) if they yield an MV2c10 [27] b-tagging algorithm discriminant value exceeding a reference value, chosen to yield an average 85% tagging efficiency for b-jets in simulated t¯ t events. The jets with p
T >20 GeV and within
|η| <2.5 recognised as b-quark- induced are called b-tagged jets in this note. The misidentification rate for selecting jets originating from a light quark or gluon is less than 1%, while it is approximately 17% for c-jets.
The missing transverse momentum, with magnitude E
Tmiss, is calculated as the negative vectorial sum of the transverse momenta of all calibrated selected objects, such as electrons and jets, and is corrected to take into account the momentum of muons. Tracks with p
T >500 MeV compatible with the primary vertex and not matched to any of those objects are also included in the reconstruction [28, 29].
5 Event selection
The preselection includes requirements on the leading and subleading lepton (e and
µ) transverse mo-mentum p
T: p
leadT >25 GeV and p
subleadT >15 GeV. Only different-flavour lepton final states are analysed as they provide the highest signal sensitivity. The event is required to have two oppositely-charged leptons and no additional lepton with p
T >15 GeV in order to suppress diboson backgrounds. Both leptons must satisfy the minimal quality criteria discussed in Section 4, but in addition, electrons (muons) with p
T <25 GeV must pass the “TightLH” (“Tight”) selections. Backgrounds from low-mass resonances are rejected by requiring m
`` >10 GeV, with m
``being the invariant mass of the leading and subleading leptons.
The signal and background compositions depend strongly on the event categories. For the quasi-inclusive ggF category, the signal originates predominantly from the ggF process, and top-quark and W W events are the dominant background processes. For the VBF N
jet =1 category, both the VBF and ggF signal processes contribute, and the large majority of the background comes from W W and top-quark events, which contribute approximately equally to the background. For the VBF N
jet ≥2 category, the signal originates mostly from the VBF process and top-quark events are the dominant background.
The event selection has been optimised by using a boosted decision tree (BDT) to choose a set of the most discriminating variables and then establishing a threshold value (cut) for each variable by maximising the signal significance in the presence of backgrounds. The resulting selections that define the signal region (SR) for the various categories, namely the quasi-inclusive ggF (SR
ggF), the N
jet =1 VBF (SR
VBF1J) and the N
jet ≥2 VBF (SR
VBF2J) are summarised in Table 1, while the control region (CR) selections are discussed in Section 6.
The selected variables for discriminating signals from the large SM backgrounds are the pseudorapidity
difference between the two leptons,
∆η``, m
``, and p
leadT. The p
Tthreshold for the VBF jet categorisation
is 30 GeV in the pseudorapidity region
|η| <4.5. In addition, to suppress the top-quark background,
events with one or more tagged b-jets, N
b-jet, are rejected from the signal regions. The p
Tthreshold for
the b-jet veto is 20 GeV for jets within
|η| <2.5.
To reduce the Z
+jets and W
+jets contributions, cuts are applied on two other variables: p
subleadTand the maximum value of the transverse mass of one of the two leptons calculated with the missing transverse momentum as
m
WT = q2p
T`E
Tmiss(1
−cos(φ
`−φETmiss))
,(1) where p
T`and
φ`are the transverse momentum and azimuthal angle of a given lepton and
φETmissis the azimuthal angle of the missing transverse momentum vector.
For the VBF N
jet =1 category, two discriminating variables are used to minimise the contribution of the ggF signal: the pseudorapidity of the jet,
ηj, and the minimum value of the pseudorapidity distance between the jet and one of the leptons, min(
∆ηj`). For the VBF N
jet ≥2 category, the invariant mass, m
j j, and the rapidity di
fference,
∆yj j, of the two leading jets are used to select the VBF signal.
The discriminating variable used in this search is the transverse mass defined as m
T= q(E
T``+E
Tmiss)
2− |p``T +EmissT |2,
(2)
where
E
T``= q|p``T |2+
m
2``.(3)
The NWA and LWA signal acceptance times e
fficiency after all selection requirements for a 700 GeV ggF signal is approximately 55% in the quasi-inclusive ggF category and 10% or less in the VBF N
jet =1 and N
jet ≥2 categories. For a 700 GeV VBF signal, it is between 15% and 25% for the three event categories.
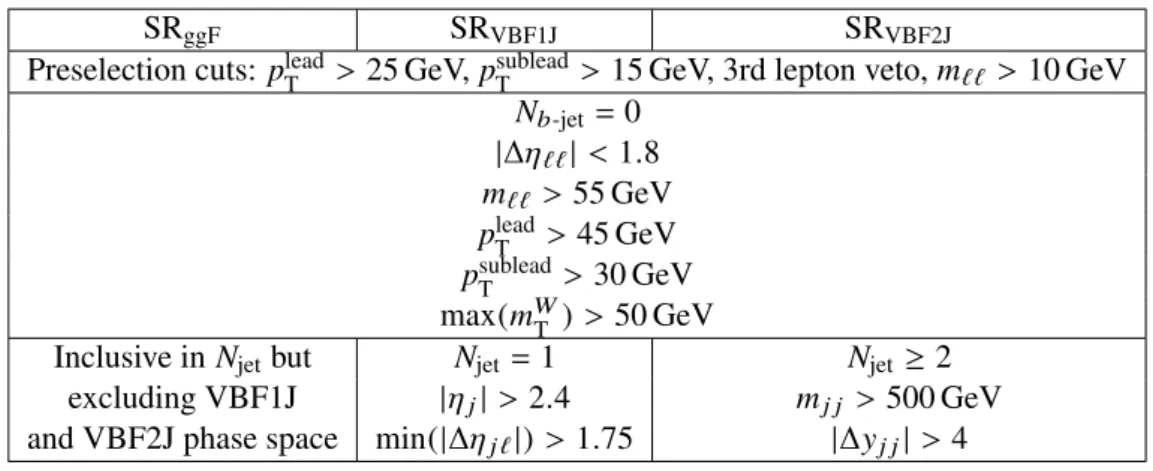
Table 1: Selection cuts used in the ggF and VBF signal regions. The VBF1J phase space corresponds toNjet =1,
|ηj| > 2.4 and min(|∆ηj`|) > 1.75 while the VBF2J phase space corresponds toNjet ≥ 2,mj j > 500 GeV and
|∆yj j|>4. These sets of cuts ensure the orthogonality with respect to the SRggFcategory.
SR
ggFSR
VBF1JSR
VBF2JPreselection cuts: p
Tlead>25 GeV, p
subleadT >15 GeV, 3rd lepton veto, m
`` >10 GeV N
b-jet=0
|∆η``| <
1.8 m
`` >55 GeV p
leadT >45 GeV p
subleadT >30 GeV max(m
WT)
>50 GeV
Inclusive in N
jetbut N
jet =1 N
jet ≥2
excluding VBF1J
|ηj|>2.4 m
j j >500 GeV and VBF2J phase space min(|∆η
j`|) >1.75
|∆yj j| >4
6 Background estimation
The major backgrounds for the eνµν analysis arise from top-quark and W W production processes, with
additional contributions from W/Z
+jets and the diboson processesW Z, W
γ,W
γ∗, and Z Z. Since the
discriminating variable used for this search is the transverse mass, m
T, both the background normal- isations and the shapes of the background m
Tdistributions must be estimated. The m
Tshapes of the backgrounds are modelled using simulated events while the top-quark and W W background normalisa- tions are determined from a combined fit to the events in the signal and control regions as described in Section 8. The control regions (Table 2) are defined by criteria similar to those used for the signal re- gion, but with some requirements loosened or reversed to obtain signal-depleted samples, enriched in the relevant backgrounds.
The following subsections describe in more detail the methods used to estimate the most important back- grounds, namely top-quark, W W, and W
+jets. The Drell-Yan and non-W W diboson backgrounds are small, and their predictions are obtained from simulation. The small background from the m
h'125 GeV Higgs boson resonance and its off-shell component is included and its interference with the continuum W W background is taken into account.
6.1 t t ¯ and single-top background
Top-quark events can be produced as a t¯ t pair or as a single top quark in association with a W boson or a quark of another flavour. In this analysis, contributions from t¯ t and single-top events are estimated together, with their relative contributions determined by their predicted cross sections and by their relative acceptances, reconstruction efficiencies, and trigger efficiencies obtained from MC simulation.
The top-quark background for the quasi-inclusive ggF category is determined in a control region (Top CR
ggF) where one tagged b-jet is required and all other selection cuts used in the signal region are ap- plied. The simulated leading lepton p
Tin the Top CR
ggFhas been found to have a slope decreasing with increasing p
Tlead, with respect to the data. The fitted slope corresponds to a linear function and has been used to correct for this mismodelling by reweighting the simulated top background events in the SR
ggFand in the ggF quasi-inclusive CRs.
The top-quark background control regions for the VBF categories (Top CR
VBF) have fewer data events, so they are merged together. In addition, the cuts on p
leadTand p
subleadTare relaxed to 25 and 15 GeV, respect- ively, and the cuts on
|∆η``|,m
``and max(m
WT) are removed. In this control region, no mismodelling on p
Tleadhas been observed.
Table 2: Summary of all the selection cuts used in the ggF and VBFW Wand top-quark control regions (CRs). The VBF1J and VBF2J phase spaces are defined as in the caption of Table1.
W W CR
ggFTop CR
ggFW W CR
VBF1JTop CR
VBFPreselection cuts: p
Tlead>25 GeV, p
subleadT >15 GeV, 3rd lepton veto, m
`` >10 GeV N
b-jet =0 N
b-jet=1 N
b-jet=0 N
b-jet ≥1
|∆η``| >
1.8
|∆η``| <1.8 (
|∆η``| >1.8 or –
m
`` >55 GeV m
``<55 GeV) –
p
Tlead>45 GeV p
Tlead>25 GeV p
leadT >25 GeV p
subleadT >30 GeV p
subleadT >25 GeV p
Tsublead>15 GeV
max(m
WT)
>50 GeV – –
Excluding VBF VBF1J VBF1J or VBF2J
VBF1J and VBF2J phase space phase space
Events / 20 GeV
1 10 102
103
104
105
106
data Other VV
ggF NWA 300 Top ggF NWA 700 W+jets
WW Z+jets
stat)
⊕ SM(sys
Preliminary ATLAS
= 13 TeV, 13.2 fb-1
s
ggF Top CR ν µ ν
→ e
→WW H
[GeV]
mT
0 200 400 600 800 1000 1200
Data / SM 0.5 1 1.5
(a) Top CRggF
Events / 50 GeV
1 10 102
103
104
105
data Other VV
VBF NWA 300 Top VBF NWA 700 W+jets
WW Z+jets
stat)
⊕ SM(sys
Preliminary ATLAS
= 13 TeV, 13.2 fb-1
s
VBF Top CR ν µ ν
→ e
→WW H
[GeV]
mT
0 200 400 600 800 1000 1200
Data / SM 0.5 1 1.5
(b) Top CRVBF
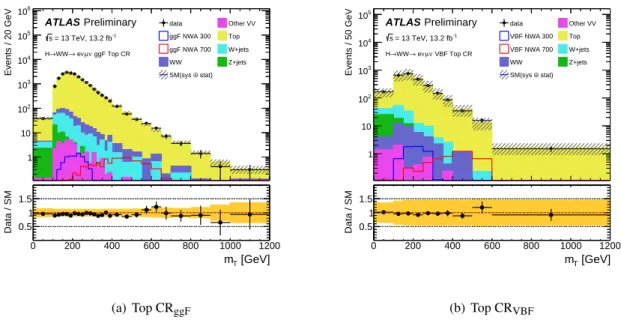
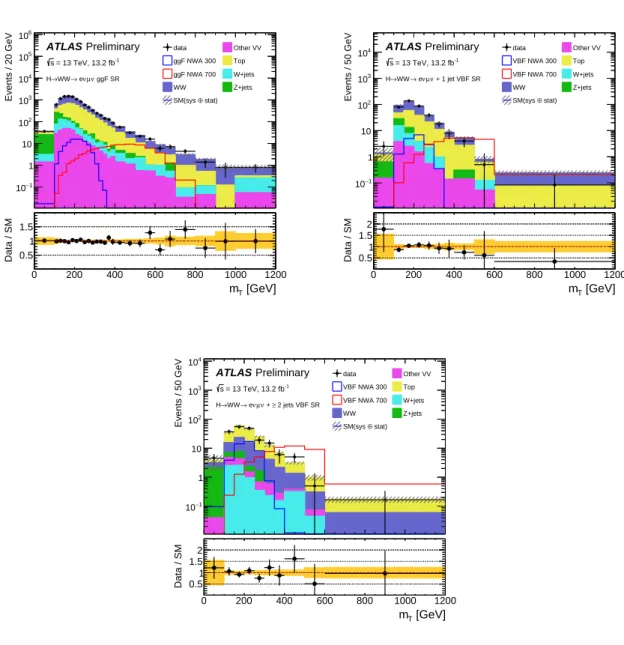
Figure 1: Transverse mass distribution in the ggF and VBF top-quark control regions. In each figure, the last bin contains the overflow. The hatched band in the upper panel and the shaded band in the lower panel show the statistical, experimental and theoretical uncertainties on the predictions. The different backgrounds are scaled using the normalisation factors obtained from the simultaneous fit to all signal and control regions. The signal event yield, normalised toσH×BR(H → W W)=1 pb, is shown for masses of 300 and 700 GeV, with NWA lineshape.
The post-fit normalisation factors from a simultaneous fit to all signal and control regions (Sec. 8) are 0.95
+−0.080.09and 0.96
+−0.140.13in the ggF and the VBF control regions, respectively, where the uncertainty quoted includes the full statistical and systematic error. The post-fit purity of the top-quark background in the control region is 87% in the ggF category and 81% in the VBF category.
Figure 1 shows the m
Tdistributions in the ggF and VBF top-quark CRs. The di
fferent background components have been scaled according to the event yields obtained from a simultaneous fit to the data in all the SRs and CRs. The fit uses only the integrated event yields in the control regions. The shape of the distributions, unused in the fit, is compared between data and MC expectations and found to be in good agreement. The contribution shapes from 300 and 700 GeV NWA Higgs signals are also shown.
The signal is arbitrarily normalised by scaling to
σH ×BR(H
→W W )
=1 pb. The ggF contribution of the SM Higgs boson is included in the W W component. The VBF contribution is negligibly small and is not shown in this and following figures.
6.2 W W background
The W W CR for the quasi-inclusive ggF category (W W CR
ggF) uses the same selection cuts as for the SR
except for
|∆η``|which is reversed so that the CR and SR are orthogonal. The selection cuts are shown
in Table 2. The post-fit normalisation factor obtained from a simultaneous fit to all signal and control
regions for the W W contributions in the quasi-inclusive ggF analysis is 1.3
+−0.10.2, where the uncertainty
quoted includes the full statistical and systematic error. The post-fit purity of the W W background in the
control region is 52%.
Events / 20 GeV
1 10 102
103
104
105
data Other VV
ggF NWA 300 Top ggF NWA 700 W+jets
WW Z+jets
stat)
⊕ SM(sys
Preliminary ATLAS
= 13 TeV, 13.2 fb-1
s
ggF WW CR ν µ ν
→ e
→WW H
[GeV]
mT
0 200 400 600 800 1000 1200
Data / SM 0.5 1 1.5
(a) W WCRggF
Events / 50 GeV
−1
10 1 10 102
103
104
data Other VV
VBF NWA 300 Top VBF NWA 700 W+jets
WW Z+jets
stat)
⊕ SM(sys
Preliminary ATLAS
= 13 TeV, 13.2 fb-1
s
+ 1 jet VBF WW CR ν
µ ν
→ e
→WW H
[GeV]
mT
0 200 400 600 800 1000 1200
Data / SM 0.5 1 1.5 2
(b)W WCRVBF1J
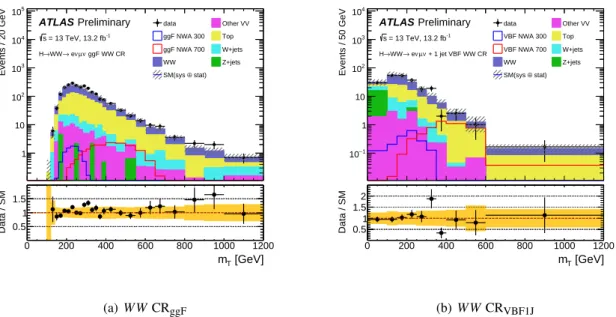
Figure 2: Transverse mass distribution in the quasi-inclusive ggF andNjet =1 VBFW W control regions. In each figure, the last bin contains the overflow. The hatched band in the upper panel and the shaded band in the lower panel show the statistical, experimental and theoretical uncertainties on the predictions. The different backgrounds are scaled using the normalisation factors obtained from the simultaneous fit to all signal and control regions. The signal event yield, normalised toσH ×BR(H → W W) =1 pb, is shown for masses of 300 and 700 GeV, with NWA lineshape.
The W W CR for the N
jet=1 VBF category (W W CR
VBF1J) uses slightly different selection cuts (shown in Table 2) than in the SR in order to increase the number of data events of the CR. The normalisation factor obtained from a simultaneous fit of all signal and control regions for the W W contribution in the W W CR
VBF1Jis 1.2
+−0.30.5, where the uncertainty quoted includes the full statistical and systematic error.
The post-fit purity of the W W background in the control region is 45%.
The W W contribution in the N
jet ≥2 VBF category is small and its prediction is taken from simulation, because it is di
fficult to isolate a kinematic region with a su
fficient number of W W events and a small contamination from the top-quark background. Furthermore, the W W simulation in this category relies on a different matrix-element calculation to that in the VBF N
jet =1 category, whereas in the top-quark processes the simulation models both categories with the same matrix-element calculation.
Figure 2 shows the m
Tdistributions in the W W CR
ggFand CR
VBF1J. The di
fferent backgrounds are scaled according to the event yields obtained from a simultaneous fit to the data in all the SRs and CRs. As with the top-quark control regions, only the integrated event yields of the W W control regions are used in the fit.
6.3 W + jets background
The W
+jets background contribution is estimated using the fake factor based data-driven method de-
veloped for the SM H
→W W analysis [30]. The estimation uses a sample of events satisfying all
selection criteria but in which one of the two lepton candidates satisfies the identification and isolation
criteria used to define the signal samples (these lepton candidates are denoted as “fully identified”), and the other lepton fails to meet these criteria and satisfies a less restrictive selection and is denoted as an
“anti-identified” (anti-id) lepton. From this data sample the non-W
+jets contribution is subtracted based on MC predictions. The W
+jet purity of the samples is 55%, 64% and 38% for the quasi-inclusive ggF, N
jet=1 and N
jet ≥2 VBF categories, respectively.
The W
+jets contamination in the signal region is determined by scaling the number of events in the selected data sample by an extrapolation factor (fake factor), which is measured in a data sample of di-jets events. The fake factor is the ratio of the number of fully identified leptons to the number of anti- identified leptons, measured in bins of anti-identified lepton p
Tand
η. The systematic errors associatedwith the fake factor evaluation are described in Section 7.1.
7 Systematic uncertainties
In this section, the systematic uncertainties affecting the analysis are described, including experimental and theoretical uncertainties on the backgrounds and the signal.
7.1 Experimental systematics
The dominant sources of experimental uncertainties on the signal and background yields are the jet en- ergy scale and resolution (Jet), and the b-tagging e
fficiency (b-tag). Other systematic uncertainties such as those associated with trigger e
fficiencies, lepton reconstruction and identification e
fficiencies, lepton momentum scales and resolutions, missing transverse momentum (MET) reconstruction and the jet ver- tex tagger (JVT), are considered when evaluating systematic effects on the shape or normalisation of the background estimation, as well as the shape and e
fficiency of the signal yield. The systematic e
ffects due to lepton identification efficiencies, momentum and scale resolutions, are found to be approximately 1%.
All experimental uncertainties are treated by varying the quantity subject to a particular uncertainty and then re-running the full analysis.
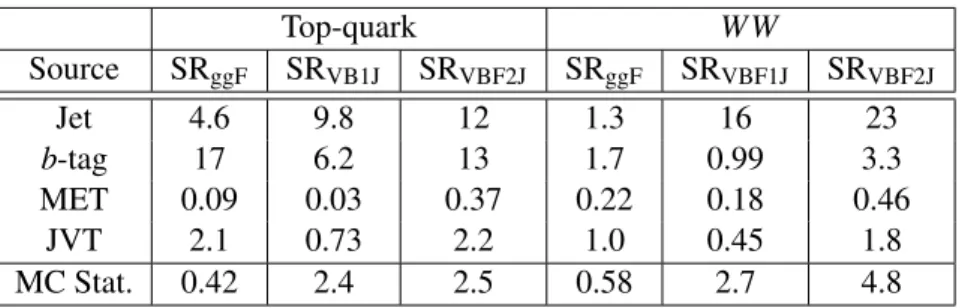
The impact of the most relevant experimental systematic uncertainties is summarised in Table 3, where the maximum change in yield for the up and down variations, in the various signal regions, is shown for the two main backgrounds, i.e. the top-quark and W W background. The dominant sources of systematic uncertainty are the modelling of b-tagging and the jet energy measurements.
Table 3: Relative impact (in %) of the experimental uncertainties on the event yields in the signal regions, for the main background processes. The maximum change in yield for the up and down variations is shown.
Top-quark W W
Source SR
ggFSR
VB1JSR
VBF2JSR
ggFSR
VBF1JSR
VBF2JJet 4.6 9.8 12 1.3 16 23
b-tag 17 6.2 13 1.7 0.99 3.3
MET 0.09 0.03 0.37 0.22 0.18 0.46
JVT 2.1 0.73 2.2 1.0 0.45 1.8
MC Stat. 0.42 2.4 2.5 0.58 2.7 4.8
The data-driven fake factor method used to evaluate the W
+jets background is subject to several sources of systematic uncertainty. Electroweak processes contribute significantly to the fake factor calculation at high lepton p
Tand uncertainties associated to this number are accounted for by varying the subtraction following the prescription outlined in Ref. [30] and taking the variation on the event yield in the signal region as an additional source of uncertainty. Moreover, the method assumes that the fake factors of the di-jet and W
+jets samples are equal. Di
fferences between fake factors calculated with di-jet samples and Z
+jets samples (similar in jet flavour composition to the W
+jets background) in data, as well as di
ffer- ences between fake factors evaluated with W
+jets andZ
+jets MC samples are included in the samplecomposition uncertainty. Finally, statistical uncertainties accounting for di
fferences among data and MC sample sizes used to evaluate fake factors are taken as additional sources of systematic uncertainty. The overall systematic uncertainty on the W
+jets background is found to be approximately 35% for each ofthe three signal event categories.
The preliminary uncertainty on the combined 2015 and 2016 integrated luminosity is 2.9%. It is derived, following a methodology similar to that detailed in Refs. [31] and [32], from a preliminary calibration of the luminosity scale using x
−ybeam-separation scans performed in August 2015 and May 2016.
7.2 Theory uncertainties on the backgrounds
For the backgrounds normalised using control regions, the theoretical uncertainties arise from the use of simulations of the background adopted in the extrapolation from the control region to the signal region.
For the top-quark and W W backgrounds, theoretical uncertainties on the extrapolation are evaluated ac- cording to the prescription of Ref. [33]. The uncertainties include the impact of missing higher-order corrections, PDF variations and other MC modelling.
For the top background, the relative uncertainties on the event yields range from a few percent in the quasi-inclusive ggF category to 17% and 48% in the N
jet =1 and
≥2 VBF categories, respectively. The latter two uncertainties are obtained when comparing the nominal P
owheg+H
erwiggenerated samples with the ones from an alternative generator:
aMC@NLO+Herwig. The aMC@NLO generator wheninterfaced with H
erwigis known to have a difference in the rapidity distribution of the jets with respect to P
owheg+H
erwigwhich a
ffects the VBF selection and is responsible for the large uncertainty. In the ggF quasi-inclusive category, an additional shape systematic uncertainty has been applied, corresponding to a
±50% variation of the top background leading lepton
p
Treweighting.
Similarly for the W W background, the relative uncertainties on the event yields range from a few per- cent in the quasi-inclusive ggF category to 35% and 48% in the N
jet =1 and
≥2 VBF categories, respectively. The latter uncertainties are due to the generator and parton shower modelling comparison between the nominal S
herpa2.1.1 sample with two alternative samples generated with P
owheg +P
ythiaand Powheg+Herwig. This uncertainty is large as there are large modelling differences among these gen- erators for the distributions of the missing energy and the forward jets. The impact on the final result of the uncertainties on W W and top-quark production is small because the systematic variations in the control regions and the corresponding signal regions are similar.
For backgrounds normalised to the theoretical prediction without the use of a control region, the same
prescription is followed for the acceptance uncertainty, and uncertainties on the predicted inclusive cross
sections also apply.
For the dominant background process q q ¯
→W W, in addition to the scale uncertainties described above, the impact of NLO EW corrections as a function of m
Tin the quasi-inclusive ggF SR and CR has been checked using a calculation performed by the authors of Ref. [34]. The m
Tdependencies in the SR and CR are di
fferent and in opposite directions. Given that the relative NNLO QCD corrections between the signal and control regions are not known, but the NNLO QCD effects may compensate some of the NLO EW e
ffects [35], the full size of the NLO EW corrections is used to estimate the normalisation and shape uncertainties. The normalisation uncertainty is about 3%, while the shape uncertainty reaches
−20% atm
T '1 TeV.
The
gg →(h
∗)
→W W process, where the SM 125 GeV Higgs boson is o
ff-shell, is modelled at leading order with the Sherpa generator with a k -factor of 1.7 that is used to account for higher order cross-section corrections with an uncertainty of 60%, following the studies in Refs. [36–39].
The theoretical uncertainties on the m
Tshape of top-quark and W W background have also been con- sidered. The most significant among these are the generator modelling, the parton shower modelling, the renormalisation scale and the NLO EW systematics uncertainty.
7.3 Theory uncertainties on the signal
The theoretical uncertainties on the signal production cross section include uncertainties due to the choice of QCD renormalisation and factorisation scales, the PDF model used to evaluate the cross section and acceptance, and the underlying event and parton shower (PS) models.
Uncertainties due to missing higher orders in QCD are evaluated in each category, with migrations estim- ated using a method based on that of Stewart and Tackmann [40]. The uncertainties within the categories range from 10% to 90%, with the largest uncertainties at a resonance mass of 3 TeV.
Within a given event category, the scale variations also affect the acceptance of the analysis. These residual scale uncertainties are however relatively small. They have also little dependence on the signal mass and therefore a flat uncertainty is quoted. For the ggF (VBF) signal, the uncertainties are 0.08%
(4.2%), 0.40% (3.7%) and 0.71% (6.8%) for the quasi-inclusive ggF, N
jet=1 and N
jet≥2 VBF category, respectively.
The PDF uncertainties are determined by recalculating the weights of all events passing the full selection requirements. This reweighting takes the 52 eigenvector variations of the default PDF set as well as the MSTW2008nlo68cl and NNPDF3.0 PDF sets into account. The envelope of the quadrature sum of appropriate eigenvector variations and the comparison of the nominal set with the others gives the final uncertainty on the selection efficiencies, following the recommendations of [11]. These uncertainties depend only mildly on m
H, therefore a flat uncertainty has been used. For the ggF (VBF) signal, the uncertainties are 0.53% (3.2%), 3.4% (3.4%) and 2.3% (1.9%) for the quasi-inclusive ggF, N
jet =1 and N
jet ≥2 VBF category, respectively.
The PS and underlying event uncertainties are derived by shifting independently, up or down, the P
ythiainternal parameters that are associated with final state radiation (FSR) or multiple parton interactions (MPI) to study separately their influence on the selection e
fficiencies of the various signal mass points.
The corresponding uncertainty bands, obtained after comparing both the up and down variations to the
sample with the nominal parameter settings, are then propagated to the mass distribution obtained at the
reconstruction level and used afterwards in the limit setting. For the ggF (VBF) signal, the uncertainties
are 0.58% (0.43%), 2.7% (0.72%) and 5.0% (0.99%) for the quasi-inclusive ggF, N
jet =1 and N
jet ≥2 VBF category, respectively.
Finally, the P
owhegsample only includes the production of up to one jet in association with a ggF in- duced Higgs-like resonance in the matrix element, while further jets are emulated by the parton shower generator, P
ythia. A more realistic modelling of higher jet-multiplicities is provided using the M
ad- G
raph5_
aMC@NLO [13] generator in order to simulate
gg →H events in association with up to two jets in the matrix element, where the overlap between identical final states generated at the matrix element and the parton shower stage are removed using the FxFx merging [41]. Thus the expected mismodelling in the N
jet≥2 VBF event category corresponding to the predictions of the P
owheggenerator is corrected by dedicated scale factors determined as the double ratios
k
=N
MG5_aMC@NLOSRVBF2J /NMG5_aMC@NLOSRggFN
PSRVBF2Jowheg /NPSR_ggF
owheg
,
(4)
in which N
MG5_aMC@NLOSRVBF2Jand N
MG5_aMC@NLOSRggFare the event yields in the N
jet ≥2 VBF and quasi-inclusive ggF event categories respectively (obtained using the event selection at generator level), as predicted by the M
adG
raph5_
aMC@NLO generator. The parameters N
PowhegSRVBF2Jand N
PowhegSRggFare the corresponding event yields as predicted by P
owheg+P
ythia. The same procedure has also been applied to the N
jet =1 VBF event category.
These scale factors are calculated for several hypothetical heavy-Higgs masses. The k -factors are largest, 1.5 (1), for the lowest mass values considered, and decrease with increasing resonance mass to a value of 1.0 (0.8) for the 3 TeV mass point, for the N
jet=1 (N
jet ≥2) VBF category.
8 Results
The statistical methodology used to obtain the results of the search is described in detail in Ref. [42]. A likelihood function
Lis defined using the m
Tdistributions in the signal regions of all event categories.
The likelihood is a product of Poisson functions over the bins of the m
Tdistributions in the signal regions and the total yields in the control regions. Each systematic uncertainty is parametrised by a corresponding nuisance parameter
θconstrained by a Gaussian function.
In the absence of a signal, the modified frequentist method known as CL
s[43], combined with the asymp- totic approximation [44], is used to compute 95% CL upper limits. The method uses a test statistic q
µwhich is a function of the signal strength
µ, defined as the ratio of the measuredσH ×BR(H
→W W) to that of the prediction. The cross-section used to define
µ=1 for the signal process has been fixed to 1 pb, which includes the branching ratio to two W bosons, but the final result does not depend on this assumed value. When the ggF (VBF) signal hypothesis is tested, the VBF (ggF) signal is not included in the definition of
µ. The test statistic is defined as:q
µ =−2 ln
* ,L
(
µ; ˆθµ)
L( ˆ
µ; ˆθ) +-
.
(5)
The quantities ˆ
µand ˆ
θare values of
µand
θ, respectively, that unconditionally maximiseL. The numer-ator depends on the values ˆ
θµthat maximise
Lfor a given value of
µ.The m
Tdistributions in the signal regions are divided into 26 (10) bins for the ggF quasi-inclusive (VBF N
jet =1 and
≥2) category. The bins are of variable widths to reflect the increasing width of the m
Tdistribution of the expected signal with increasing mass, while keeping the statistical precision of the background contributions in each bin su
fficiently high.
Limits are obtained separately for ggF and VBF production for the NWA signal hypothesis, and only for ggF in the LWA case.
To derive the expected limits on the ggF (VBF) production mode, the VBF (ggF) production cross section is set to zero, so that the expected limits correspond to the background-only hypothesis. To derive the observed limits on the ggF (VBF) production mode, the VBF (ggF) production cross section is treated as a nuisance parameter in the fit and profiled using a flat prior, in the same way as treating the normalisa- tion factors of the di
fferent backgrounds. This approach avoids making any assumption on the presence or absence of the signal in other production modes, by using the signal regions themselves to set the normalisation of the production mode not being tested.
Tables 4 and 5 show the number of events predicted and observed in the signal region and the control regions, in the quasi-inclusive ggF, VBF N
jet =1 and
≥2 categories. These are obtained from simul- taneous fit to the data in the SRs and the CRs. The observed yields are consistent with the background prediction.
Table 4: Event yields in the signal and control regions for the ggF quasi-inclusive category. The predicted back- ground yields and uncertainties are calculated after the simultaneous fit to the data in the SRs and the CRs. The statistical and systematic uncertainties are combined. “VV” represents non-W W weak diboson backgrounds. Total errors are quoted on the background.
SR
ggFTop CR
ggFW W CR
ggFW W 5300
±400 430
±90 1430
±120 Top-quark 4200
±400 20560
±210 900
±100 Z
/γ*557
±25 46
±12 10.7
±1.0 W
+jets 450
±120 260
±80 105
±30
VV 323
±12 37
±4 88.5
±3.4
Backgrounds 10790
±110 21330
±180 2530
±40
Data 10718 21333 2589
The m
Tdistributions of SR
ggF, SR
VBF1Jand SR
VBF2Jare shown in Fig. 3.
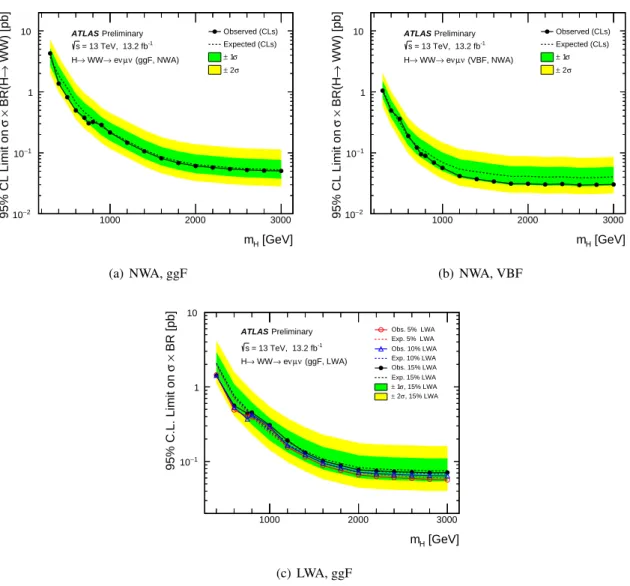
Figure 4 shows the 95% CL upper limits on
σH ×BR(H
→W W) as a function of m
Hfor a Higgs boson in the NWA and LWA scenarios in the mass range 300 GeV
≤m
H ≤3 TeV and 400 GeV
≤m
H ≤3 TeV, respectively. The limits are shown separately for ggF and VBF productions in the NWA case.
Values above 4.3 pb (1.4 pb) at m
H =300 GeV (400 GeV) and above 0.051 pb (0.071 pb) at 3 TeV are excluded at 95% CL by the ggF quasi-inclusive NWA (LWA 15%) analysis. For the VBF NWA case, the upper exclusion limit ranges between 1.1 pb at m
H =300 GeV to 0.03 pb at 3 TeV.
Limits are consistent with those expected in the absence of a signal over the investigated mass range.
Events / 20 GeV
−1
10 1 10 102
103
104
105
106
data Other VV
ggF NWA 300 Top ggF NWA 700 W+jets
WW Z+jets
stat)
⊕ SM(sys
Preliminary ATLAS
= 13 TeV, 13.2 fb-1
s
ggF SR ν µ ν
→ e
→WW H
[GeV]
mT
0 200 400 600 800 1000 1200
Data / SM 0.5 1 1.5
Events / 50 GeV
−1
10 1 10 102
103
104 data Other VV
VBF NWA 300 Top VBF NWA 700 W+jets
WW Z+jets
stat)
⊕ SM(sys
Preliminary ATLAS
= 13 TeV, 13.2 fb-1
s
+ 1 jet VBF SR ν µ ν
→ e
→WW H
[GeV]
mT
0 200 400 600 800 1000 1200
Data / SM 0.5 1 1.5 2
Events / 50 GeV
−1
10 1 10 102
103
104
data Other VV
VBF NWA 300 Top VBF NWA 700 W+jets
WW Z+jets
stat)
⊕ SM(sys
Preliminary ATLAS
= 13 TeV, 13.2 fb-1
s
2 jets VBF SR
≥ ν + µ ν
→ e
→WW H
[GeV]
mT
0 200 400 600 800 1000 1200
Data / SM 0.5 1 1.5 2
Figure 3: Post-fitted distributions of the transverse massmTin the SRggF(top left), SRVBF1J(top right) and SRVBF2J
(bottom) categories except for the signal event yeild which is normalised toσH ×BR(H → W W) =1 pb and is shown for masses of 300 and 700 GeV, with NWA lineshape. The error band in the lower panel shows the total uncertainty of the fit.
[GeV]
mH
1000 2000 3000
WW) [pb]→ BR(H×σ 95% CL Limit on 2−10
−1
10 1
10 Observed (CLs)
Expected (CLs) σ
± 1 σ
± 2 (ggF, NWA) ν µ ν
→ e
→ WW H
Preliminary ATLAS
= 13 TeV, 13.2 fb-1
s
(a) NWA, ggF
[GeV]
mH
1000 2000 3000
WW) [pb]→ BR(H×σ 95% CL Limit on 2−10
−1
10 1
10 Observed (CLs)
Expected (CLs) σ
± 1 σ
± 2 (VBF, NWA) ν µ ν
→ e
→ WW H
Preliminary ATLAS
= 13 TeV, 13.2 fb-1
s
(b) NWA, VBF
[GeV]
mH
1000 2000 3000
BR [pb]×σ 95% C.L. Limit on
−1
10 1 10
Obs. 5% LWA Exp. 5% LWA Obs. 10% LWA Exp. 10% LWA Obs. 15% LWA Exp. 15% LWA , 15% LWA σ
± 1 , 15% LWA σ
± 2 (ggF, LWA) ν µ ν
→ e
→ WW H
Preliminary ATLAS
= 13 TeV, 13.2 fb-1
s
(c) LWA, ggF
Figure 4: 95% CL upper limits on the Higgs production cross section times branching ratioσ×BR(H → W W) in theeνµνanalysis, for signals with narrow-width (ggF or VBF) in the top row and the 5%, 10% and 15% width lineshapes (ggF only) in the bottom. The green and yellow bands show the±1σ and±2σ uncertainties on the expected limit.
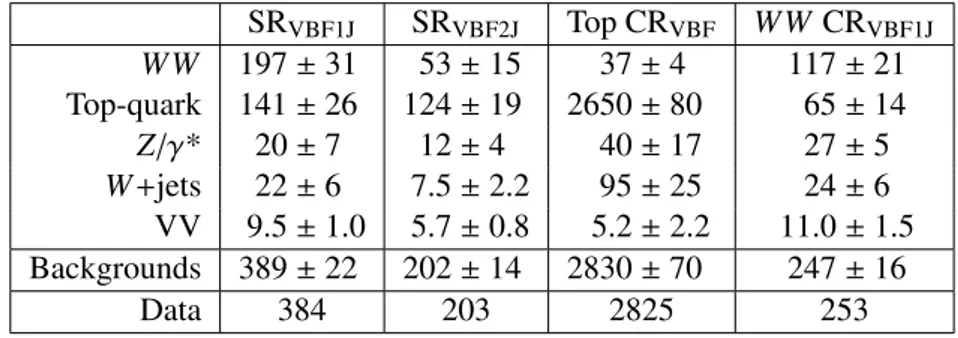
Table 5: Event yields in the signal and control regions for the VBF Njet = 1 and≥ 2 categories. The predicted background yields and uncertainties are calculated after the simultaneous fit to the data in the SRs and the CRs.
The statistical and systematic uncertainties are combined. “V V” represents non-W W weak diboson backgrounds.
Total errors are quoted on the background.
SR
VBF1JSR
VBF2JTop CR
VBFW W CR
VBF1JW W 197
±31 53
±15 37
±4 117
±21 Top-quark 141
±26 124
±19 2650
±80 65
±14 Z
/γ* 20
±7 12
±4 40
±17 27
±5 W
+jets22
±6 7.5
±2.2 95
±25 24
±6 VV 9.5
±1.0 5.7
±0.8 5.2
±2.2 11.0
±1.5 Backgrounds 389
±22 202
±14 2830
±70 247
±16
Data 384 203 2825 253
9 Conclusion
A search for a high-mass Higgs boson in the eνµν channel by the ATLAS experiment at the LHC is presented. The search uses proton–proton collision data at a centre-of-mass energy of 13 TeV corres- ponding to an integrated luminosity of 13.2 fb
−1. No significant excess of events beyond the Standard Model background prediction is found in the mass range between 300 GeV and 3 TeV. Upper limits are set on the product of the production cross section and the H
→W W branching ratio in two scenarios:
a high-mass Higgs boson with a narrow width, and one with intermediate widths (of 5, 10, 15% of the
heavy Higgs boson mass). Values above 4.3 pb (1.4 pb) at m
H =300 GeV (400 GeV) and above 0.051 pb
(0.071 pb) at 3 TeV are excluded at 95% CL by the ggF quasi-inclusive NWA (LWA 15%) analysis. For
the VBF NWA case, the upper exclusion limit ranges between 1.1 pb at m
H =300 GeV to 0.03 pb at
3 TeV.
References
[1] ATLAS Collaboration, Observation of a new particle in the search for the Standard Model Higgs boson with the ATLAS detector at the LHC, Phys. Lett.
B716(2012) 1,
arXiv: 1207.7214 [hep-ex].
[2] CMS Collaboration,
Observation of a new boson at a mass of 125 GeV with the CMS experiment at the LHC, Phys. Lett.
B716(2012) 30, arXiv: 1207.7235 [hep-ex].
[3] ATLAS Collaboration, Measurements of the Higgs boson production and decay rates and coupling strengths using pp collision data at
√s
=7 and 8 TeV in the ATLAS experiment, Eur. Phys. J.
C76(2016) 6, arXiv: 1507.04548 [hep-ex].
[4] CMS Collaboration,
Precise determination of the mass of the Higgs boson and tests of compatibility of its couplings with the standard model predictions using proton collisions at 7 and 8 TeV,
Eur. Phys. J.
C75(2014) 212, arXiv: 1412.8662 [hep-ex].
[5] ATLAS Collaboration, Constraints on new phenomena via Higgs boson couplings and invisible decays with the ATLAS detector, JHEP
11(2015) 206, arXiv: 1509.00672 [hep-ex].
[6] D. Lopez-Val and T. Robens,
∆R and the W –boson mass in the Singlet Extension of the Standard Model,