ATLAS-CONF-2016-014 04/07/2017
ATLAS NOTE
ATLAS-CONF-2016-014
Updated 3rd July 2017
to add missing description of selection criteria based onEmiss
T andmW
T
Search for heavy particles decaying to pairs of highly-boosted top quarks using lepton-plus-jets events in proton–proton collisions at √
s = 13 TeV with the ATLAS detector
The ATLAS Collaboration
Abstract
A search for new heavy particles that decay into top-antitop quark pairs (t¯t) is performed using data collected by the ATLAS detector at the Large Hadron Collider from proton-proton collisions at a centre-of-mass energy of 13 TeV. The integrated luminosity of the data sample is 3.2fb−1. Events consistent with top-quark pair production are selected by requiring a single isolated charged lepton, missing transverse momentum, and a high-transverse-momentum jet with substructure compatible with that of a hadronic top-quark decay. Jets identified as likely to containb-hadrons are used to further control the background from other Standard Model processes. The invariant mass spectrum of the candidate top-quark pairs is searched for excesses above the background expectation. No significant deviations from the Standard Model predictions are found. Exclusion limits are set on the production cross section times branching ratio for hypotheticalZ0bosons decaying intot¯t.
© 2017 CERN for the benefit of the ATLAS Collaboration.
Reproduction of this article or parts of it is allowed as specified in the CC-BY-4.0 license.
1. Introduction
Run 2 of the Large Hadron Collider (LHC) offers an unprecedented opportunity for new-physics searches.
The increase in proton-proton centre-of-mass energy (
√s) from 8 TeV to 13 TeV allows access to a new energy regime for production of heavy new particles. This note presents a search for such new particles in the top-antitop quark pair (t¯t) final state. The target signature is a peak (also referred to as aresonance) in the reconstructedt¯tinvariant mass (mrecot
t¯ ) spectrum. The search uses a data sample with an integrated luminosity of 3.2 fb−1collected by the ATLAS detector from
√s=13 TeV LHC proton-proton collisions in 2015.
The analysis selects events consistent withtt¯production followed by subsequent decay to thelepton-plus- jetstopology. In this topology the top and anti-top quark each decay to a bottom quark plus aW boson, t →W b, and one of theWbosons decays into an electron or muon plus neutrino while the other decays to quarks. This is an excellent signature for new physics searches. Approximately 30% oftt¯events decay this way and the non-tt¯background is far smaller than in the all-hadronic topology. The selection requires a single isolated electron or muon, large-missing transverse momentum, and hadronic jets. At least one of the jets must be identified as likely to contain ab-hadron (b-jet).
The mrecot¯t variable is reconstructed using the jets, charged-leptons and missing-transverse momentum in the events. The resulting spectrum is then examined for deviations from the Standard Model (SM) predictions. In the absence of significant deviations, the results are quantified by setting upper limits on the possible cross-section for the production of new heavy particles of narrow width (i.e. with width much smaller than the experimental resolution) that decay intot¯t. For comparison with other similar searches, these limits are translated to lower limits on the allowed mass within a particularbenchmark model. The chosen model is topcolour-assisted-technicolour [1, 2] that produces a Z0 boson, denoted Z0
TC2, which preferentially decays tott¯[3,4], and has a width of 1.2% (Γ/m= 1.2%). Previous searches by the ATLAS [5] and CMS [6] collaborations set lower limits on the allowed mass for such bosons of m(Z0
TC2) > 1.8 TeV andm(Z0
TC2) > 2.4 TeV, respectively. An additional Z0
TC2 parameter point with a 3% width is tested. A previous search by the ATLAS [5] collaboration sets lower limits on the allowed mass for such bosons ofm(Z0
TC2) >2.3 TeV.
The note is organised as follows. The ATLAS detector is introduced in Section2and the data samples used for the analysis are described in Section3. The event selection and reconstruction of thet¯tsystem are described in Section4and the estimation of background contributions using data is described in Section5.
The systematic uncertainties affecting the analysis are detailed in Section6and the expected bacgkround contributions are confronted with data in Section7. The results are presented in Section8and the paper is summarised in Section9.
2. ATLAS detector
The ATLAS detector [7] at the LHC covers nearly the entire solid angle around the collision point. It consists of an inner tracking detector surrounded by a thin superconducting solenoid, electromagnetic and hadronic calorimeters, and a muon spectrometer incorporating three large superconducting toroid
magnets. The inner-detector system (ID) is immersed in a 2 T axial magnetic field and provides charged particle tracking in the pseudorapidity1range|η| <2.5.
The high-granularity silicon pixel detector covers the vertex region and typically provides three measure- ments per track, the first hit being normally in the innermost layer. It is followed by the silicon microstrip tracker, which usually provides four measurements from eight strip layers. During the first LHC long shutdown, a new tracking layer, known as the Insertable B-Layer [8], was added close to the beam pipe. These silicon detectors are complemented by the transition radiation tracker (TRT), which enables radially-extended track reconstruction up to |η| = 2.0. The TRT also provides electron identification information based on the fraction of hits (typically 30 in total) above a higher energy deposit threshold corresponding to transition radiation.
The calorimeter system covers the pseudorapidity range|η| < 4.9. Within the region|η| < 3.2, electro- magnetic calorimetry is provided by barrel and endcap high-granularity lead/liquid-argon (LAr) electro- magnetic calorimeters, with an additional thin LAr presampler covering|η| < 1.8, to correct for energy loss in material upstream of the calorimeters. Hadronic calorimetry is provided by the steel/scintillating- tile calorimeter, segmented into three barrel structures within |η| < 1.7, and two copper/LAr hadronic endcap calorimeters. The solid angle coverage is completed with forward copper/LAr and tungsten/LAr calorimeter modules optimised for electromagnetic and hadronic measurements, respectively.
The muon spectrometer comprises separate trigger and high-precision tracking chambers measuring the deflection of muons in a magnetic field generated by superconducting air-core toroids. The precision chamber system covers the region|η| < 2.7 with three layers of monitored drift tubes, complemented by cathode strip chambers in the forward region, where the background is highest. The muon trigger system covers the range|η| < 2.4 with resistive plate chambers in the barrel, and thin gap chambers in the endcap regions.
A two-level trigger system [9,10] is used to select interesting events. The Level-1 trigger is implemented in hardware and uses a subset of detector information to reduce the event rate to a design value of at most 100 kHz. This is followed by a software-based trigger level which reduces the event rate to a maximum of around 1 kHz for offline storage.
3. Data samples
This search is performed using data recorded from
√s=13 TeV proton-proton collisions with the ATLAS detector in 2015. Only data recorded during stable beam conditions and with all relevant subdetector systems operational are used. The integrated luminosity of the data sample is 3.2 fb−1. Lepton-plus-jets events are collected using single-electron and single-muon triggers with transverse-momentum thresholds chosen such that the efficiency is uniform for leptons satisfying offline selections.
The most important background processes are SMt¯t production, production of aW boson or Z boson in association with additional jets (W/Z + jets), single-top quark production, multi-jet production and
1ATLAS uses a right-handed coordinate system with its origin at the nominal interaction point (IP) in the centre of the detector and thez-axis along the beam pipe. The x-axis points from the IP to the centre of the LHC ring, and the y-axis points upwards. Cylindrical coordinates(r, φ) are used in the transverse plane, φbeing the azimuthal angle around the z-axis.
The pseudorapidity is defined in terms of the polar angleθasη =−ln tan(θ/2). Angular distance is measured in units of
∆R≡ q
(∆η)2+(∆φ)2.
diboson production. Simulated Monte Carlo (MC) data samples are used for signal processes, as well as for background processes that produce jets and prompt leptons. The MC samples are employed to develop the event selection, provide SM background estimates, and evaluate signal efficiencies. The multi-jet background is evaluated directly from data as described in Section5.
For the generation of SM t¯t production [11], and single-top-quark production in the W t [12] and s- channel [13], the Powheg-Box v2 [14–16] generator with the CT10 [17,18] parton distribution function (PDF) set in the matrix element calculations is used. Overlap betweent¯tandW tproduction is treated within the diagram removal (DR) scheme [19]. Electroweakt-channel single top-quark events are generated using the Powheg-Box v1 generator [20]. This generator uses the four-flavour scheme for the next-to-leading- order (NLO) matrix elements calculations together with the four-flavour PDF set CT10f4. For this process, the top quarks are decayed using MadSpin [21] preserving all spin correlations. For all SM top- quark processes the parton shower, fragmentation, and the underlying event are simulated using Pythia v6.428 [22] with the CTEQ6L1 [23] PDF set and the corresponding Perugia 2012 tune (P2012) [24].
The top mass is set to 172.5 GeV. The EvtGen v1.2.0 program [25] is used to model the decays of heavy-flavour hadrons. For the generation oftt¯events, thehdampparameter, which controls the transverse momentum of the first additional emission beyond the Born configuration, is set to the mass of the top quark. The main effect of this is to regulate the high transverse momentum emission against which thet¯t system recoils. The top quark kinematics in all SMt¯tsamples were corrected to account for electroweak higher-order effects [26]. This correction is applied after generating the samples, by applying a weight that depends on the flavour and centre-of-mass energy of the initial partons, and the decay angle of the tops in the centre-of-mass frame of the initial partons. The value of the correction factor falls with the invariant mass of thet¯tsystem from 0.98 at a mass of 400 GeV to 0.87 at a mass of 3.5 TeV.
Samples ofW/Z + jets events are simulated using the Sherpa 2.1.1 [27] generator. Matrix elements are calculated for up to two partons at NLO in QCD and four partons at leading order (LO) using the Comix [28] and OpenLoops [29] matrix element generators and merged with the Sherpa parton shower [30] using the ME+PS@NLO prescription [31]. The CT10 PDF set is used in conjunction with dedicated parton shower tuning developed by the Sherpa authors. TheW/Z+ jets events are normalised to the next-to-next-to-leading-order (NNLO) cross sections [32].
Diboson (W W,W Z,Z Z) production processes with four charged leptons (4`), three charged leptons and one neutrino (3`+ν), two charged leptons and two neutrinos (2`+2ν), or one charged lepton and one neutrino plus jets (`νqq¯0) are also simulated using the Sherpa 2.1.1 generator. Matrix elements contain all diagrams with four electroweak vertices. They are calculated for zero (3`+ν,`νqq¯0) or up to one (4`, 2`+ 2ν) additional partons at NLO in QCD and up to 3 partons at LO using the Comix and OpenLoops matrix element generators and merged with the Sherpa parton shower using the ME+PS@NLO prescription.
The same PDF set and parton shower tuning as for theW/Z + jets events are used. The generator cross sections are used for sample normalisation in this case.
Production of a new heavy particle that decays tot¯twas modelled using theZ0→t¯tprocess from Pythia v8.165 [33] with the NNPDF2.3 LO [34] PDF set and the A14 [35] tune. This search uses topcolour- assisted technicolour Z0
TC2 [2–4] as a benchmark. This is a leptophobic boson, with couplings only to first- and third-generation quarks, referred to as Model IV in Ref. [3]. The properties of the boson are controlled by three parameters: cotθH, which controls the width and the production cross section, and f1 and f2, which are related to the coupling to up-type and down-type quarks, respectively. Here f1=1 and
f2 = 0, which maximises the fraction of Z0
TC2 that decay tot¯t. The parameter cotθH is tuned for each mass point such that the resonance has a width of 1.2% (or 3%) of its mass. To account for higher-order contributions to the cross section, the leading-order calculation is multiplied by a factor of 1.3 based on
calculations performed at NLO in QCD [36,37]. The interference of these signals with SM electroweak tt¯production [38] is neglected in this analysis.
The MC samples are processed through the full ATLAS detector simulation [39] based on Geant 4 [40] or through a faster simulation making use of parameterised showers in the calorimeters [41].
Additional simulated proton–proton collisions generated using Pythia v8.165 with the A2M tune [42]
and MSTW2008LO PDF set [43] are overlaid to simulate the effects of additional collisions from the same and nearby bunch crossings (pile-up). All simulated events are then processed using the same reconstruction algorithms and analysis chain as would be used for real data.
4. Event selection and reconstruction
This section describes the selection of events containing a single charged-lepton candidate, hadronic jets and large missing transverse momentum. The subsequent reconstruction of an observable using these physics objects that approximates the mass of thet¯tsystem is also described.
The event selection citeria are applied to the following physics objects:
Jets:three types of hadronic jets are used in this analysis:
Small-Rjets: are built from three-dimensional topological clusters [44], at the electromagnetic (EM) energy scale, using the anti-kt algorithm [45] with radius parameterR=0.4. They are required to have transverse momentum, pT, greater than 25 GeV and |η| < 2.5. These jets are calibrated using a correction that relates the reconstructed jet energy to the true jet energy when reconstructed from stable particles with a lifetime of at least 10 ps (excluding muons and neutrinos) [46].
Large-R jets: are built from three-dimensional topological clusters, calibrated with the local cluster weighting (LCW) procedure [44], using the anti-kt algorithm with radius parameter R = 1.0. In the LCW calibration procedure, corrections for the non-compensating response of the calorimeter and for the energy lost in dead-material and via out-of cluster leakage are applied to the cluster energy before applying the jet algorithm. The corrections are obtained from simulations of charged and neutral particles. These jets are furthertrimmed[47], which has been shown to mitigate the effects of pile-up [48]. In trimming, the constituents of a jet are reclustered into subjets according to thektalgorithm [49–51] with radius parameterRsub. Subjets with a transverse momentum smaller than a fraction fcutof the parent jet transverse momentum are then discarded. The surviving subjets are recombined to produce the final trimmed jet. Based on a study of sensitivity to pile-up, the trimming parameters used are Rsub = 0.2 and fcut = 0.05 [52]. The resultant jets are required to have pT greater than 300 GeV and|η| < 2.0. Large-Rjets likely to contain the decay products of a hadronically decaying top-quark are identified (top-tagged) using an algorithm [53] based on the invariant mass of the jet and the n-subjettiness ratio τ32 [54, 55]. This algorithm has efficiency of aproximately 80% for selecting top-quark jets withpT >300 GeV in simulated SMt¯tevents.
Track jets: are built from charged tracks using the anti-ktalgorithm with radius parameterR=0.2.
These jets must havepTgreater than 10 GeV and|η| <2.5 and at least two constituent tracks.
The charged tracks used to build the jets must themselves havepT > 0.4 GeV and |η| < 2.5, and pass quality requirements that test the number of hits used to reconstruct the track and
the matching to the hard scatter via the longitudinal impact parameter of the track [56]. Track jets likely to contain ab-hadron are identified (b-tagged) using the MV2c20algorithm [57].
Theb-tagging working point chosen has approximately 70% efficiency for jets containing a b-hadron in simulated SMt¯tevents.
Electron candidates: are reconstructed from an isolated electromagnetic calorimeter energy deposit matched to an inner detector track, within the fiducial region of transverse energyET >25 GeV and
|η| <2.47. Candidates within the transition region between the barrel and endcap electromagnetic calorimeters, 1.37 < |η| < 1.52, are removed. A tight likelihood-based requirement [58] is used to further suppress the background from multi-jet production. Electrons are required to be isolated using a requirement on the sum of trackpT in a variable-sized cone around the electron direction (excluding the track associated with the electron). The track isolation cone radius is given by the smaller of ∆R = 10 GeV/pT(e), where pT(e) is the pT of the electron, and ∆R = 0.2, i.e. a cone which increases in size at low pT up to a maximum of 0.2. To prevent double-counting of electron energy deposits as jets, the closest small-Rjet within∆R<0.2 of a reconstructed electron is removed. Finally, if the nearest small-R jet surviving this selection is within∆R < 0.4 of the electron, the electron is discarded, to ensure it is sufficiently separated from nearby jet activity.
Muon candidates: are reconstructed by combining tracks reconstructed in both the inner detector and muon spectrometer, and required to satisfypT > 25 GeV and|η| < 2.5. Muons are also required to be isolated, using the same track-based variable as for electrons, except that the maximum∆Rin this case is 0.3, with the selection criteria tuned to give similar efficiencies onZ → µ+µ−events.
To reduce the background contributions due to muons from heavy flavour decays inside jets, muons are removed if they are separated from the nearest jet by∆R < 0.04+10 GeV/pµ
T. However, if this jet has fewer than three associated tracks, the muon is kept and the jet is removed instead; this avoids an inefficiency for high-energy muons undergoing significant energy loss in the calorimeter.
Missing transverse momentum (Emiss
T ): is defined as the magnitude of E~miss
T : the negative of the global vector sumpTof all selected physics objects (electrons, muons, jets) as well as specific “soft terms” accounting for unclassified soft tracks and calorimeter clusters. In this way, the missing transverse momentum is adjusted to take into account the best calibration of the identified physics objects above [59].
Following the initial pre-selection by the triggers described in Section3, the event selection proceeds with the following steps:
1. Charged-lepton selection: Exactly one charged-lepton candidate (electron or muon) is required with a minimumpTof 30 GeV (for electrons) or 25 GeV (for muons). The lepton candidates must geometrically match candidates that triggered the event. Events containing a second charged lepton with a transervse momentum larger than 25 GeV are vetoed.
2. Leptonic-W selection: The event is required to have charged-lepton and missing transverse mo- mentum kinematics consistent with leptonic decay of aWboson. This is achieved by requiring that the event passes two criteria. Firstly, the Emiss
T is required to be greater than 20 GeV. Secondly, the transverse mass of the lepton and E~miss
T , mW
T = q
2plepton
T Emiss
T (1−cos∆φ(lepton,E~miss
T )), is required to satisfyEmiss
T +mW
T >60 GeV.
3. Selection of leptonic-top b-jet: Events are required to contain at least one small-R jet with
∆R(jet,lepton) < 1.5. If multiple jets satisfy this condition, the one with the highestpT is chosen
and subsequently referred to as theselected jet, jsel. It is identified with the expectedb-jet from the leptonic top-quark decay, although nob-tagging requirement is enforced on it.
4. Hadronic-top jet: Events are required to contain at least one large-Rjet passing the top-tagging requirements. The jet is further required to be well separated from the leptonic-top-quark by requiring it to have a distance in azimuthal angle to the charged-lepton∆φ(jet,lepton) >2.3 radians and∆φ(jet,jsel) > 1.5 . The highest-pT jet passing all of these requirements is referred to as the hadronic-top jet.
5. b-taggingthe event is required to contain at least oneb-tagged track jet.
The selection acceptance times efficiency including branching ratio for MC simulatedZ0 →t¯tevents is given in Figure1. For reference, the branching ratio fort¯tto electron- or muon-plus-jets is about 17% for each lepton flavour taking into account leptonic tau decays [60]. There are efficiency losses from both the large-radius jet requirements andb-tagging requirement. It can be seen that efficiency times acceptance is smaller fore+jets events than µ+jets for resonance masses above 1.5 TeV, due to the inefficiency of electron identification and overlap removal in an environment with highly-boosted top quarks.
[TeV]
t
mt
0 0.5 1 1.5 2 2.5 3 3.5 4 4.5 5
Efficiency [%]×Acceptance
0 1 2 3 4 5 6 7 8 9 10
e+jets +jets µ ATLAS Simulation Preliminary
= 13 TeV, 3.2 fb-1
s Z’
Figure 1: Acceptance times selection efficiency, including branching ratio, as a function of the top-antitop quark invariant massmtt¯immediately before top quark decay for simulated Z0→ t¯tevents. The dashed line shows the µ+jets selection and the solid line shows the e+jets selection.
Following event selection, an observablemreco
tt¯ is constructed from the physics objects to approximate the invariant mass of thet¯tsystem. The four-momentum of the hadronic-top jet is used as thehadronic-top candidate. Theleptonic-top candidateis constructed by summing the four-momenta of the charged lepton, the neutrino candidate andjsel. The neutrino candidate’s transverse momentum isE~miss
T . Thezcomponent of the neutrino candidate is estimated by assuming that neutrino and the lepton come from an on-shell W-boson decay, and applying aW mass constraint on the neutrino-lepton system [5]. The value ofmrecot
t¯
is then the mass of the summed four-vectors of the leptonic-top candidate and hadronic-top candidate.
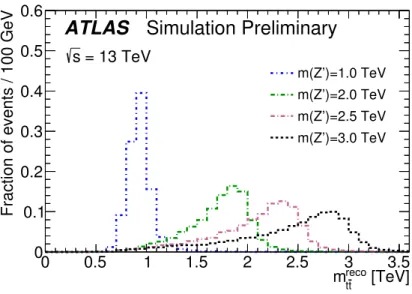
The resultingmrecot¯t distributions for several signal masses are shown in Figure2. For this figure, all events
satisfying the selection criteria are used. The low-mass tails arise from two effects: firstly, extra radiation from thet¯t system that is not included in the reconstruction can shift the reconstructed mass to lower values; secondly, before reconstruction the Breit–Wigner signal shape inmtt¯ has a tail at lower values due to the steep fall in parton luminosity with increasing partonic centre-of-mass energy. The former is particularly true for high-mass resonances, such as the benchmark processes used in this analysis, while the latter has a larger effect on broad resonances.
[TeV]
reco t
mt
0 0.5 1 1.5 2 2.5 3 3.5
Fraction of events / 100 GeV
0 0.1 0.2 0.3 0.4 0.5 0.6
m(Z’)=1.0 TeV m(Z’)=2.0 TeV m(Z’)=2.5 TeV m(Z’)=3.0 TeV
ATLAS Simulation Preliminary
= 13 TeV s
Figure 2: Reconstructed top quark pair invariant mass,mreco
t¯t , for simulatedZ0→tt¯events satisfying the selection.
TheZ0in the simulated samples used here has a width of 3% of its mass.
5. Estimation of background contributions using data
Data are used to estimate the magnitudes and uncertainties of two important background contributions:
W+jets and multi-jet production.
5.1. W+jets background
For theW+jets background, data are used to derive scale factors that are applied to correct the normalisation given by Sherpa MC simulations of this background. The scale factors are determined by comparing the measuredW boson charge asymmetry in data [61,62] with that predicted by the simulation. In order to decrease the statistical uncertainty on the scale factors, a relaxed set of selection criteria that does not not include ab-tagging requirement, and requires a large-Rjet to fail the top-tagging requirements, is used.
Any bias induced by relaxing the selection criteria is found to be negligible compared to the statistical uncertainty in the scale factor determination. The total number ofW+jets events in data,NW++NW−, is given by:
NW++NW− = rMC+1 rMC−1
!
(Dcorr+−Dcorr−), (1)
whererMCis the ratio given by MC simulation of the number ofW+jets events with a positively charged lepton to that with a negatively charged lepton and Dcorr+(−) is the number of observed events with a positively (negatively) charged lepton. Contributions toDcorr+(−)from charge-asymmetric processes such as single top, W Z andt¯t+W boson production are estimated from MC simulation and are subtracted.
Contributions from charge-symmetric processes such as t¯t production cancel in the difference on the right-hand side of eq. (1). A scale factor,CA, applied to the MC simulated samples ofW+ jets events, is then calculated as the ratio ofNW++NW−evaluated from data to that predicted from MC simulation. The values obtained forCAine+jets events and µ+jets events are 0.82±0.18 (stat.) and 0.73±0.12 (stat.), respectively.
5.2. Multi-jet background
The multi-jet background in events satisfying the selection criteria consists of events with a jet that is misreconstructed as a lepton or with a non-prompt lepton that satisfies the identification criteria. The normalisation, kinematic distributions, and statistical and systematic uncertainties associated with the multi-jet background are estimated from data using amatrix method[63,64].
The matrix method uses efficiencies for leptons produced by prompt and non-prompt sources. The efficiency f is defined as the probability that a non-prompt lepton from multi-jet production that satisfies a looser set of identification criteria2also satisfies the tight identification criteria. It is derived from data in control regions dominated by multi-jet events, with prompt-lepton contributions subtracted based on MC simulations. The efficiency is defined as the probability that a lepton from prompt sources (W or Z bosons) that satisfies the loose identification criteria also satisfies the tight identification criteria.
It is determined using SM MC samples with a mixture of processes similar to that in the signal region, corrected using data versus MC correction factors derived fromZ →``events.
The number of multi-jet background events satisfying the selection criteria is estimated using data events that satisfy all criteria, except that the loose lepton identification criteria are used. This sample contains prompt as well as non-prompt leptons.
The number of events with leptons satisfying the loose identification criteria,NLis defined as
NL = Nprompt+Nmulti-jet (2)
whereNpromptis the number of events with prompt leptons satisfying the loose identification criteria and Nmulti-jetis the number of events satisfying the loose identification criteria with leptons from other sources.
The number of events satisfying the tight identification criteria,NTis then
NT =×Nprompt+ f ×Nmulti-jet. (3)
Solving these two equations forNpromptandNmulti-jetgives the multi-jet contribution from events satisfying all the selection criteria.
Good shape modelling of the kinematic distributions is achieved by parameterising the efficiencies as functions of relevant kinematic variables, and validated in the multi-jet control regions.
2For electrons and muons this set of criteria have no isolation requirement.
6. Systematic Uncertainties
In this section, the systematic uncertainties that affect this search are detailed. These uncertainties can change the normalisation and shape of predictedmrecot
t¯ distributions for signal and backround.
The uncertainty on the integrated luminosity is 5%. It is derived, following a methodology similar to that detailed in Ref. [65], from a preliminary calibration of the luminosity scale using a pair of x − y beam-separation scans performed in June 2015.
The modelling of the electron and muon trigger efficiencies, identification efficiencies, energy scales and resolutions are studied using leptonic Z-boson decays in data and simulation at
√s = 13 TeV. Small corrections are applied to the simulation to better model the performance seen in data [66,67]. These corrections have associated uncertainties that are propagated to the estimated signal and background yields. The modelling of the isolation requirements made on electrons and muons is studied in 13 TeV data using Z-boson decays, and parameterised as functions of the leptonpT,η and the hadronic activity near the lepton. The isolation efficiencies are found to be generally well modelled, and the measurements are extrapolated to thet¯tenvironment to give uncertainties of 1% for both electrons and muons.
The small-R jet energy scale (JES) is varied in simulation according to the uncertainties derived from
√s=8 TeV simulation and in-situ calibration, and the uncertainties are extrapolated to
√s=13 TeV [68].
The uncertainties are evaluated using a simplified model with three orthogonal components which are then added in quadrature. The jet energy resolution uncertainty is assessed using
√s = 8 TeV data, and extrapolated to
√s = 13 TeV. The b-tagging uncertainties are determined from
√s = 8 TeV data, with some additional uncertainties to account for the presence of the new IBL detector and the extrapolation to
√s=13 TeV.
The large-Rjet energy and mass scales andτ32scale are varied in simulation according to the uncertainties derived from
√s = 8 TeV [69] simulation and in-situ calibration, and the uncertainties are extrapolated to
√s = 13 TeV [53]. The uncertainties on the jet mass and τ32 propagate into uncertainties on the top-tagging efficiency.
Several uncertainties are specific to the dominant SM t¯t background process. The tt¯ cross section forppcollisions at a centre-of-mass energy of
√s =13 TeV is σtt¯ =832+46−
52 pb for a top quark mass of 172.5 GeV. It has been calculated at next-to-next-to leading order (NNLO) in QCD including resummation of next-to-next-to-leading logarithmic (NNLL) soft gluon terms with top++2.0 [70–76]. The PDF and αS uncertainties were calculated using the PDF4LHC prescription [77] with the MSTW2008 68% CL NNLO [43, 78], CT10 NNLO [17, 18] and NNPDF2.3 5f FFN [34] PDF sets, added in quadrature to the scale uncertainty. In addition to this pure normalisation uncertainty, the following top-modelling uncertainties that affect the shape of the t¯t kinematic distributions as well as the normalisation are considered:
Choice of event generator: this is evaluated by comparing the prediction from a Powheg+Herwigt¯t sample with that from a MC@NLO+Herwig sample, and symmetrising the difference..
Choice of parton shower: this is evaluated by comparing the prediction from a Powheg+Pythia t¯t sample with that from a Powheg+Herwig sample, and symmetrising the difference.
Choice of parton distribution function: the uncertainties arising from the choice of PDF set are evaluated using the PDF4LHC15 PDF set [79]. The version that provides 30 separate uncertainty eigenvectors is used.
Modelling of extra QCD radiation: this is evaluated using Powheg+Pythia samples in which the renormalisation and factorisation scales and thehdampparameter are varied within ranges consistent with measurements oft¯tproduction in association with jets [80–82].
Electroweak corrections: the uncertainty on the electroweak corrections tot¯tproduction is 10% of their deviation from unity.
The normalisation of the single-top background is varied by±5.3%. This corresponds to the theoretical uncertainty on the dominantW t-channel contribution at approximate NNLO in QCD [83–85].
Systematic uncertainties on the multi-jet background estimation are evaluated using various definitions of multi-jet control regions that result in slightly different estimations of f. Systematic uncertainties associ- ated with object reconstruction and MC simulation are also considered, resulting in a total normalisation uncertainty of 50%.
7. Comparison of data with expected background contributions
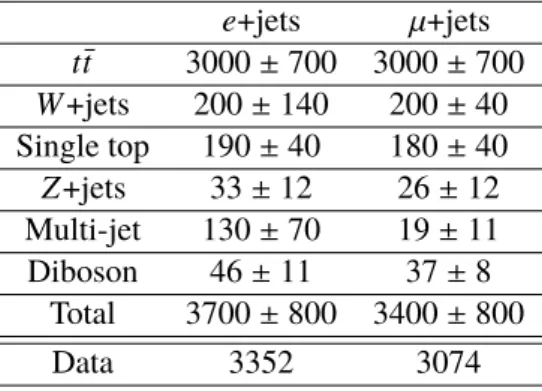
After all event selection criteria are applied, 3352 events remain in thee+jets selection and 3074 events remain in the µ+jets selection. The event yields from data and from expected background processes are listed in Table1together with the associated systematic uncertainties. There is a deficit of data compared to expectation for both selections; however this deficit is consistent with the nominal prediction within the associated systematic uncertainties.
Table 1: Data and expected background event yields after the (a)e+jets and (b)µ+jets selections. The total systematic uncertainty on the expected background yields is also given.
e+jets µ+jets t¯t 3000±700 3000±700 W+jets 200±140 200±40 Single top 190±40 180±40 Z+jets 33±12 26±12 Multi-jet 130±70 19±11
Diboson 46±11 37±8
Total 3700±800 3400±800
Data 3352 3074
Figure 3 shows the transverse momentum of the charged lepton in the selected events. The Emiss
T
distribution is shown in Figure4. The transverse momentum of the selected jet and top-tagged jets are shown in Figures5and6, respectively. Figures7and8show the reconstruced mass of the leptonic and hadronic top candidates, respectively. For all of these distributions, any deviations from expectations are well within the statistical and systematic uncertainties.
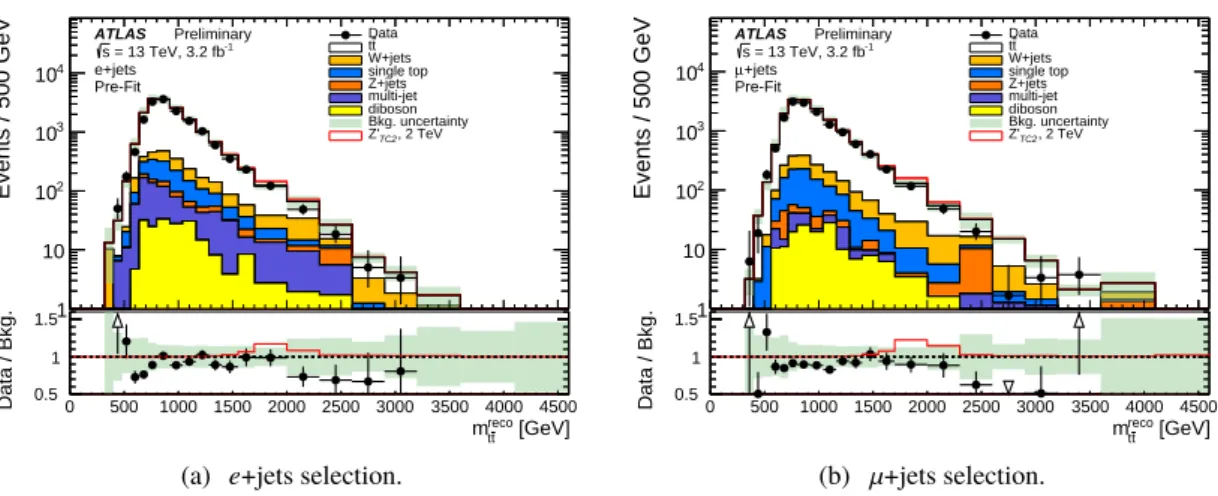
The reconstructedt¯t invariant mass spectra for the electron and muon selectons, are shown in Figure9.
The data generally agree with the expected background with slight shape differences seen especially in the high-mass and low-mass regions; these deviations are consistent with the nominal predictions within the associated uncertainties.
50 100 150 200 250 300 350 400 450 500
Events / 20 GeV
100 200 300 400 500 600 700 800
900 Data
t t W+jets single top Z+jets multi-jet diboson Bkg. uncertainty
ATLAS Preliminary = 13 TeV, 3.2 fb-1
s e+jets
[GeV]
Lepton pT
50 100 150 200 250 300 350 400 450 500
Data / Bkg.
0.5 1 1.5
(a) e+jets selection.
50 100 150 200 250 300 350 400 450 500
Events / 20 GeV
100 200 300 400 500 600 700 800
900 Data
t t W+jets single top Z+jets multi-jet diboson Bkg. uncertainty
ATLAS Preliminary = 13 TeV, 3.2 fb-1
s +jets µ
[GeV]
Lepton pT
50 100 150 200 250 300 350 400 450 500
Data / Bkg.
0.5 1 1.5
(b) µ+jets selection.
Figure 3: The distribution of the transverse momentum of the lepton in the (a)e+jets and (b)µ+jets selections. The SM background components are shown as stacked histograms. The shaded areas indicate the total systematic uncertainties.
50 100 150 200 250 300 350 400 450 500
Events / 10 GeV
100 200 300 400
500 Data
t t W+jets single top Z+jets multi-jet diboson Bkg. uncertainty
ATLAS Preliminary = 13 TeV, 3.2 fb-1
s e+jets
[GeV]
miss
ET
50 100 150 200 250 300 350 400 450 500
Data / Bkg.
0.5 1 1.5
(a) e+jets selection.
50 100 150 200 250 300 350 400 450 500
Events / 10 GeV
100 200 300 400
500 Data
t t W+jets single top Z+jets multi-jet diboson Bkg. uncertainty
ATLAS Preliminary = 13 TeV, 3.2 fb-1
s +jets µ
[GeV]
miss
ET
50 100 150 200 250 300 350 400 450 500
Data / Bkg.
0.5 1 1.5
(b) µ+jets selection.
Figure 4: The distribution of theEmiss
T in the (a)e+jets and (b)µ+jets selections. The SM background components are shown as stacked histograms. The shaded areas indicate the total systematic uncertainties.
8. Results
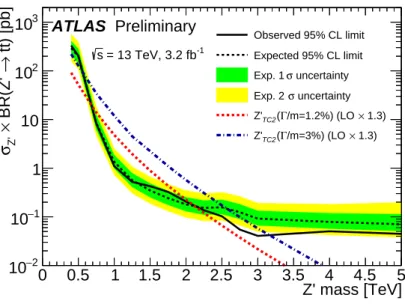
The final discriminating observables that are used to search for a massive resonance are themrecot¯t spectra from the two selections. After the reconstruction of thet¯tmass spectra, the data and expected background distributions are compared using BumpHunter [86], which is a hypothesis-testing tool that searches the data for local excesses or deficits compared to the expected background, taking the look-elsewhere effect [87] into account over the full mass spectrum. After accounting for the systematic uncertainties, no significant deviation from the total expected background is found. Upper limits are set on the cross section times branching ratio for each of the signal models using a profile likelihood-ratio test. The CLs
prescription [88] is used to derive one-sided 95% CL limits.
The statistical and systematic uncertainties on the expected distributions are included in this CLsprocedure as nuisance parameters in the likelihood fits. The nuisance parameters for the systematic uncertainties
0 50 100 150 200 250 300 350 400 450 500
Events / GeV
5 10 15 20 25 30
35 Data
t t W+jets single top Z+jets multi-jet diboson Bkg. uncertainty
ATLAS Preliminary = 13 TeV, 3.2 fb-1
s e+jets
[GeV]
Selected jet pT
0 50 100 150 200 250 300 350 400 450 500
Data / Bkg.
0.5 1 1.5
(a) e+jets selection.
0 50 100 150 200 250 300 350 400 450 500
Events / GeV
5 10 15 20 25
Data t t W+jets single top Z+jets multi-jet diboson Bkg. uncertainty
ATLAS Preliminary = 13 TeV, 3.2 fb-1
s +jets µ
[GeV]
Selected jet pT
0 50 100 150 200 250 300 350 400 450 500
Data / Bkg.
0.5 1 1.5
(b) µ+jets selection.
Figure 5: The distribution of the transverse momentum of the hardest small-R jet with ∆R(`,jet) < 1.5 in the (a)e+jets and (b)µ+jets selections. The SM background components are shown as stacked histograms. The shaded areas indicate the total systematic uncertainties.
400 600 800 1000 1200 1400
Events / 20 GeV
200 400 600 800 1000
1200 Data
t t W+jets single top Z+jets multi-jet diboson Bkg. uncertainty
ATLAS Preliminary = 13 TeV, 3.2 fb-1
s e+jets
[GeV]
Large-R jet pT
400 600 800 1000 1200 1400
Data / Bkg.
0.5 1 1.5
(a) e+jets selection.
400 600 800 1000 1200 1400
Events / 20 GeV
200 400 600 800 1000
1200 Data
t t W+jets single top Z+jets multi-jet diboson Bkg. uncertainty
ATLAS Preliminary = 13 TeV, 3.2 fb-1
s +jets µ
[GeV]
Large-R jet pT
400 600 800 1000 1200 1400
Data / Bkg.
0.5 1 1.5
(b) µ+jets selection.
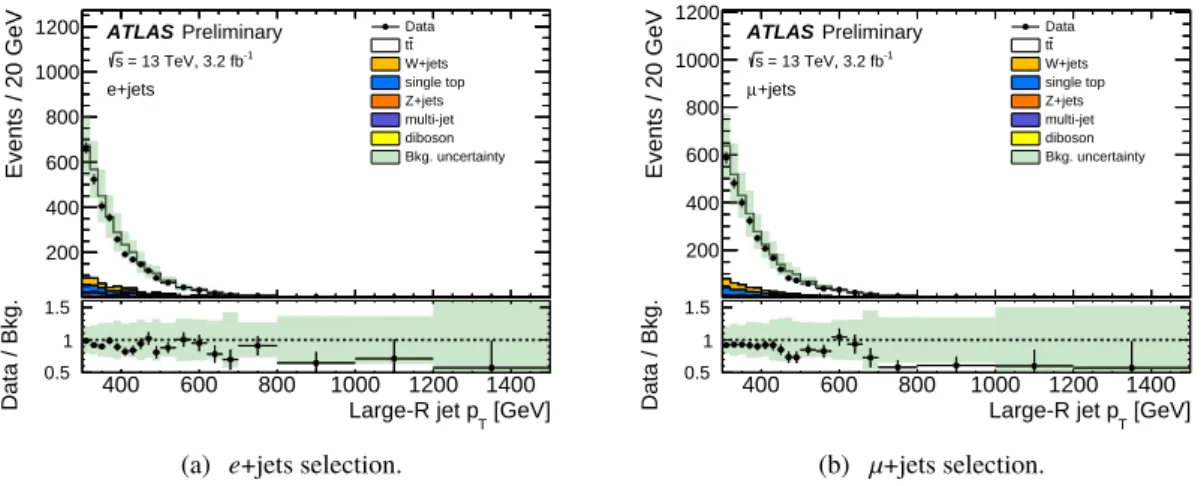
Figure 6: The distribution of the transverse momentum of the large-Rjet in the (a)e+jets and (b)µ+jets selections.
The SM background components are shown as stacked histograms. The shaded areas indicate the total systematic uncertainties.
are constrained by a Gaussian probability density function with a width corresponding to the size of the uncertainty considered. Correlations between different channels and bins are taken into account. The product of the various probability density functions forms the likelihood function that is maximised in the fit by adjusting the free parameter, the signal strength (a multiplicative factor applied to the signal cross section), and nuisance parameters. The expectedmrecot
t¯ distributions are compared to data in Figure10after a fit of nuisance parameters under the background-only hypothesis. It can be seen that the uncertainties are smaller than in Figure9and that the procedure is able to produce a good-quality fit to the data.
The impact of the fitted nuisance parameters on the fitted signal strength is different at each candiate signal mass. For example, at aZ0signal of mass 2 TeV, the impact of an uncertainty on the best-fit value is computed by fixing the nuisance parameterθto the one-sigma range limits (positive or negative), and repeating the fit. The most significant uncertainties are related to the large-R JES impacting the fitted