ATLAS-CONF-2015-045 15September2015
ATLAS NOTE
ATLAS-CONF-2015-045
1st September 2015
Combined searches for WW , W Z , and Z Z resonances in pp collisions at √
s = 8 TeV with the ATLAS detector
The ATLAS Collaboration
Abstract
A search for new heavy bosons decaying to WW, WZ andZZ is presented, using a data sample of 20.3 fb−1ofppcollisions collected with the ATLAS detector at the CERN Large Hadron Collider. The analysis combines searches in all-leptonic, semi-leptonic, and all- hadronic final states. No significant excess is observed in the combined analysis and produc- tion cross section limits at 95% confidence level are set within the context of an extended gauge model with a heavyW0boson and a bulk Randall–Sundrum model with a heavy spin- 2 graviton. Mass limits at the 95% CL are derived on theW0 boson of an extended gauge model and on the spin-2 graviton of a bulk Randall-Sundrum model.
c
2015 CERN for the benefit of the ATLAS Collaboration.
Reproduction of this article or parts of it is allowed as specified in the CC-BY-3.0 license.
1 Introduction
The naturalness problem associated with the light mass of the recently discovered Higgs particle [1–4], suggests that the Standard Model (SM) is likely to be extended by a theory which includes additional particles and interactions at the TeV scale. Many such extensions of the SM, like extended gauge mod- els [5–7], models of warped extra dimensions [8–10], technicolor [11–14], and more generic composite Higgs models [15, 16], predict the existence of massive resonances decaying to pairs ofW andZ bo- sons.
The extended gauge model (EGM) [5] predicts a new charged vector boson,W0, that couples to the SM particles. The coupling between theW0 and the SM fermions is the same as the coupling between the W boson and the fermions in the SM. The coupling between theW0 and theWZ bosons has the same structure as theWWZcoupling in the SM, but is scaled by a factorc×(mW/mW0)2, wherecis a scaling constant,mWis theWboson mass, andmW0is theW0boson mass. The scaling of the coupling allows the width of theW0boson to increase approximately linearly withmW0 atmW0 >>mW and remain narrow for c∼1. Forc=1 andmW0 >500 GeV theW0width is approximately 3.6% of its mass.
The ATLAS and CMS collaborations have set exclusion bounds on the production and decay of the EGM W0 boson. In searches using the`ν`0`0(`≡e, µ) channel, the ATLAS [17] and CMS [18] collaborations have excluded at 95% confidence level (CL) EGMW0boson decaying toWZassumingc=1 with masses below 1.52 TeV and 1.55 TeV, respectively. In addition the ATLAS collaboration has also excluded these at 95% CL with masses below 1.49 TeV using the ``qq¯ [19] channel, and below 1.59 TeV using the
`νqq¯ [20] channel. These have also been excluded at 95% CL with masses between 1.3 and 1.5 TeV and below 1.7 TeV by the ATLAS [21] and CMS [22] collaborations, respectively, using the fully hadronic final state. Searches for theW0 boson decaying to`ν[23,24] have set strong bounds on the mass of the W0 assuming the sequential standard model, which differs from the EGM in that theW0WZ coupling is set to zero.
Diboson resonances are also predicted in an extension of the original Randall–Sundrum (RS) [8–10]
model with a warped extra dimension. In this extension to the RS model [25–27], the SM fields are allowed to propagate in the bulk of the extra dimension, avoiding constraints on the original RS model from flavor-changing neutral currents and from electroweak precision measurements. This so called bulk- RS model is characterized by a dimensionless coupling constantk/M¯Pl ∼ 1, wherek is the curvature of the warped extra dimension, and ¯MPl = MPl/√
8πis the reduced Planck mass. In this model a Kaluza–
Klein excitation of the spin-2 graviton,G∗, often decays to pairs ofWorZ bosons. For bulkG∗masses between 0.5 and 2.5 TeV, theG∗width ranges from 3.7% to 6.2% of its mass.
The ATLAS collaboration has excluded at 95% CL bulkG∗→ZZwith masses below 740 GeV, using the
``qq¯ [19] channel, as well as bulkG∗ →WW with masses below 760 GeV, using the`νqq¯ [20] channel assumingk/M¯Pl = 1. Moreover, the CMS collaboration has also excluded with 95% CL theG∗ of the original RS model, decaying toWW andZZ with masses below 1.2 TeV using the fully hadronic final state [22] and has set 95% CL limits on the production and decay of generic diboson resonances using a combination of``qq,¯ `νqq¯and fully hadronic final states [28].
To improve the sensitivity to new diboson resonances, this note presents a combination of four statistically independent searches for diboson resonances performed by the ATLAS collaboration. The searches are combined considering the correlations between systematic uncertainties in the different channels. The first search, sensitive to charged resonances decaying toWZ, uses the`ν`0`0[17] final state. The second search, sensitive to charged resonances decaying toWZ and neutral resonances decaying to ZZ, uses
the``qq¯ [19] final state. The third search, sensitive to charged resonances decaying toWZand neutral resonances decaying toWW, uses the`νqq¯ [20] final state. Finally, the fourth search, sensitive to both charged resonances decaying toWZ and to neutral resonances decaying to eitherWW orZZ, uses the fully hadronic final state [21]. Due to the large momenta of the bosons from the resonance decay, the resonance is reconstructed with two large radius jets, and is hereafter referred to as theJ Jchannel.
To search for a charged diboson resonance decaying toWZ the`ν`0`0,``qq,¯ `νqq, and¯ J Jchannels are combined. The result of this combination is interpreted using the EGMW0 model assumingc = 1 as a benchmark. The acceptance times efficiency as a function of theW0 mass can be used to interpret the result of this search when testing models with a narrow resonance decaying toWZ bosons. To search for neutral diboson resonances decaying toWW andZZ the``qq,¯ `νqq, and¯ J Jchannels are combined, and the result is interpreted using the bulkG∗assumingk/M¯Pl = 1 as a benchmark. The combinations presented in this note improve the cross section times branching ratio limits for diboson resonances in a wide mass range and extend the mass exclusion for bothW0and bulkG∗with respect to previous ATLAS searches.
2 ATLAS detector and data sample
The ATLAS detector is described in detail in Ref. [29]. It covers nearly the entire solid angle1around the interaction point and has an approximately cylindrical geometry. It consists of an inner tracking detector (ID) placed within a 2 T axial magnetic field surrounded by electromagnetic and hadronic calorimeters and followed by a muon spectrometer (MS) with a magnetic field provided by a system of superconduct- ing toroids.
The results presented in this note use the dataset collected in 2012 by ATLAS from the LHCppcollisions at √
s=8 TeV, using a single lepton (electron or muon) trigger with apTthreshold of 24 GeV, or a single large-Rjet trigger with apTthreshold of 360 GeV. The integrated luminosity of this dataset after requiring good beam and detector conditions is 20.3 fb−1. The uncertainty on the integrated luminosity is±2.8%.
It is derived following the same methodology as that detailed in Ref. [30].
3 Signal and background samples
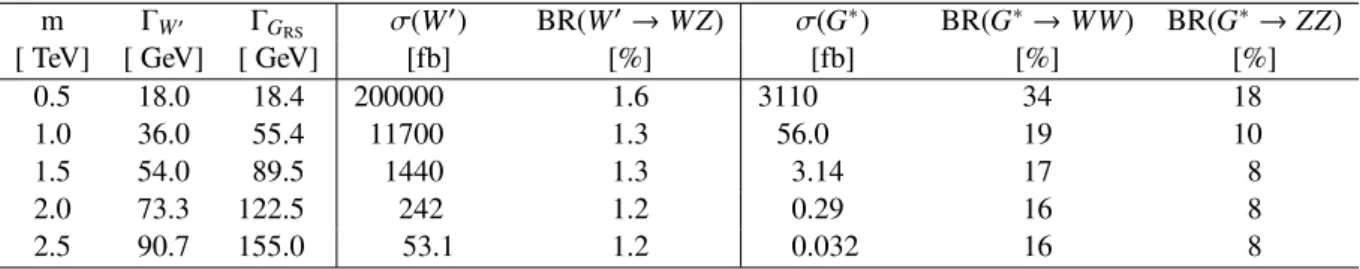
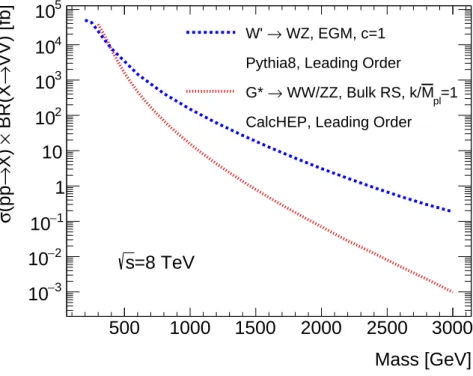
The acceptance and the reconstructed mass spectra for narrow resonances are estimated with signal samples generated with resonance masses between 200 and 2500 GeV, in 100 GeV steps. The bulk G∗signal events are produced by CalcHEP [31] withk/M¯Pl =1.0, and theW0signal sample is generated with Pythia8 [32], setting the coupling scale factorc = 1. The factorization and renormalization scales are set to the generated resonance mass. The hadronization and fragmentation are modeled with Pythia8 in both cases, and the CTEQ6L1 [33] (MSTW2008LO [34]) parton distribution functions (PDFs) are used for theG∗(W0) signal. The leading order cross sections and branching ratios for theW0and bulkG∗ signal samples for selected mass points and assumed values of the coupling parameters are provided in Table1.
1ATLAS uses a right-handed coordinate system with its origin at the nominal interaction point (IP) in the centre of the detector and thez-axis along the beam pipe. The x-axis points from the IP to the centre of the LHC ring, and they-axis points upward. Cylindrical coordinates (r, φ) are used in the transverse plane,φbeing the azimuthal angle around the beam pipe.
The pseudorapidity is defined in terms of the polar angleθasη=−ln tan(θ/2), and the distance∆R≡p
∆φ2+ ∆η2.
Table 1: Leading order cross-sections, widths, and branching ratios for theW0and bulkG∗signals at √
s=8 TeV for a variety of mass points.
m ΓW0 ΓGRS σ(W0) BR(W0→WZ) σ(G∗) BR(G∗→WW) BR(G∗→ZZ)
[ TeV] [ GeV] [ GeV] [fb] [%] [fb] [%] [%]
0.5 18.0 18.4 200000 1.6 3110 34 18
1.0 36.0 55.4 11700 1.3 56.0 19 10
1.5 54.0 89.5 1440 1.3 3.14 17 8
2.0 73.3 122.5 242 1.2 0.29 16 8
2.5 90.7 155.0 53.1 1.2 0.032 16 8
The backgrounds in the different decay channels are modeled with simulated event samples. TheW+jets andZ + jets backgrounds are generated using Sherpa[35] with CT10 PDFs [36], Pythia6 [32] with CTEQ6L1 PDFs, and Alpgen [37] to estimate the systematic uncertainty. The W +jets and Z + jets production cross sections are scaled to NNLO calculations [38]. The top pair, s-channel single-top and Wtprocesses are modeled by the MC@NLO [39,40] generator with CT10 PDFs, interfaced to Herwig [41] for hadronisation and Jimmy[42] for modeling of the underlying event. The top pair production cross section is calculated at NNLO in QCD including resummation of next-to-next-to-leading logarithmic soft gluon terms with Top++2.0 [43–48]. Thet-channel single-top events are generated by AcerMC [49] with CTEQ6L1 PDFs and Pythia6 for hadronisation. The diboson events are produced with the Herwig generator and CTEQ6L1 PDFs, except for the`ν`0`0 channel which used POWHEG [50,51] interfaced to Pythia6. The diboson production cross sections are normalized to predictions at next-to-leading-order accuracy [52]. Additional diboson samples for the`νqq¯channel are produced with the Sherpagenerator.
QCD multi-jet samples are simulated with Pythia6, Herwig, and POWHEG interfaced to Pythia6.
Generated events are processed with the ATLAS detector simulation program [53] based on the GEANT4 package [54]. Effects from additional inelastic ppinteractions (pileup) occurring in the same and neigh- boring bunch crossings are taken into account by overlaying minimum-bias events simulated by Pythia 8.
4 Object reconstruction and selection
The search channels participating in the combination presented in this note use reconstructed electrons, muons, jets and a measurement of the missing transverse momentum.
4.1 Leptons
Electron candidates are selected from energy clusters in the electromagnetic calorimeter within|η|<2.47, excluding the transition region between the barrel and the endcap calorimeters (1.37 < |η| < 1.52), that match a track reconstructed in the ID. Electrons satisfying the tight identification criteria are used to reconstructW →eνcandidates, whileZ → eeare reconstructed with electrons that satisfy the medium identification criteria. These criteria are described in Ref. [55]. Muon candidates are reconstructed within the range|η| < 2.5 by combining tracks with consistent momentum in the ID and the MS [56]. Only leptons withpT>25 GeV are considered.
Backgrounds due to misidentified leptons and non-prompt leptons are suppressed by requiring leptons to be isolated from other activity in the event and to be consistent with originating from the primary vertex of the event2. Maximum thresholds on calorimeter and track isolation discriminants are used to ensure that the leptons are isolated. The calorimeter isolation discriminant is defined as the ratio between the energy deposits in the calorimeter surrounding the lepton within a certain∆Rand the energy of the lepton. The track isolation discriminant is defined as the ratio of the scalar sum of the pT of tracks surrounding the lepton within a certain∆Rand thepT of the lepton. When aZboson is produced with a high momentum boost, the leptons from its decay can be within the isolation angle. Therefore, to maintain a high efficiency for diboson resonances with masses above 1 TeV, the isolation methods are modified. For dilepton objects of the same flavor with high-pT(&600 GeV), contributions from the additional lepton are excluded when computing the isolation discriminants. Details of the lepton isolation criteria including the parameters of the isolation discriminants and the maximum thresholds applied, are given in the publications for the
`ν`0`0[17],``qq¯[19], and`νqq¯ [20] channels.
4.2 Jets
4.2.1 Small-Rjets
Jets are formed by combining topological clusters reconstructed in the calorimeter system [57], which are calibrated in energy with the local calibration weighting scheme [58] and are considered massless.
Hadronically decaying vector bosons with low-pT (. 450 GeV) are reconstructed using a pair of jets.
The jets are formed with the anti-kt algorithm [59] with a radius parameterR = 0.4, and are corrected for energy losses in passive material, the non-compensating response in the calorimeters and pileup [60].
These jets are hereafter referred to as small-R jets. Only small-R jets within |η| < 2.8 (2.1) and pT >
30 GeV are considered for the`νqq¯ (``qq) channel, and for jets with¯ pT <50 GeV it is required that the scalar summedpT of the tracks associated to the primary vertex accounts for at least 50% of the scalar summed pTof all tracks associated to the jet. Jets containing hadrons fromb-quarks are identified using a multivariateb-tagging algorithm as described in Ref. [61].
4.2.2 Large-Rjets
Hadronically decaying vector bosons with high-pT (& 400 GeV) can be reconstructed with a single jet due to the collimated nature of their decay products. The large-Rjets, hereafter denoted as J, are first formed with the Cambridge–Aachen (C/A) algorithm [62,63] with a radius parameterR = 1.2. After the jet formation, a grooming algorithm is applied to the jets to reduce the effect of pileup and underlying event interactions and to identify a pair of subjets associated with the quarks emerging from the vector boson decay. The grooming algorithm, a variant of the mass-drop filtering technique [64], proceeds by examining the sequence of pairwise combination of subjets used in the jet formation in reverse order. At each step, the lower-mass subjet is discarded, and the higher-mass subjet is split into its two subjets which
2The primary vertex of the event is defined as the reconstructed primary vertex with highestP
p2Twhere the sum is over the tracks associated with this vertex.
are examined at the next step. The split-and-discard procedure continues until the pair of subjets being examined satisfies a momentum balance criterion,
√y≡min(pTj
1,pTj
2)∆R(j1,j2)
m0 >0.2, (1)
wherepTj1 andpTj2are the transverse momenta of subjets, j1and j2respectively,∆R(j1,j2)is the distance between j1and j2, andm0is the invariant mass of the pair of subjets. The selected pair of subjets is then filtered by clustering the original topological cluster constituents of the selected pair of subjets using the C/A algorithm with a small radius parameterR=0.3, and all but the three highest-pTjets resulting from this reclustering are discarded. If there are fewer than three jets after the reclustering, all constituents are kept. This groomed jet is hereafter referred to as the groomed large-Rjet.
Charged-particle tracks reconstructed with the ID and consistent with particles originating from the primary vertex and with pT ≥ 500 MeV are associated to a large-Rjet by representing each track by a “ghost” constituent that is collinear with the track at the perigee with negligible energy during jet form- ation [65]. In the fully hadronic channel, the charged-particle track multiplicity associated to the large-R jet prior to the grooming,ntrk, is used to discriminate between jets originating from boson decays, and jets from background processes.
4.2.3 Boson jet identification
By rejecting those large-Rjets that do not satisfy the momentum balance criteria from Eq.1, the groom- ing algorithm provides a small degree of discriminating power between jets from hadronically decaying bosons and those originating from background processes. This discrimination is further improved by imposing additional requirements on the large-Rjet properties. First, in all of the channels using large-R jets, a stricter subjet momentum-balance criterion, √
y > 0.45, provides enhanced discrimination due to the tendency of backgrounds to have unbalanced subjet momenta as expected in those jets where soft gluon-like radiation is reconstructed in one of these subjets. Second, jets are selected by applying a se- lection window on the groomed jet mass. Due to the different backgrounds affecting each of the search channels, different mass windows are used for each channel. In the single lepton and dilepton channels mass windows of 65< mJ < 105 GeV and 70< mJ < 110 GeV, wheremJ represents the jet mass, are used respectively for selectingW andZ bosons. And in the fully hadronic channel, mass windows of 69.4<mJ <95.4 GeV and 79.8<mJ <105.8 GeV are used when targeting aWorZboson respectively.
Finally, due to the larger backgrounds affecting the fully hadronic channel, a requirement ofntrk < 30 is used to reject energetic gluon-like jets in favor of jets originating from boson decays.
4.3 Missing transverse momentum
The missing transverse momentumEmissT is calculated as the negative of the vectorial sum of the transverse momenta of the electrons, muons and jets as well as calibrated energy deposits in the calorimeter which are not associated to these objects as described in Ref. [66].
5 Analysis channels
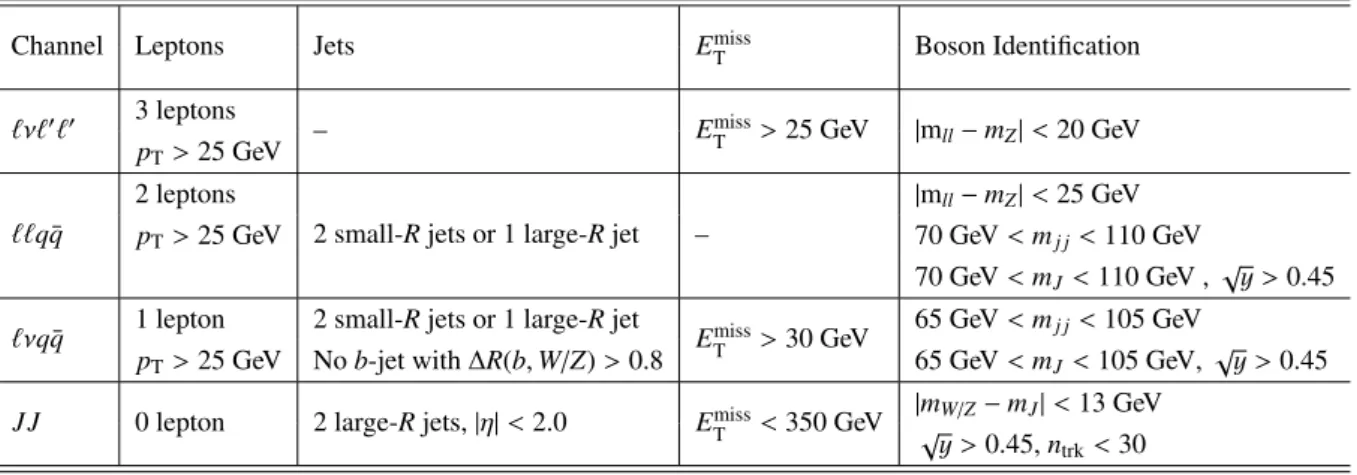
The selections in the four analysis channels`ν`0`0,``qq,¯ `νqq¯andJ Jare mutually exclusive and therefore the channels are statistically independent. Summaries of the event selection and classification criteria are given in Tables2and3.
The`ν`0`0 channel requires exactly three leptons withpT > 25 GeV, of which at least one must be geo- metrically matched to a lepton reconstructed by the trigger algorithm. Events with additional leptons with pT >20 GeV are vetoed. At least one pair of oppositely charged, same flavor leptons is required to have an invariant mass within theZ mass window|mll−mZ| <20 GeV. If there are two acceptable combina- tions passing this requirement the combination with the mass value closer to theZ boson mass is chosen as theZ candidate. The event is required to have EmissT > 25 GeV. TheW candidate is reconstructed with the third lepton, assuming the neutrino is the only source ofEmissT and theWboson is on shell. To enhance the signal sensitivity, requirements on the rapidity difference∆y(W,Z) < 1.5 and on the separ- ation in the azimuthal angle∆φ(`3rd,ETmiss) are introduced. Exclusivehigh-mass andlow-massregions are defined with∆φ(`3rd,ETmiss) < 1.5 for boosted W bosons and∆φ(`3rd,EmissT ) > 1.5 for W bosons at lowpT, respectively. The main background sources in the`ν`0`0channel areW/ZandZ/ZSM processes with leptonic decays of theW andZ bosons. They are estimated from simulation. Other background sources areW/Z+jets, top quark and QCD jet production, where one or several jets are mis-reconstructed as leptons. To estimate these backgrounds the mis-reconstruction rate of leptons is determined with data driven methods, and applied to control data samples with leptons and one or more jets.
The ``qq¯ channel requires exactly two leptons, having the same flavour with pT > 25 GeV. Muon pairs are required to have opposite charge. At least one lepton is required to be matched to a lepton reconstructed by the trigger. The invariant mass of the lepton pair must be within 25 GeV of theZ mass.
Three regions namedmerged, high-pTresolvedandlow-pTresolvedare defined to optimize the selection for different mass ranges. The merged region requirements arepT(``)>400 GeV, and a groomed large-R jet described in Section4withpT(J)>400 GeV passing the boson tagging criteria. The high-pTresolved region is defined by pT(``) > 250 GeV, pT(j j) > 250 GeV, and the low-pT resolved region requires pT(``) > 100 GeV, pT(j j) > 100 GeV. The invariant mass requirement on the jet system is 70 GeV <
mj j/J < 110 GeV. The exclusive selections are applied in sequence starting with the merged region, and progressing with the high-pT and then the low-pT resolved regions. The main background sources in the``qq¯ channel areZ+jets, followed by top-quark pair and non-resonant vector-boson pair production.
Background estimates are based on simulation. Additionally, for the main background source,Z+jets, the shape is modeled with simulation, while the normalization and a linear shape correction is determined from data in a control region, defined as the side-bands of theqq¯ invariant mass distribution outside the signal region.
In the `νqq¯ channel exactly one lepton with pT > 25 GeV matched to a lepton reconstructed by the trigger is required. The event must contain ETmiss > 30 GeV. Similar to the ``qq¯ channel the event selection contains three different mass regions of the signal, denoted as merged, high-pT resolved and low-pTresolvedregions. In the merged region where the hadronic decay products merge into a single jet, a groomed large-Rjet withpT > 400 GeV and 65 GeV< mJ <105 GeV is required. On the leptonically decayingW → `νthe requirement pT(`ν) > 400 GeV is applied, where pT(`ν) is reconstructed from the sum of the charged lepton momentum vector and theEmissT vector. To suppress the background from top-quark production, events with an identifiedb-jet with a separation of∆R>0.8 relative to the large-R jet are rejected. Additionally, in the electron channel the leading large-R jet andEmissT are required to be separated by∆φ(EmissT ,J) > 1 to reject multi-jet background. If the event does not pass the criteria
of the merged region, the resolved region selection criteria are applied. For the high-pT region two small-Rjets with pT > 80 GeV are required to form the hadronically decaying W/Z candidate with a transverse momentum of pT(j j) > 300 GeV and an invariant mass of 65 GeV < mj j < 105 GeV. The leptonically decayingW →`νmust have pT(`ν)> 300 GeV. The event is rejected if ab-jet is identified in addition to the two leading jets. In the electron channel the leading small-Rjet and EmissT are required to be separated by∆φ(EmissT ,j)> 1. If the event does not pass the selection requirements of the high-pT region the selection of the low-pT region is applied, where pT(j j) > 100 GeV, pT(`ν) > 100 GeV are applied. The dominant background in the`νqq¯ channel isW/Z+jets production, followed by top quark production, multijet and diboson processes. TheW/Z+jets background shape is modeled by simulation, while the normalization is determined from data in a control region, defined as the side-bands of theqq0 invariant mass distribution outside the signal region. ThepT(W) distribution of theW+jets simulation is corrected using data to improve the modeling. The sub-dominant background processes are derived using simulation only (diboson), or simulation and data driven techniques (multijet, top quark).
The analysis in the fully hadronic decay mode selects events which pass a jet trigger with a nominal threshold of 360 GeV and have at least two large-Rjets within|η|<2.0, a rapidity difference between the two jets of|∆y12| < 1.2, and an invariant mass of the two jets ofm(J J) > 1.05 TeV. Events that contain one or more leptons with pT > 20 GeV or missing transverse energy in excess of ETmiss > 350 GeV are vetoed. The large-Rjets must pass the filtering step and boson jet criteria described in Section 4.
Furthermore, the dijetpTasymmetry defined asA=(pT1− pT2)/(pT1+pT2) must beA<0.15 to avoid mismeasured jets. In the fully hadronic channel the dominant background is di-jet production from QCD processes. The di-jet background is estimated by a parametric fit with a smoothly falling function to the observed di-jet mass spectrum in the data. Only diboson resonances with mass values> 1.3 TeV are considered as signal for this analysis channel.
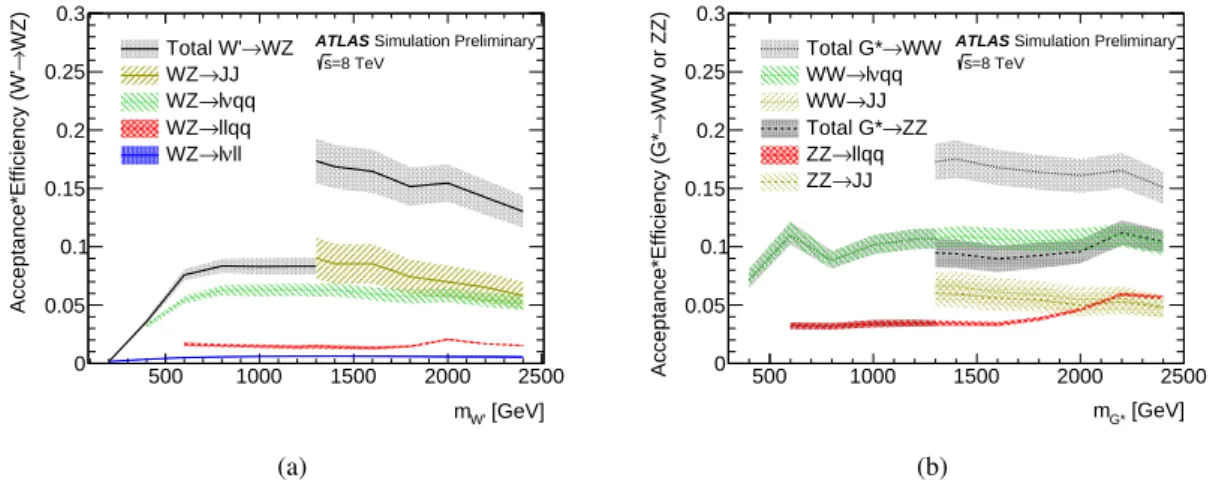
The selections described above have a combined acceptance times efficiency of up to 17% forG∗→WW, up to 11% forG∗ → ZZ, and up to 17% for W0 → WZ. The acceptance times efficiency includes the WandZbranching fractions. Figure1(a)and Figure1(b)summarize the acceptance times efficiency for the different analyses as a function of theW0 mass and of theG∗mass, considering only decays of the resonance intoVV.
[GeV]
mW'
500 1000 1500 2000 2500
WZ)→Acceptance*Efficiency (W'
0 0.05 0.1 0.15
0.2 0.25 0.3
→WZ Total W'
→JJ WZ
νqq
→l WZ
→llqq WZ
νll
→l WZ
ATLAS Simulation Preliminary
=8 TeV s
(a)
[GeV]
mG*
500 1000 1500 2000 2500
WW or ZZ)→Acceptance*Efficiency (G* 0
0.05 0.1 0.15 0.2 0.25 0.3
→WW Total G*
νqq
→l WW
→JJ WW
→ZZ Total G*
→llqq ZZ
→JJ ZZ
ATLAS Simulation Preliminary
=8 TeV s
(b)
Figure 1: The signal acceptance times efficiency for the different analyses entering he combination are shown in 1(a)for the EGM W’ model and in1(b)for the bulkG∗model. The error bands represent the combined statistical and systematic uncertainties.
Table 2: Summary of the event selection requirements in the different search channels. The selected events are further classified into different kinematic categories as listed in Table3.
Channel Leptons Jets EmissT Boson Identification
`ν`0`0 3 leptons
– EmissT >25 GeV |mll−mZ|<20 GeV pT>25 GeV
``q¯q
2 leptons
2 small-Rjets or 1 large-Rjet –
|mll−mZ|<25 GeV
pT>25 GeV 70 GeV<mj j<110 GeV
70 GeV<mJ<110 GeV , √ y >0.45
`νqq¯ 1 lepton 2 small-Rjets or 1 large-Rjet
EmissT >30 GeV 65 GeV<mj j<105 GeV pT>25 GeV Nob-jet with∆R(b,W/Z)>0.8 65 GeV<mJ<105 GeV, √
y >0.45 J J 0 lepton 2 large-Rjets,|η|<2.0 EmissT <350 GeV |mW/Z−mJ|<13 GeV
√y >0.45,ntrk<30
Table 3: Summary of the event classification requirements in the different search channels. The classifications are mutually exclusive, applying the requirements in sequence beginning with the high-pT merged, followed by the high-pTresolved and finalizing with the low-pTresolved classification.
Channel High-pTmerged High-pTresolved (high mass) Low-pTresolved (low mass)
`ν`0`0 – ∆y(W,Z)<1.5
∆φ(`3rd,ETmiss)<1.5 ∆φ(`3rd,EmissT )>1.5
``qq¯ pT(``)>400 GeV pT(``)>250 GeV pT(``)>100 GeV pT(J)>400 GeV pT(j j)>250 GeV pT(j j)>100 GeV
`νq¯q
1 large-Rjet,pT>400 GeV 2 small-Rjets,pT>80 GeV 2 small-Rjets,pT>30 GeV
pT(`ν)>400 GeV pT(j j)>300 GeV pT(j j)>100 GeV pT(`ν)>300 GeV pT(`ν)>100 GeV
∆φ(ETmiss,j)>1 (electron channel) J J |∆y12|<1.2
– m(J J)>1.05 TeV
6 Systematic uncertainties
The sources of systematic uncertainties along with their effects on the expected signal and background yields for each of the individual channels used in this combination are described in detail in their cor- responding publications. Although the results from the different search channels in this combination are statistically independent, commonalities between the different search channels, such as the objects used, the signal and background simulation, and the integrated luminosity estimate, introduce correlated effects in the signal and background expectations.
Whenever an effect due to an uncertainty in the triggering, identification, or reconstruction of leptons is considered for a channel, it is treated as fully correlated with the effects due to this uncertainty in other channels. In the same manner, the effects of each uncertainty related to the small-R jet energy scale and resolution are treated as fully correlated in all channels using small-Rjets or EmissT . For the search channels using large-R jets, uncertainties in the large-R jet energy scale, energy resolution, mass scale, mass resolution, or in the modeling of the boson tagging discriminant √
y, are taken as fully correlated.
Uncertainties in the data-driven background estimates are treated as uncorrelated. The effects of an un- certainty in the initial and final state radiation (ISR and FSR) modeling and in the PDF are treated as fully correlated across all search channels.
7 Combination of the individual channels
The combination of the individual channels proceeds with a simultaneous analysis of the invariant mass distributions of the diboson candidates in the different channels. For each hypothesis being tested, only the channels sensitive to this hypothesis are included in the combination. The signal strength,µ, defined as a scale factor on the cross section predicted by the signal hypothesis, is the parameter of interest.
The analysis follows a frequentist approach with a test statistic based on the profile-likelihood ratio [67].
The test statistic extracts information on the signal strength from a binned maximum-likelihood fit of the signal-plus-background model to the data. The effect of a systematic uncertaintykon the likelihood is modeled with a nuisance parameter,θk, constrained with a corresponding probability density function f(θk). Thus, correlated effects across the different channels are modeled by the use of a common nuisance parameter and its corresponding probability density function. The likelihood model is given by:
L=Y
c
Y
ic
Pois
nobsi
c
nexpi
c (µ, θk) Y
k
fk(θk) (2)
where the indexcrepresents the analysis channel, andicrepresents the bin in the invariant mass distribu- tion.
To simplify the fit and to make its computation more efficient, systematic uncertainties deemed negligible are removed from the fit. To determine if an uncertainty is significant, two tests are performed. First, the overall normalization of the nominal expectation is compared with the expected normalization under plus and minus one standard deviation variations of a nuisance parameter for each component of the spectrum. If any deviation larger than half the statistical error on the mass distribution is found, then the uncertainty is considered. Second, for systematic effects affecting the shape of the expectation, a Kolmogorov-Smirnov test is performed between the expected nominal shape and the shape under plus and minus one standard deviation variations of a nuisance parameter for each component of the spectrum.
If any of the obtained test values is less than 0.1 the systematic uncertainty is included. A detailed discussion on the impacts of the nuisance parameters on the different channels can be found in their corresponding publications.
Exclusion limits at the 95% CL on the production of new diboson resonances are set following theCLs
prescription [68]. The limit at an arbitrary mass is obtained by interpolation of the limits obtained at the test masses. The interpolation assumes monotonic and smooth behavior for the efficiencies for the sig- nal and background processes, and that the impact of the variation of signal mass distributions between adjacent test masses is negligible. The significance of observed excesses over the background-only ex- pectation, is quantified using the local p0, defined as the probability of the background-only model to produce signal-like deviation at least as large as observed in the data. Finally, the level of consistency between the observations of different channels with a common signal strength of a particular resonance model and mass is quantified using a profile-likelihood ratio test. The corresponding profile-likelihood ratio is
Λ(µ)= L
µ,θˆˆ(µ) Lh
µˆA,µˆB,θˆi, (3)
where µis the combined signal strength, ˆµA and ˆµB are the unconditional maximum likelihood (ML) estimators of the signal strengths in the channels being compared, ˆθare the unconditional ML estimators for the nuisance parameters, and ˆˆθ(µ) are the conditional ML estimators ofθfor a givenµ. The consistency between the observations is tested by the probability of observingΛ( ˆµ), where ˆµis the ML estimator for the combined signal strength for the model in question. If the two channels being compared have a common signal strength, i.e. µ = µA = µB, then in the asymptotic limit −2Λ( ˆµ) is expected to be distributed as aχ2with two degrees of freedom.
In the combined analysis to search forW0 resonances, all four individual channels are used. For the charge-neutral bulkG∗, only the`νqq, ``qq, and the J J channels contribute to the combination. In the case of the fully hadronic channel, the union of theWW andZZ signal regions is used in the analysis.
The background to this merged signal region is estimated using the same technique as for the individual signal regions. Table4summarizes the channels and signal regions combined in the analysis for EGM W0and bulkG∗.
8 Results
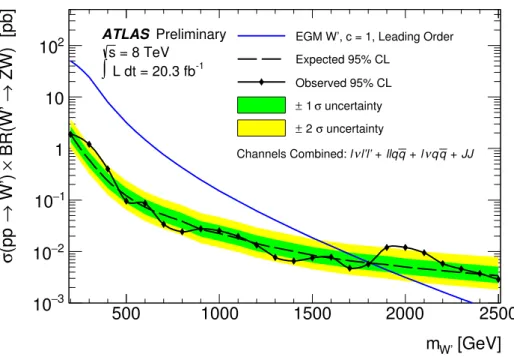
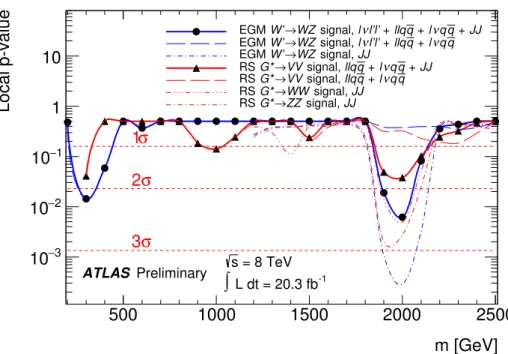
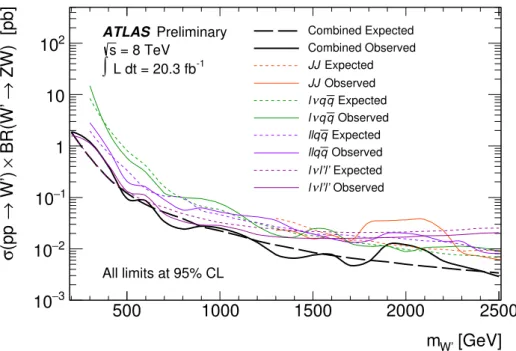
Fig. 2 shows the combined upper limit on the EGM W0 production cross section times its branching ratio toWZat 95% CL in the mass range from 300 GeV to 2.5 TeV. The observed limit is compared to the expected limit and the theoretical EGMW0production cross section. The largest deviation from the background expectation is found at≈2 TeV with a local p0-value corresponding to 2.5σ. This is smaller than thep0-value of 3.4σobserved in theJ Jchannel since the other channels are more consistent with the background-only hypothesis. The resulting lower limit at 95% CL on the EGMW0mass, using a LO cross section calculation, after the full combination is observed to be 1.81 TeV, with an expected limit of 1.81 TeV. The most stringent observed limit of an individual analysis is 1.59 TeV at next-to-next-to- leading-order in the`νqq¯ channel.
Table 4: Channels and signal regions contributing to the combination for the EGMW0and bulkG∗. Channel Signal Region W0mass range [TeV] G∗mass range [TeV]
`ν`0`0 low-mass 0.2-1.9 –
high-mass 0.2-2.5 –
``qq¯
low-pTresolved 0.3-0.9 0.2-0.9
high-pTresolved 0.6-2.5 0.6-0.9
merged 0.9-2.5 0.9-2.5
`νqq¯
low-pTresolved 0.3-0.8 0.2-0.7
high-pTresolved 0.6-1.1 0.6-0.9
merged 0.8-2.5 0.8-2.5
J J
WZselection 1.3-3.0 –
WW+ZZselection – 1.3-3.0
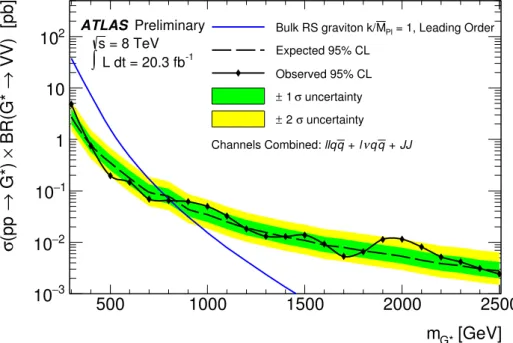
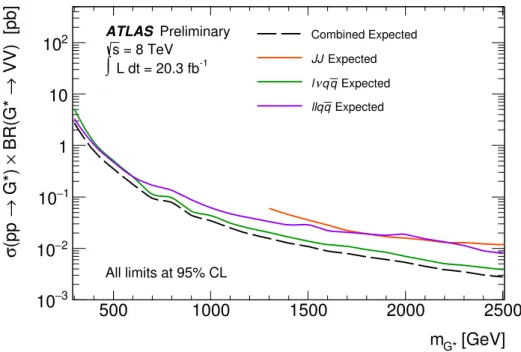
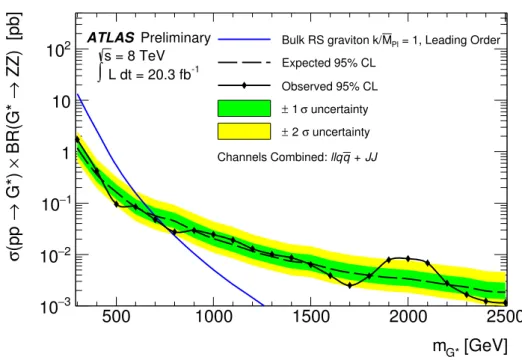
In Fig.3the observed and expected combined upper limit on the bulkG∗production cross section times its branching ratio to WW andZZ at 95% CL is shown in the mass range from 200 GeV to 2.5 TeV, together with the theoretical bulkG∗production cross section. For the bulkG∗assumingk/M¯Pl = 1 the observed combined lower mass limit is 810 GeV, with an expected limit of 790 GeV. The best individual limit is from the`νqq¯ channel with 760 GeV.
[GeV]
mW’
500 1000 1500 2000 2500
ZW) [pb]→ BR(W’ × W’) →(pp σ
−3
10
−2
10
−1
10 1 10 102
ATLAS Preliminary = 8 TeV
s
L dt = 20.3 fb-1
∫
JJ + q νq l + q llq + νl’l’
l Channels Combined:
EGM W’, c = 1, Leading Order Expected 95% CL
Observed 95% CL uncertainty 1 σ
±
uncertainty 2 σ
±
Figure 2: The combined limit on the EGM W0 using the `ν`0`0, ``qq,¯ `νqq, and¯ J J channels. Results include statistical and systematic uncertainties.
[GeV]
mG*
500 1000 1500 2000 2500
VV) [pb]→ BR(G* × G*) →(pp σ
−3
10
−2
10
−1
10 1 10 102
ATLAS Preliminary = 8 TeV s
L dt = 20.3 fb-1
∫
+ JJ q νq + l q Channels Combined: llq
= 1, Leading Order MPl
Bulk RS graviton k/
Expected 95% CL Observed 95% CL uncertainty 1 σ
±
uncertainty 2 σ
±
Figure 3: The combined limit on the bulkG∗using the``qq,¯ `νqq, and¯ J Jchannels. Results include statistical and systematic uncertainties.