ATLAS-CONF-2015-031 27July2015
ATLAS NOTE
ATLAS-CONF-2015-031
27th July 2015
Measurements of four-lepton production in p p collisions at √
s = 8 TeV with the ATLAS detector
The ATLAS Collaboration
Abstract
The four-lepton (4`, ` = e, µ) production is measured in a mass range from 80 to 1000 GeV using 20.3 fb−1 of data in ppcollisions at
√s = 8 TeV at the LHC with the ATLAS detector. The 4`signal events come from the decays of resonant Z and Higgs bosons and the non-resonant Z Z continuum produced from qq¯, gg, and qg initial states. A total of 476 signal candidate events is observed with a background expectation of 26.2±3.6events, enabling the measurement of the integrated cross section and the differential cross section as a function of the invariant mass and transverse momentum of the four-lepton system.
In the mass range above 180 GeV, assuming the theoretical constraint on theqq¯production cross section calculated with perturbative next-to-next-to leading order (NNLO) QCD and next-to-leading order (NLO) Electroweak corrections, the signal strength of the gluon-fusion component with respect to the leading order (LO) prediction is determined to be µgg = 2.4±1.0(stat.)±0.5(syst.)±0.8(theory).
© 2015 CERN for the benefit of the ATLAS Collaboration.
Reproduction of this article or parts of it is allowed as specified in the CC-BY-3.0 license.
1 Introduction
This paper presents measurements of the 4` (` = e, µ) production cross section including both the integrated cross section and the spectra of the invariant mass and the transverse momentum of the 4` system, m4` and pT4`, which are all unfolded to the particle level. In addition, the signal strength of gluon fusion (ggF) production with respect to its leading-order (LO) QCD estimation is measured.
This is performed using 20.3 fb−1 of data in proton–proton collisions at a centre-of-mass energy of
√s=8 TeV from the ATLAS detector at the LHC. The 4`signal events come from the decays of resonant Z and Higgs bosons and the non-resonant Z Z continuum produced fromqq¯, gg, and qg initial states.
These measurements test the validity of the Standard Model (SM) through the interplay of QCD and Electroweak effects for different 4`production mechanisms.
The production mechanisms of the 4`signal events are briefly discussed below.
Z(∗)
Z(∗) q¯
q
`+
`+
`−
`−
(a)
Z(∗)
Z(∗)
¯q q
`−
`+
`+
`−
(b)
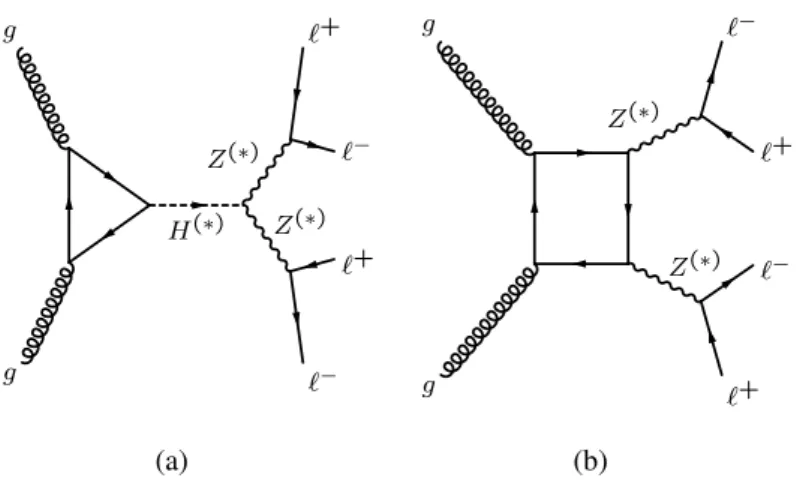
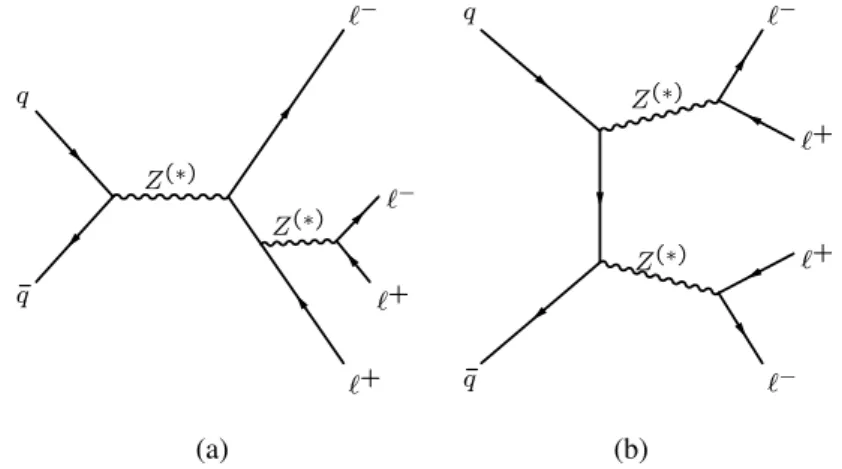
Figure 1: The LO Feynman diagrams for theqq¯-initiated production of 4`: (a)s-channel production ofqq¯→ Z(∗)→
`+`−with associated radiative decays to an additional lepton pair; (b)t-channel production ofqq¯→ Z(∗)Z(∗)→4`.
•qq¯-originated 4`production
The tree-level diagrams forqq¯→4`production are shown in Figure1and the cross section as a function ofm4`is shown in Figure2. The Z(∗)notation meansZ/Z∗/γ∗. The 4`events at theZresonance occurs predominantly via thes-channel diagram as shown in Figure1(a), and has been previously measured by the ATLAS and CMS collaborations [3, 4]. In the 4` invariant mass region above the Z-resonance the 4`event production mainly proceeds through thet-channel process as shown in Figure1(b). The cross section significantly increases when bothZ bosons are produced on-shell, resulting in the rise in them4` spectrum around 180 GeV. The qq¯ → Z Z → 4` production via vector-boson scattering (VBS) is also considered as a 4`signal.
•4`from Higgs boson decays
Figure3(a) shows the diagram for the dominant Higgs-boson production mechanism viaggF. Other Higgs- boson production mechanisms, vector-boson fusion (V BF), vector-boson associate production (V H), and top-pair associated production (t¯t H), provide less than 15 % 4`events from on-shell Higgs boson decays toZ Z(∗). The on-shell Higgs-boson production and decay leads to a sharp resonance around 125 GeV, which is a key signature in the Higgs-boson discovery by the ATLAS [5] and CMS [6] collaborations. The off-shell Higgs-boson production has large destructive interference with the continuum Z Z production from theggFprocesses [7–9]. This effect can be observed in the distributions shown in Figure2, and has
[GeV]
m
4l90 200 300 400 500 600 1000
[fb/GeV]
4l/dm σ d
10-5
10-4
10-3
10-2
10-1
4l q→ q
4l (total) gg →
4l H → gg →
4l ZZ → gg → ATLAS SimulationPreliminary
= 8 TeV s
Figure 2: The differential cross sections,dσ/dm4` vs. m4`, calculated by MCFM [1] from theqq¯andgg initial states at 8 TeV for the 2e2µfinal state in the ATLAS experimental fiducial phase space. The inclusivegg →4` distribution is the sum of thegg → H → 4`and thegg → Z Z → 4` plus interference terms. The calculation of theqq¯ → 4` differential production cross section, includes perturbative QCD corrections at NLO, while the distributions from thegginitial state are calculated at the LO. The NNLO K-factors [2] are applied to on-shell Higgs boson production.
been used as a tool to constrain the total Higgs-boson width by the ATLAS and CMS collaborations [10, 11].
•Non-resonantZ Z →4`production viaggF,V BFandV BSprocesses
The non-resonantZ Z→4`production viaggF,V BFandV BSprocesses include the production of off- shell Higgs bosons and continuumZ Z as well as their interference. Figure3(b) shows the non-resonant Z Zproduction process fromggF. This process produces a sizable number of 4`events inm4` > 2×mZ mass region and dominates the total gluon-initiated 4`production. Currently, the gluon-fusion production is less well estimated theoretically with only a LO QCD prediction for theggcontinuum production [8, 12].
Contributions from different processes have different strength as a function of m4` (Figure2) andpT4`. Therefore, integrated and differential 4`production cross sections are measured as a function ofm4`and pT4`. This is first performed in the experimental fiducial phase space, and then extended to a common phase space for three 4`channels: 4e, 4µ, and 2e2µ. The mass range above 180 GeV is used to determine the signal strength of the gluon-fusion component with respect to its LO prediction. This is done by fitting the observedm4`spectrum using the NNLO QCD theoretical prediction, corrected for NLO electroweak effects, for the production originating from theqq¯initial state.
H(∗) Z(∗) Z(∗)
g g
`−
`+
`−
`+
(a)
Z(∗)
Z(∗)
g g
`+
`−
`+
`−
(b)
Figure 3: The tree-level Feynman diagrams for the gg-initiated production of 4`: (a) Higgs boson production through gluon-fusion gg → H(∗) → Z Z(∗) → 4`; (b) non-resonant 4` production through quark-box diagram gg→Z(∗)Z(∗)→4`.
2 The ATLAS Detector
The ATLAS detector [13] has a cylindrical geometry1 and consists of an inner tracking detector (ID) surrounded by a 2 T superconducting solenoid, electromagnetic and hadronic calorimeters, and a muon spectrometer (MS) with a toroidal magnetic field. The ID provides tracking for charged particles for
|η| < 2.5. It consists of silicon pixel and strip detectors surrounded by a straw tube tracker that also provides transition radiation measurements for electron identification. The electromagnetic and hadronic calorimeter system covers the pseudorapidity range |η| < 4.9. For |η| < 2.5, the liquid-argon electro- magnetic calorimeter is finely segmented and plays an important role in electron identification. The MS includes fast trigger chambers (|η| < 2.4) and high-precision tracking chambers covering |η| < 2.7. A three-level trigger system selects events to be recorded for offline physics analysis.
3 Signal and background simulation
The signal modelling forqq¯ →4`production uses the POWHEG-BOX Monte Carlo (MC) program [14–
16], which includes perturbative QCD corrections at NLO. The production through theqginitial state is included in the NLO calculations. The CT10NLO [17] set of parton distribution functions (PDFs), with QCD renormalisation and factorization scales (µR, µF) set tom4`are used to calculate the cross section and generate the kinematic distributions. The NNLO QCD [18] and the NLO Electroweak (EW) [19]
corrections are applied to the NLO cross section calculated by POWHEG-BOX as a function of the 4` mass for the kinematic region where both Z bosons are produced on-shell. Following the same approach described in Ref. [10], the 4` event distributions are re-weighted to match those expected when using QCD scales ofm4`/2. This is done to unify the QCD scales used in the simulation of the qq¯and thegg processes.
1ATLAS uses a right-handed coordinate system with its origin at the nominal interaction point (IP) in the centre of the detector, and thez-axis along the beam line. Thex-axis points from the IP to the centre of the LHC ring, and they-axis points upwards.
Cylindrical coordinates (r, φ) are used in the transverse plane, φ being the azimuthal angle around the beam line. The pseudorapidity is defined in terms of the polar angleθasη=−ln tan(θ/2). Observables labelled “transverse” are projected into thex–yplane.
The signal modelling of the on-shell Higgs-boson production via ggF and V BF mechanisms uses POWHEG-BOX which provides calculations at NLO QCD, with the CT10NLO PDFs andµR, µF= m4`. The Higgs-boson production viaV Handt¯t Hmechanisms is simulated with PYTHIA8 [20]. The NNLO QCD and NLO EW effects on the cross-section calculations for on-shell Higgs-boson production are summarized in Ref. [21]. The expected event yields of on-shell Higgs boson are normalised with the higher-order corrected cross sections.
The non-resonant 4` signal production includes off-shell Higgs-boson production, continuum Z Z pro- duction, and their interference. The LO MCFM generator is used to simulate the non-resonant ggF production, with the CT10NNLO [22] set of PDFs with QCD scales ofµR, µFset tom4`/2; while the LO MADGRAPH generator [23] is used to simulate the non-resonantV BF andV BSproductions and their interference. The NNLO QCD corrections are available for the off-shell Higgs-boson production [2] and for the interference between the off-shell Higgs boson and theZ Zproduction from thegginitial state [24].
However, no higher-order corrections are available for the continuumgg→Z Zprocess, which dominates the 4`events from thegginitial state in the region outside the Higgs boson resonance. Therefore, the LO cross section is used for the normalisation of the 4`events produced in gluon-fusion processes.
All the signal MC generators are interfaced to PYTHIA8 for parton shower simulation, except MADGRAPH, which is interfaced to PYTHIA6 [25].
Backgrounds in this analysis include reconstructed 4` events from Z+jets, tt¯, diboson (ZW, Zγ and double-DY), tribosonV V V (V = Z,W) and,V H(H →V V), and Z+top (tt¯andt) processes, which are also simulated.
The reducible background fromZ+jets production, that includes light and heavy flavour contributions, is modelled using both SHERPA [26] and ALPGEN [27]. The Zγ process is simulated with SHERPA.
Thet¯tbackground is modelled using POWHEG-BOX.
Background events fromZ Hproduction, whereZ →``andH→V V(VV= WW or ZZ with two leptons and two neutrinos or two leptons and two jets in the final state), are simulated with PYTHIA8. TheZWand thet Zprocesses are simulated with SHERPA and MADGRAPH respectively. The irreducible background from V V V and t¯t Z is modelled with MADGRAPH. Finally, the double-Drell-Yan Z Z production is modelled with PYTHIA8.
The POWHEG-BOX, MADGRAPH and MCFM generators are interfaced to PYTHIA8 for the par- ton shower, hadronization and underlying event simulation. The ALPGEN generator is interfaced to HERWIG [28] for the parton shower and to JIMMY [29] for the underlying event simulation. SHERPA uses built–in models for both parton shower and underlying event description.
Both signal and background MC events are simulated using the ATLAS detector simulation [30] based on the GEANT4 [31] framework. Additional pp interactions in the same and nearby bunch crossings (pile-up) are included in the simulations. The MC samples are re-weighted to reproduce the observed distribution of the mean number of interactions per bunch crossing observed in the data.
4 Event Reconstruction and Selection
The following event selection criteria are applied to the events collected with a single-lepton or di-lepton trigger. The transverse momentum and transverse energy thresholds for the single-muon and single- electron triggers are 24 GeV. Two dimuon triggers are used, one with symmetric thresholds at 13 GeV
and the other with asymmetric thresholds at 18 GeV and 8 GeV. For the dielectron trigger the symmetric thresholds are 12 GeV. Furthermore there is an electron-muon trigger with thresholds at 12 GeV (electron) and 8 GeV (muon).
A primary vertex reconstructed from at least three well-reconstructed charged particle tracks, each with pT > 0.4 GeV is required in order to remove non-collision background and ensure good object recon- struction. For events with more than one primary vertex, the vertex with the largestP
pT2 of the associated tracks is selected.
Electron candidates are reconstructed from a combination of a cluster of energy deposits in the elec- tromagnetic calorimeter and a track in the ID. They are required to have pT > 7 GeV and |η| < 2.47.
Candidate electrons must satisfy a loose set of identification criteria based on a likelihood built from parameters characterizing the shower shape and track association as described in Ref. [32].
Muon identification is performed according to several criteria based on the information from the ID, the MS, and the calorimeter sub-detector systems. The different types of reconstructed muons are: a) Combined (CB), which is the combination of tracks reconstructed independently in the ID and MS; b) Stand-Alone (SA), where the muon trajectory is reconstructed only in the MS; c) Segment-tagged (ST), where a track in the ID is associated with at least one local track segment in the MS; and d) Calorimeter- tagged (CaloTag), where a track in the ID is identified as a muon if it is associated to a minimum ionizing particle energy deposit in the calorimeter system.
The acceptance coverage range for both CB and ST muons is|η| < 2.5, while the SA muons are used to extend the |η| acceptance from 2.5 to 2.7. which is not covered by the ID. CaloTag muons are used in the rapidity range|η| <0.1 where there is incomplete MS coverage. All muon candidates are required to havepT >6 GeV.
In order to reject electrons and muons from jets, only isolated leptons are selected. Two isolation requirements are used, one for the ID and one for the calorimeter. For the ID, the requirement is that the scalar sum of the transverse momenta,P
pT, of all tracks inside a cone of∆R≡ p
(∆η)2+(∆φ)2 = 0.2 around the lepton, excluding the lepton itself, be less than 15% of the leptonpT. For the calorimeter, the PETdeposited inside a cone of∆R=0.2 around the lepton, excluding the lepton itself and corrected for contributions from pile-up and, in the case of electrons, shower leakage, is required to be less than 30%
of the muonET (15% for SA muons) and 20% of the electronET.
At the closest approach to the primary vertex, the ratio of the transverse impact parameter d0 to its uncertainty (d0significance) must be smaller than 3.5 (6.5) for muons (electrons) to further reject leptons from heavy flavour decays. The looser electron requirement accounts for the tails in the electron impact parameter distribution due to bremsstrahlung in the ID. The longitudinal impact parameter,|z0|, must be less than 10 mm for both electrons and muons (no requirement is applied on SA muons).
Selection of lepton quadruplets is done separately in each channel: 4µ,2e2µ,4e, keeping only a single quadruplet per channel. The inclusion of final-state radiation to charged leptons has followed the same approach described in Ref. [33]. Candidate quadruplets are formed by selecting two opposite-sign, same- flavour lepton pairs (`+`−). The two leading-pT leptons of the quadruplet must havepT >20 and 15 GeV, respectively, while the third lepton must have pT > 10 (8) GeV if it is an electron (muon). The four leptons of a quadruplet are required to be separated from each other by∆R>0.1(0.2)for same (different) flavour. Only events where the selected leptons fire the triggers used in this analysis are accepted. At most one SA or a CaloTag muon is allowed in each quadruplet.
For each channel, the lepton pair with the mass closest to the Z boson mass is selected as the leading dilepton pair and its invariant mass,m12, is required to be between 50 and 120 GeV, while, due to kinematic cuts in the generated signal samples, its transverse momentum should be above 2 GeV. The sub-leading
`+`− pair with the largest invariant mass, m34, among the remaining possible pairs, is selected in the invariant mass range 12< m34<120 GeV.
In the 4e and 4µchannels all possible`+`− pairs are required to have m`+`− > 5 GeV, to reject events containingJ/ψ →`+`−decays.
There is no jet requirement for 4`event selection, and all the selected 4`events must lie in the 80< m4` <
1000 GeV range.
5 Background Estimation
The dominant reducible sources of background for this analysis are fromZ+jets andt¯tprocesses and are estimated from data. Contributions fromZW,Zγ,t Zas well as from the irreducible backgrounds from tt Z¯ ,V V V, Z Hand double-DY processes are estimated from simulation.
The reducible background is estimated separately for the two different final states: ``+ µµand``+ee, where `` (` = e, µ) is the leading lepton pair. The ``+ µµ background arises from Z +jets and t¯t processes where the Z +jets contribution involves the associated production of a Z boson and heavy flavoured hadrons, which decay semi-leptonically, and a component arising from Z + light-flavour jets with subsequentπ/Kin-flight decays.
The background for``+eefinal states arises from jets misidentified as electrons, which can be light- flavour hadrons misidentified as electrons, photon conversions reconstructed as electrons and non-isolated electrons from heavy-flavour hadronic decays.
For both the ``+ µµ and the ``+ee cases, the number of background events is estimated from a fit performed simultaneously to three orthogonal control regions, each of them providing information on one or more background components. The fit is based on the mass of the leading dilepton,m12, which peaks at the Z mass for the Z+jets component and has a broad distribution for thet¯t component. The three control regions are fit simultaneously to extract the different components of the reducible background, using a profile likelihood approach where the input template shapes forZ+jets andt¯tare obtained from simulation. The fitted yields in the control regions are extrapolated to the signal region using efficiencies, referred to as transfer factors, obtained from simulation.
``+µµbackground control regions.The three control regions are defined based on the impact parameter significance and isolation variables of the sub-leading muon pair and are constructed as follows:
• A heavy flavour enriched control region where at least one of the muons in the second pair fails the impact parameter significance requirement while the isolation requirement is relaxed;
• A light flavour enriched control region where at least one of the muons in the second pair fails the isolation requirement but passes the impact parameter significance cut;
• Att¯enriched region where the leading lepton pair is made of opposite sign and different flavour leptons while for the muons of the second pair there is no charge requirement, the isolation cut is relaxed and the muons fail the impact parameter requirement.
A fourth``µµregion is populated by bothZ+jets andtt¯. The leading lepton pair is required to fulfill the full selection criteria, while there is neither isolation nor impact parameter requirements on the sub-leading muon pair. This region is used as the validation region to check the fit results and verify the agreement between data and MC.
``+eebackground control regions.The three control regions are defined based on the impact parameter significance, isolation and electron identification requirements on the second electron pair. In all control regions at least one of the electrons in the second pair is required to fail the identification criteria. These regions are constructed as follows:
• AZ +jets enriched control region where at least one of the electrons of the second pair fails the track isolation and no calorimeter isolation is required;
• An additionalZ+jets enriched control region where no charge requirement is made on the electrons of the second pair, while at least one of these electrons fails the impact parameter selection and no calorimeter or track isolation is required;
• At¯t enriched region, where the leading lepton pair is selected from opposite sign and different flavour leptons while there is no charge requirement for the sub-leading electron pair. At least one of the electrons of the second pair fails the calorimeter isolation requirement and neither track isolation nor impact parameter requirements are applied.
A validation region for the``eechannel is defined by dropping the calorimeter isolation and requesting that at least one electron in the sub-leading pair fails the electron identification. Each candidate in the pair is required to pass the impact parameter and the track isolation selections. Similarly to the``+ µµcase, this region is used to check the fit outcome and verify the resulting agreement between data and MC.
The residual contributions fromZ ZandZW production in all control regions are estimated from simula- tion. The purity of theZ+jets andtt¯backgrounds in the control regions is above 95%.
In the validation regions, the post-fit MC predictions agree with the data within the statistical uncertainty.
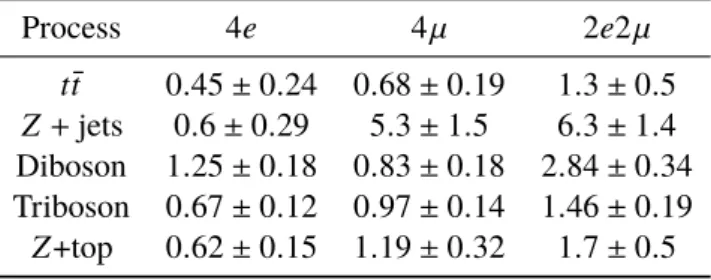
The background estimations from data and MC are shown in Table1.
The major uncertainties for the fitted reducible background come from the control sample statistics followed by the systematic uncertainty in the transfer factors. The latter is evaluated from the difference in the selection efficiency determined in data and simulation in dedicated control regions using leptons accompanying Z →`+`− candidates, where the leptons composing the Z boson candidate are required to satisfy isolation and impact parameter criteria. Events with four leptons are excluded. For the MC estimated background the systematic uncertainties mainly come from theoretical cross section uncertainties for different processes and from luminosity uncertainties in normalisations. The differential distributions for all background processes are taken from simulation.
The background estimation has been cross-checked with an alternative method, described in Ref. [3,34], called fake-factor method. The results from this cross-check are found to be consistent within uncertainties with those described above.
Table 1: Number of background events expected per channel.
Process 4e 4µ 2e2µ
t¯t 0.45±0.24 0.68±0.19 1.3±0.5 Z+jets 0.6±0.29 5.3±1.5 6.3±1.4 Diboson 1.25±0.18 0.83±0.18 2.84±0.34 Triboson 0.67±0.12 0.97±0.14 1.46±0.19 Z+top 0.62±0.15 1.19±0.32 1.7±0.5
6 Cross section extraction method
Two cross sections are extracted from the number of observed events. One is the fiducial cross section, σfid
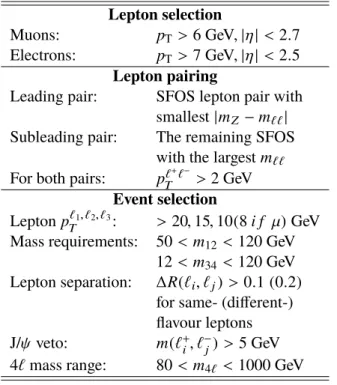
4l, in the experimental phase space defined by the event selection criteria and the other is the cross section,σ4lext, in an extended common phase space where electrons and muons have the same geometric and kinematic acceptance. The fiducial phase space is defined in Table2. The extended phase space for the 4`cross-section extraction is defined by 80< m4` < 1000 GeV,m`+`− > 4 GeV, pTZ1,2 > 2 GeV, 4 leptons each withpT >5 GeV and|η| <2.8.
The cross section measurement is performed using a likelihood fit described below. For a given channeli, the observed number of events,Ni
obs, follows a Poisson distribution, Pois(Ni
obs,Ni
pred), the mean of which, Ni
pred = Nsi+Nbi, is the sum of the expectations for signal and background yields. These yields depend on the fiducial cross section and the nuisance parameters,~x, which represent the experimental and theoretical uncertainties as the following:
Nsi(σfid
4l,~x) = Nsi(σfid
4l,0)(1+X
k
xkSki), (1)
Nbi(~x) = Nbi(0)(1+X
k
xkBki), (2)
whereSki andBik are the relative systematic effects on the signal and background, respectively, due to the k-th source of systematic uncertainty. The central expectation of the signal yield, corresponding to the systematic sources at the nominal value (referred to as the nuisance-free expectation), is given by :
Nsi(σfid
4l,0) =L ·C4`·Kτ·σfid
4l (3)
whereLis the integrated luminosity, andC4`is the ratio of the number of accepted signal events to the number of generated events in the fiducial phase space. Corrections are applied toC4` to account for measured differences in trigger and reconstruction efficiencies between simulated and data samples and for the extrapolation to the fiducial phase space. TheC4`values are 53.3%, 82.2% and 67.7% for 4e, 4µ, and 2e2µchannels, respectively. The contribution fromτ-lepton decays is removed by a correction term Kτ =1+ NNτMCMC
sig
, where NτMCis the number of accepted simulated 4`events in which at least one of theZ bosons decays intoτ-lepton pairs, andNMC
sig is the number of accepted simulatedZ Zevents with decays into electrons or muons.
Cross-section measurements are extracted for a single channel or any combination of channels, using a likelihood method. The likelihood function is:
L(σfid
4l,~x)=Y
i
Pois(Ni
obs,Ni
pred(σfid
4l,~x))·e−~x
2
2 (4)
Table 2: List of selection cuts which define the fiducial region of the cross section measurement. Same flavour opposite sign lepton pairs are denoted as SFOS, the leading lepton pair mass asm12, and the sub-leading lepton pair mass as m34. The four-momenta of all final state photons within ∆R = 0.1 of a lepton are added to the four-momentum of that lepton.
Lepton selection
Muons: pT >6 GeV,|η| <2.7 Electrons: pT >7 GeV,|η| <2.5
Lepton pairing
Leading pair: SFOS lepton pair with smallest|mZ−m``| Subleading pair: The remaining SFOS
with the largestm``
For both pairs: pT`+`− >2 GeV Event selection
Leptonp`T1,`2,`3: > 20,15,10(8i f µ)GeV Mass requirements: 50< m12 <120 GeV
12< m34 <120 GeV Lepton separation: ∆R(`i, `j) > 0.1(0.2)
for same- (different-) flavour leptons J/ψveto: m(`+i, `−j) >5 GeV 4`mass range: 80< m4` <1000 GeV where the product runs over the channels to be considered.
For the extended phase space the likelihood function is parametrized as a function of the extended cross section similar to the one shown in the equation3. and multiplied by the fiducial acceptance A4`, which is the ratio of the number of events within the fiducial phase space region to the total number of generated events in the extended phase space. The fiducial acceptance A4` are evaluated using simulation to be 41.6%, 50.3%, 42.2%, for 4e, 4µ, and 2e2µchannels, respectively. The differences are due to the electron and muon geometric detection coverage.
To find the central value of cross sectionσ, the likelihood function is maximized simultaneously for the nuisance parameters andσ. Correlations between the signal and background systematic uncertainties are taken into account in the likelihood fitting procedure.
7 Systematic Uncertainties
Systematic uncertainties on the measurement arise from uncertainties on the integrated luminosity, the experimental calibrations of the energy and momentum, and the lepton detection efficiencies, as well as the theoretical modelling of signal acceptance, and the background estimation.
The overall uncertainty in the integrated luminosity is±2.8% as described in Ref. [35].
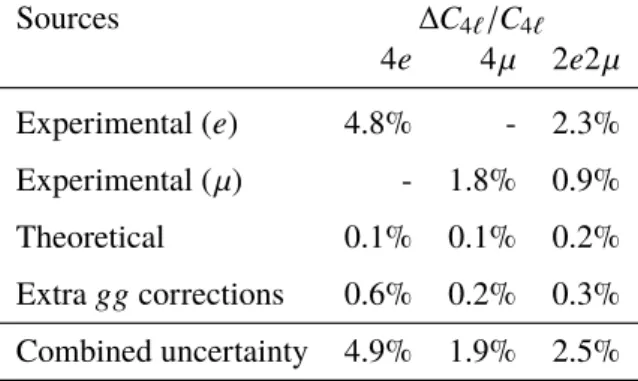
A summary of the uncertainties inC4`,A4`, andA4`×C4`is given in Tables3and4.
The effect on the expected signal event yields due to experimental systematic uncertainties is determined from the uncertainties on lepton energy and momentum scales and resolutions, as well as the uncertainties on efficiencies of the lepton reconstruction and identification. The major uncertainties come from the uncertainties on lepton reconstruction and identification efficiencies [36–38].
The uncertainties on the signal acceptance for bothC4`andA4`include theoretical uncertainties from the choice of QCD scales and PDF set. The scales are varied independently from 0.5 to 2.0 times the nominal values of µR and µF. The PDFs uncertainties are estimated by using the envelope [39] of variations of different PDF sets, CT10, MSTW2008 [40] and NNPDF2.3 [41].
TheC4` uncertainty is mostly experimental and of order of 2-5%, while the A4` uncertainty is entirely theoretical and of order of 3-5%. The relative uncertainties on theC4`factors are 4.9%, 1.9%, and 2.5%
for 4e, 4µ, and 2e2µ, respectively. The uncertainties onC4` due to higher-order corrections to the gg production processes are less than 0.6%. This is estimated by applying an approximate NNLO K-factor determined for the Higgs-boson production, assuming that it is applicable to the normalization of the continuumgg→Z Zproduction cross section.
Uncertainties on theC4`, as a function ofm4`andpT4`, are also computed for the differential cross section measurements. In the low mass region (m4` < 150 GeV), the relative uncertainties onC4` vary from 4-9%, 1.7-2.7%, and 2-5% for 4e, 4µ, and 2e2µchannel, respectively. In the mass regionm4` >150 GeV, they are mostly flat as a function ofm4`and are about 4%, 1.8%, and 3% for 4e, 4µ, and 2e2µchannel, respectively.
The relative uncertainties on theA4`are 1.2%, 1.0%, and 1.6% for 4e, 4µ, and 2e2µchannel, respectively, evaluated by comparing POWHEG-BOX and MCFM MC samples with the same approach for the QCD scales and the PDF uncertainties as described earlier. The QCD scale uncertainties do not change when going from NLO to NNLO for the signal normalisation for the qq¯ → 4` events [18]. An additional uncertainty (3-4%) is included in theA4`uncertainty estimate to account for the uncertainty of the Higgs boson NNLO K-factor normalisation correction of the non-resonant 4`signal from gluon fusion (labelled
“extra gg corrections” in Tables3and4).
The largest source of systematic uncertainty on the cross section in the extended phase space is the theoretical uncertainty on the K-factors (4.6%) followed by the electron identification (4.1%).
Table 3: The combined uncertainties on the efficiency correction factorC4`, evaluated by the quadratic sum of the uncertainties from different sources, including electron and muon identification and theoretical uncertainties due to PDFs, QCD scales, and parton shower modelling. Extra uncertainties due to higher-order corrections for thegg process (NNLO K-factors for Higgs boson production applied to the inclusiveggprocess) are also given.
Sources ∆C4`/C4`
4e 4µ 2e2µ Experimental (e) 4.8% - 2.3%
Experimental (µ) - 1.8% 0.9%
Theoretical 0.1% 0.1% 0.2%
Extraggcorrections 0.6% 0.2% 0.3%
Combined uncertainty 4.9% 1.9% 2.5%
Table 4: Theoretical uncertainties on A4` andA4`×C4` due to PDFs, QCD scales and parton shower modelling.
Extra uncertainties due to higher-order corrections for theggprocess (NNLO K-factors for Higgs boson production applied to the inclusiveggprocess) are also given.
∆A4`/A4`
Sources 4e 4µ 2e2µ
Theoretical 1.2% 1.0% 1.6%
Extraggcorrections 4.0% 3.0% 3.9%
∆(A4`×C4`)/(A4`×C4`)
Theoretical 1.4% 1.1% 1.7%
Extraggcorrections 4.6% 3.2% 4.2%
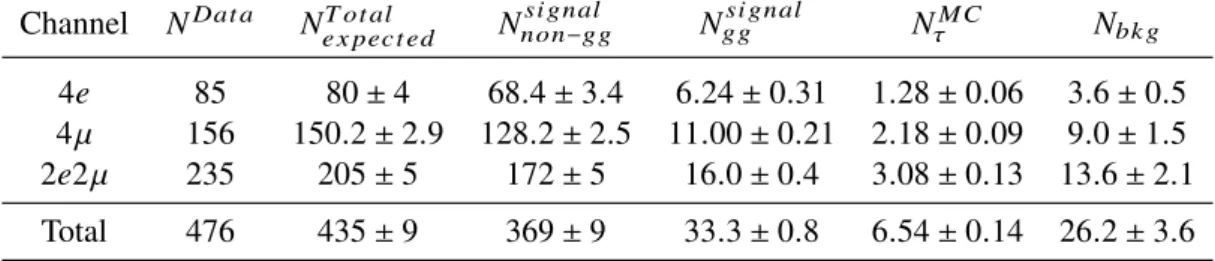
Table 5: Summary of the observed and predicted number of 4` events in different 4` channels. NDat a denotes the selected number of data candidates. Ne x pec t edT ot al denotes the total predicted number of events (including τ contributions) for signal plus background. Nno n−ggsi gnal and theNggsi gnal denote the predicted non-gg signal and the ggsignal (no NNLO K-factor has been applied), respectively. NτMCdenotes the number ofτcontributions. Nbk g denotes the total estimated number of background events (from data and MC). The listed uncertainties include statistical and experimental systematic uncertainties. The theoretical uncertainties are not included.
Channel NDat a Ne x pec t edT ot al Nno n−ggsi gnal Nggsi gnal NτMC Nbk g 4e 85 80±4 68.4±3.4 6.24±0.31 1.28±0.06 3.6±0.5 4µ 156 150.2±2.9 128.2±2.5 11.00±0.21 2.18±0.09 9.0±1.5 2e2µ 235 205±5 172±5 16.0±0.4 3.08±0.13 13.6±2.1 Total 476 435±9 369±9 33.3±0.8 6.54±0.14 26.2±3.6 The overall uncertainty on the background estimation is 12%. The contributions from different sources and channels are already given in Table1.
8 Results
8.1 Cross-section Measurements
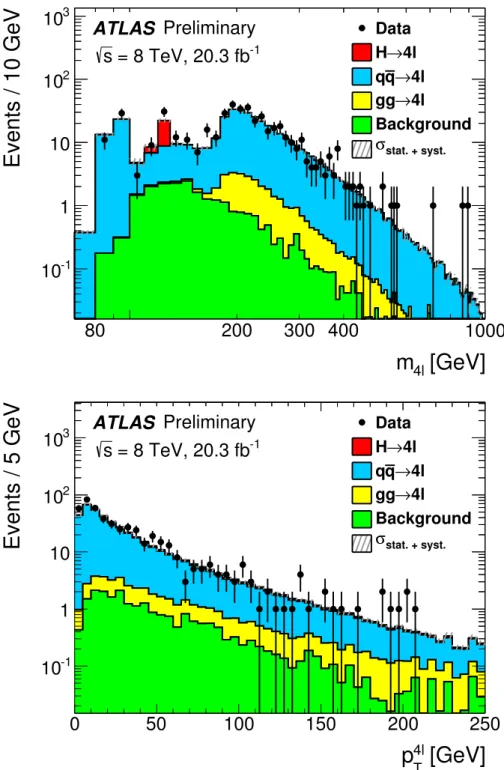
The numbers of expected and observed events after applying all selection criteria are shown in Table5.
A total of 476 candidate events is observed with a background expectation of 26.2±3.6 events. The observed and predictedm4`andp4Tl distributions for the selected events are shown in Figure4.
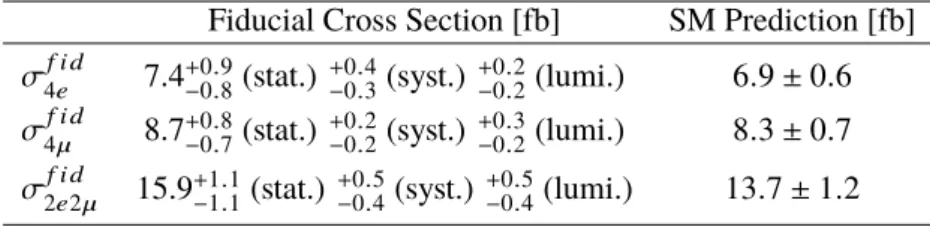
The measured cross sections in the fiducial and extended phase space for different 4`channels and their combinations are summarised in Tables 6and7 respectively, and compared to the SM predicted cross sections. One should note that the cross section for non-resonant Z Z production from thegg-induced signal is only calculated at LO approximation, which could be significantly under estimated.
Table 6: Measured fiducial cross sectionsσf i d
4e ,σf i d
4µ , andσf i d
2e2µ, compared to their SM prediction. One should note that the non-resonantgg-induced signal cross section is only calculated at LO approximation.
Fiducial Cross Section [fb] SM Prediction [fb]
σf i d
4e 7.4+0−0..98(stat.) +0−0..43(syst.) +0−0..22(lumi.) 6.9±0.6 σf i d
4µ 8.7+0.8−0.7(stat.) +0.2−0.2(syst.) +0.3−0.2(lumi.) 8.3±0.7 σf i d
2e2µ 15.9+1−1..11(stat.) +0−0..54(syst.) +0−0..54(lumi.) 13.7±1.2 Table 7: Measured cross sections in the extended phase space,σe x t
4e ,σe x t
4µ ,σe x t
2e2µ, and their combinations, compared to their SM prediction. One should note that the non-resonantgg-induced signal cross section is only calculated at LO approximation.
Cross Section in the extended phase space [fb] SM Prediction [fb]
σe x t4e 17.8+2−2..10(stat.) +1−1..51(syst.) +0− .5
0.5(lumi.) 16.4±1.4 σe x t
4µ 17.3+1−1..54(stat.) +0−0..97(syst.) +0−0..55(lumi.) 16.4±1.4 Combinedσe x t
4e+4µ 35.0+2−2..43(stat.) +1−1..95(syst.) +1−1..10(lumi.) 32.9±1.9 σe x t
2e2µ 37.7+2−2..76(stat.) +2−2..50(syst.) +1−1..11(lumi.) 32.1±2.0 Combinedσe x t
4` 73+4−4(stat.) +4−4(syst.)+2−2(lumi.) 65±4 8.2 Differential Cross-Section Measurement
The measurement of the differential cross section is performed in the fiducial phase space defined in Table2. The events from all the three 4`channels are combined into a common sample for the unfolding procedure explained below. The unfolding is done as a function of the two kinematic variables m4` andp4T`. Them4` spectrum is essential for the study of the different production mechanisms, while the pT4`spectrum is sensitive to the higher-order QCD corrections and to QCD resummation effects at small pT4`[12]. The highpT4`region is sensitive to top-loop effects ingg→Hproduction as well as to anomalous triple-boson couplings.
The measured distributions can be corrected for detector effects, namely resolution, acceptance and efficiency, through the process of unfolding. The unfolding procedure converts the measured distributions into particle-level distributions enabling comparisons with theoretical predictions.
The iterative Bayesian unfolding proposed in Ref. [42] is applied here. In the unfolding of binned data, the effects of the experimental acceptance and resolution are expressed in terms of a response matrix, where each element corresponds to the probability of an event in thei-th truth bin being reconstructed in the j-th measured bin. The response matrix is combined with the measured spectrum to form a likelihood, which is then multiplied by a prior distribution to produce the posterior probability of the true spectrum. The SM prediction is used as the initial prior, and once the posterior probability is obtained, it is used as the prior for the next iteration after smoothing. The spectrum becomes insensitive to the initial prior after a few iterations. The differences between successive iterations can be used to estimate the stability of the unfolding method. In this analysis four iterations have been performed.
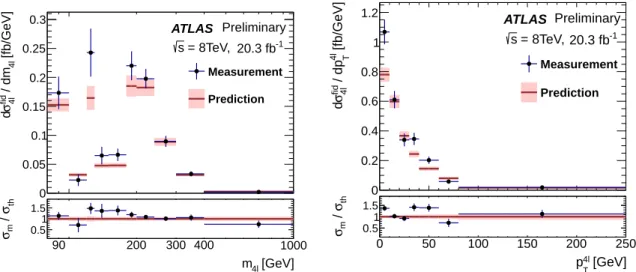
The unfolded distributions are shown in Figure5, where the differential cross section is presented as
a function ofm4` and pT4` and compared to theory predictions. The black points shown in the figures are the measurements with combined statistical and systematic uncertainties. The theoretical predictions are the sum of the differential cross sections of theqq¯ → 4` and gg → 4` processes. The LO cross sections are used for the non-resonantgg-induced signals. The cross sections of the on-shell Higgs boson are normalized to include the NNLO QCD and NLO EW effects as summarized in Ref. [21]. Theqq¯ productions are corrected with the NNLO QCD and the NLO EW K-factors for them4` spectrum for m4` > 2×mZ. For the p4T` spectrum, theqq¯ signal prediction is calculated by POWHEG-BOX at NLO QCD.
The uncertainties on the differential cross section measurements are dominated by the statistical uncertain- ties of the data in each bin. For example, in them4`regions between the Z- and theH-peak and between the Higgs-boson massmH andm4` < 180 GeV, the statistical uncertainties are of the order of 45% and 20%, respectively. In the high mass region (m4`> 180 GeV) they are of the order of 10%. Furthermore, one should note that the NNLO QCD corrections are missing for theqq¯ →4`production calculation for the mass regionm4` <2×mZ.
In them4` bin of 120-130 GeV, which is dominated by the resonant Higgs-boson contribution, the ratio of data over MC prediction is compatible with the ATLAS measurement [33] of the Higgs-boson signal strength of µH = 1.44+0−0..4033. The data points in the m4` spectrum between 140 to 180 GeV are slightly more than 1σabove the theoretical predictions, which could be due to the missing higher-order correction just noted. Some discrepancy is also observed in the lowest bin and in the region between 30 - 50 GeV of thepT4`spectrum.
8.3 Extraction of theggSignal Contribution in the m4` > 180 GeV Region
The extraction of the signal strength of the non-resonantgg→4`production is performed in the high mass region,m4` > 180 GeV, where this production mode is dominated by the continuumgg → Z Z through a quark-box diagram intermediate state. Additional contributions come from the off-shell Higgs-boson production and the interference between Higgs boson and continuumZ Z.
Them4`variable is chosen as the discriminant to extract theggsignal strength with respect to the LOgg prediction: µgg =σ(data)/σ(LO).
The contribution of theqq¯ →Z Zproduction is constraint to the best theory knowledge (which accounts for QCD NNLO and EW NLOm4l-dependent corrections) andµggis extracted from a likelihood fit using the reconstructedm4`distributions. The likelihood function is built similar to the method employed for measuring the integrated cross sections (Section6). The experimental uncertainties are treated as fully correlated betweenqq¯andggprocesses. The theoretical uncertainties, including the uncertainties on the normalisation of theqq¯→ Z Z→4`, the shapes of 4`spectra from both theqq¯andgginitial states, and the acceptance described in Section7, are taken into account. Them4`distribution of the data, the fit, the expectation from non-ggsignal processes and the background are shown in Figure6for comparison. The fit result is
µgg = 2.4±1.0(stat.)±0.5(syst.)±0.8(t heory),
which corresponds to agg-induced cross section of 3.1 fb with the same relative uncertainties as µgg itself in the inclusive fiducial volume as defined in Table2with the additional requirement ofm4` >180 GeV. The largest uncertainty is statistical. The theoretical uncertainty is also sizable due to normalisation uncertainty of theqq¯ →Z Zprocess.
The theoretical estimation ofm4`-dependent K-factor for off-shell Higgs-boson production given in Ref. [2]
is approximately 2.7-3.1 (with CT10NNLO PDF) and that given in Ref. [24] for the interference term are 2.05-2.45. These are compatible with the result obtained by this analysis, where thegg-induced events are predominantly from the continuumZ Zproduction mechanism. Applying the higher-order corrections to both the cross section of the off-shell Higgs-boson production and the contribution of the interference term, while keeping the LO cross section for the continuumgg→ Z Z, the relative change of theµgg fit result is negligible (approximatively 0.35%).
[GeV]
m
4l80 200 300 400 1000
Events / 10 GeV
10-1
1 10 102
103 ATLAS Preliminary = 8 TeV, 20.3 fb-1
s
Data 4l H→
4l q→ q
4l gg→
Background
stat. + syst.
σ
[GeV]
4l
p
T0 50 100 150 200 250
Events / 5 GeV
10-1
1 10 102
103
ATLAS Preliminary = 8 TeV, 20.3 fb-1
s
Data 4l H→
4l q→ q
4l gg→
Background
stat. + syst.
σ
Figure 4: Data and MC prediction comparison for selected events as a function of the invariant massm4`(top) and the transverse momentump4Tl(bottom) of the four-lepton system. The solid colours show the expected contributions from signal and background and the black points represent data with statistical error bars.
[fb/GeV]4l / dm4lfidσd
0 0.05 0.1 0.15
0.2 0.25 0.3
= 8TeV,
s 20.3 fb-1 ATLAS Preliminary
Measurement Prediction
[GeV]
m4l
90 200 300 400 1000
thσ / mσ 0.5
1 1.5
[fb/GeV]4l T / dp4lfidσd
0 0.2 0.4 0.6 0.8 1 1.2
= 8TeV,
s 20.3 fb-1 ATLAS Preliminary
Measurement Prediction
[GeV]
4l
pT
0 50 100 150 200 250
thσ / mσ 0.5
1 1.5
Figure 5: The measured differential cross-section distributions (the black points) of m4` (left) and p4T` (right), unfolded into the fiducial volume, and compared to theory predictions (red histogram). The combined statistical and systematic uncertainties of the measurements are shown as the error-bars of the unfolded spectra. The theoretical predictions are the sum of the differential cross sections of theqq¯ → 4` andgg → 4`processes, where the LO cross sections are used for the non-resonantgg-induced signals, and the cross sections of the on-shell Higgs boson and theqq¯productions are corrected with the NNLO K-factors for them4`spectrum; but forp4`T, the NLO and LO predictions are used for theqq¯and theggprocess, respectively. The total theoretical uncertainties are shown as error bands evaluated by the quadratic sum of the contributions from parton showers, QCD scales, PDF sets, and electroweak corrections.
[GeV]
M
4l200 300 400 500 1000
Events / 20 GeV
0 10 20 30 40 50 60 70 80
Data Fit
Non-ggZZ Signal Background
= 8TeV,
s 20.3 fb-1
ATLAS Preliminary
Figure 6: Comparison of them4` spectra between the data (black points with error-bars) and the prediction (red histogram) after the likelihood fit ofµgg. The non-ggsignal from the theoretical prediction (blue histogram) and the background (brown histogram) are also shown. Theggcontribution is the difference between data and the sum of the non-ggsignal and the background.
9 Summary and Conclusion
The measurement of four-lepton production in proton-proton collisions at
√s=8 TeV is presented using data corresponding to an integrated luminosity of 20.3 fb−1 collected with the ATLAS detector at the LHC. In total, 476 4`candidate events are observed, with a background expectation of 26.2±3.6 events, in the four-lepton invariant mass range between 80 and 1000 GeV. The 4`production cross sections are determined in both fiducial and extended phase spaces. The measured cross section in the extended phase space, defined by 80< m4` < 1000 GeV,m`+`− > 4 GeV, pTZ1,2 > 2 GeV, 4 leptons each with pT > 5 GeV and |η| < 2.8, is found to be 73±4 (stat.)±4 (syst.)±2 (lumi.) fb, and is compared to a SM prediction of 65±4 fb. The first measurements at the LHC of the 4`differential cross sections are performed by unfolding the m4` and the p4T` spectra. In the mass range above 180 GeV, assuming the theoretical constraint on theqq¯ production cross section calculated with perturbative NNLO QCD and NLO Electroweak corrections, the signal strength of the gluon-fusion component with respect to the LO prediction is determined to beµgg =2.4±1.0(stat.)±0.5(syst.)±0.8(t heory).
Acknowledgements
We thank CERN for the very successful operation of the LHC, as well as the support staff from our institutions without whom ATLAS could not be operated efficiently.
We acknowledge the support of ANPCyT, Argentina; YerPhI, Armenia; ARC, Australia; BMWFW and FWF, Austria; ANAS, Azerbaijan; SSTC, Belarus; CNPq and FAPESP, Brazil; NSERC, NRC and CFI, Canada; CERN; CONICYT, Chile; CAS, MOST and NSFC, China; COLCIENCIAS, Colombia; MSMT CR, MPO CR and VSC CR, Czech Republic; DNRF, DNSRC and Lundbeck Foundation, Denmark;
EPLANET, ERC and NSRF, European Union; IN2P3-CNRS, CEA-DSM/IRFU, France; GNSF, Georgia;
BMBF, DFG, HGF, MPG and AvH Foundation, Germany; GSRT and NSRF, Greece; RGC, Hong Kong SAR, China; ISF, MINERVA, GIF, I-CORE and Benoziyo Center, Israel; INFN, Italy; MEXT and JSPS, Japan; CNRST, Morocco; FOM and NWO, Netherlands; BRF and RCN, Norway; MNiSW and NCN, Poland; GRICES and FCT, Portugal; MNE/IFA, Romania; MES of Russia and NRC KI, Russian Federation; JINR; MSTD, Serbia; MSSR, Slovakia; ARRS and MIZŠ, Slovenia; DST/NRF, South Africa;
MINECO, Spain; SRC and Wallenberg Foundation, Sweden; SER, SNSF and Cantons of Bern and Geneva, Switzerland; NSC, Taiwan; TAEK, Turkey; STFC, the Royal Society and Leverhulme Trust, United Kingdom; DOE and NSF, United States of America.
The crucial computing support from all WLCG partners is acknowledged gratefully, in particular from CERN and the ATLAS Tier-1 facilities at TRIUMF (Canada), NDGF (Denmark, Norway, Sweden), CC-IN2P3 (France), KIT/GridKA (Germany), INFN-CNAF (Italy), NL-T1 (Netherlands), PIC (Spain), ASGC (Taiwan), RAL (UK) and BNL (USA) and in the Tier-2 facilities worldwide.
References
[1] J. M. Campbell, R. K. Ellis and C. Williams,
Bounding the Higgs width at the LHC using full analytic results forgg−> e−e+µ−µ+, JHEP1404(2014) 060, arXiv:1311.3589 [hep-ph].
[2] G. Passarino,Higgs CAT(2013), arXiv:1312.2397 [hep-ph].
[3] ATLAS Collaboration,Measurements of Four-Lepton Production at the ZResonance inpp Collisions at√
s=7and 8 TeV with ATLAS, Phys. Rev. Lett.112,(2014) 231806, arXiv:1403.5657 [hep-ex].
[4] CMS Collaboration,Observation of Z decays to four leptons with the CMS detector at the LHC, J. High Energy PHys.2012.12 (2012), arXiv:1210.3844 [hep-ex].
[5] ATLAS Collaboration,Observation of a new particle in the search for the Standard Model Higgs boson with the ATLAS detector at the LHC, Physics Letters B716,(2012) 1, issn: 0370-2693, arXiv:1207.7214 [hep-ex].
[6] CMS Collaboration,
Observation of a new boson at a mass of 125 GeV with the CMS experiment at the LHC, Physics Letters B716,(2012) 30, issn: 0370-2693, arXiv:1207.7235 [hep-ex]. [7] N. Kauer and G. Passarino,
Inadequacy of zero-width approximation for a light Higgs boson signal, JHEP1208(2012) 116, arXiv:1206.4803 [hep-ph].
[8] F. Caola and K. Melnikov,Constraining the Higgs boson width with ZZ production at the LHC, Phys.Rev.D88(2013) 054024, arXiv:1307.4935 [hep-ph].
[9] S. Goria, G. Passarino and D. Rosco,The Higgs Boson Lineshape, Nucl.Phys.B864(2012) 530–579, arXiv:1112.5517 [hep-ph].
[10] ATLAS Collaboration,Determination of the off-shell Higgs boson signal strength in the high-mass Z ZandW W final states with the ATLAS detector(2015),
arXiv:1503.01060 [hep-ex]. [11] CMS Collaboration,
Constraints on the Higgs boson width from off-shell production and decay to Z-boson pairs, Physics Letters B736,(2014) 64, issn: 1405.3455, arXiv:1405.3455 [hep-ex].
[12] M. Grazzini et al.,
Transverse-momentum resummation for vector-boson pair production at NNLL+NNLO(2015), arXiv:1507.02565 [hep-ph].
[13] ATLAS Collaboration,The ATLAS experiment at the CERN Large Hadron Collider, JINST3,(2008) S08003.
[14] T. Melia et al.,W+W-, WZ and ZZ production in the POWHEG BOX, JHEP1111(2011) 078, arXiv:1107.5051 [hep-ph].
[15] S. Alioli et al.,A general framework for implementing NLO calculations in shower Monte Carlo programs: the POWHEG BOX, JHEP1006(2010) 043, arXiv:1002.2581 [hep-ph].
[16] P. Nason,A New method for combining NLO QCD with shower Monte Carlo algorithms, JHEP0411(2004) 040, arXiv:hep-ph/0409146 [hep-ph].
[17] H.-L. Lai et al.,New parton distributions for collider physics, Phys.Rev.D82(2010) 074024, arXiv:1007.2241 [hep-ph].
[18] F. Cascioli et al.,ZZ production at hadron colliders in NNLO QCD, Phys.Lett.B735(2014) 311–313, arXiv:1405.2219 [hep-ph]. [19] A. Bierweiler, T. Kasprzik and J. H. K ¨uhn,
Vector-boson pair production at the LHC to O(α3) accuracy(2013), arXiv:1305.5402 [hep-ph].
![Figure 2: The differential cross sections, dσ/dm 4` vs. m 4` , calculated by MCFM [1] from the q q ¯ and gg initial states at 8 TeV for the 2 e 2 µ final state in the ATLAS experimental fiducial phase space](https://thumb-eu.123doks.com/thumbv2/1library_info/4013737.1541270/3.892.206.671.175.536/figure-differential-sections-calculated-initial-states-experimental-fiducial.webp)