ATLAS-CONF-2015-056 28September2015
ATLAS NOTE
ATLAS-CONF-2015-56
27th September 2015
Measurement of W → µν production in p + Pb collision at
√ s
NN= 5.02 TeV with the ATLAS detector at the LHC
The ATLAS Collaboration
Abstract
The ATLAS collaboration studied W → µν production in p+Pb collisions at √ sNN = 5.02TeV using 28.1±0.8nb−1of data. The dependence of the cross section on the pseudora- pidity of the muons from inclusiveW → µνdecays is presented as well as forW+→ µ+νµ andW−→ µ−ν¯µ decays separately. The differences between the charge separated cross sec- tions are particularly sensitive to nuclear modifications of the parton distribution function in the Pb nucleus, and this is studied by extracting the lepton charge asymmetry. In addition to the cross sections, which are integrated over all impact parameters, the centrality dependence ofW → µν production is measured. It is analysed within the framework of Monte Carlo Glauber models with constant cross sections and its extensions for fluctuations of the under- lying nucleon-nucleon scattering cross section. Results are compared with a baseline model composed of 82σ(pp→W+X)+126σ(pn→W+X) to mimic particle compositions in p+Pb collisions, calculated in NLO pQCD.
c
2015 CERN for the benefit of the ATLAS Collaboration.
Reproduction of this article or parts of it is allowed as specified in the CC-BY-3.0 license.
1 Introduction
The study of the production of electroweak (EW) bosons: high-energy photons,W±andZ, is a direct way to probe the initial stage of proton–proton, proton–nucleus and nucleus–nucleus collisions at the LHC.
EW bosons have a unique feature because they are formed in a hard parton-parton interaction at a very early stage of the collision. Also, the leptons emerging from the decays of massive EW bosons do not interact with the medium and therefore carry unmodified information about the geometry of the nuclei at the collision time and about the nuclear parton distribution functions (nPDF) inside them. Understanding the initial geometry of the nuclei and the nPDF modifications is the main goal of this note.
The geometry of the colliding nuclei is closely related to the notion of centrality. Measurements conducted with isolated prompt photons at √
sNN =200 GeV in the Au+Au collisions system [1] and measurements conducted by the ATLAS [2] and CMS [3] collaborations at √
sNN = 2.76 TeV in lead-lead (Pb+Pb) collisions offer strong evidence that the production rates of isolated prompt photons scale with the mean number of binary collisions,hNcolli. The LHC offers a unique capability to also study massive EW bosons, which were measured in Pb+Pb data by the CMS [4–6] and by the ATLAS [7–9] collaborations. These measurements demonstrated that the yields of massive EW bosons per nucleon-nucleon (NN) collision are constant with centrality.
The LHC delivered its first proton–nucleus (p+Pb) collisions in a short run at √
sNN = 5.02 TeV in September 2012, followed by a longer run in February 2013. The new data brought a wealth of new results, including the observation that collective effects play a much more significant role [10–16] in small systems than was previously considered. Further studies of these new phenomena require the reassessment of the centrality determination techniques and the choice of the geometric model used for centrality determination [17,18]. The first measurements of centrality dependence ofZboson production inp+Pb collisions published by the ATLAS experiment [19] compared hard scattering production rates per NN collision calculated using Glauber model with three different assumptions about the magnitude of the event-by-event fluctuation of the NN cross section and demonstrated the effect of the centrality bias correction [20]. This note presents first results on the centrality dependence of theW boson production inp+Pb that confirm the findings of the studies carried out withZbosons.
Measurements of the EW bosons in the Pb+Pb system show that the rapidity distributions of the particles and their decay products can be generally described by pQCD calculations, implemented e.g. in the Powheggenerator [21] using the CT10 PDF [22] interfaced to Pythia8 [23]. The first CMS results on theW boson cross section [24] inp+Pb collisions and the results of the ATLAS experiment [19] withZ bosons indicate that the production rates in the entire rapidity range of the measurements are not fully described by EPS09 nPDF [25]. Due to the sensitivity of the rapidity distributions of theW boson to the isospin content of the colliding species, theW boson is an important probe of the nPDF in asymmetric systems. This sensitivity can be measured in the asymmetry of the charged leptons coming from theW boson decaysA`(η`) defined as:
A`(η`) = dNW+→`+ν`/dη`−dNW−→`−ν¯`/dη`
dNW+→`+ν`/dη`+dNW−→`−ν¯`/dη` (1) This note presents for the first time the centrality dependence of the A`(η`) fromW bosons measured in thep+Pb system.
2 ATLAS detector
The ATLAS detector [26] at the LHC covers nearly the entire solid angle around the collision point. It consists of an inner tracking detector surrounded by a thin superconducting solenoid, electromagnetic and hadronic calorimeters, and a muon spectrometer incorporating three large superconducting toroid magnets.
The inner-detector system (ID) is immersed in a 2 T axial magnetic field and provides charged particle tracking in the range|η| < 2.5. The high-granularity silicon pixel detector covers the vertex region and typically provides three measurements per track, the first hit being normally in the innermost layer. It is followed by the silicon microstrip tracker which usually provides four two-dimensional measurement points per track. These silicon detectors are followed by the transition radiation tracker, which enables radially extended track reconstruction up to |η| = 2.0. The transition radiation tracker also provides electron identification information based on the fraction of hits (typically more than 30 in total) above a higher energy deposit threshold corresponding to transition radiation.
The calorimeter system covers the pseudorapidity range|η| < 4.9. Within the region|η| < 3.2, electro- magnetic calorimetry is provided by high-granularity barrel and endcap lead/liquid-argon (LAr) electro- magnetic calorimeters, with an additional thin LAr presampler covering|η| < 1.8, to correct for energy loss in material upstream of the calorimeters. Hadronic calorimetry is provided by the steel/scintillating- tile calorimeter, segmented into three barrel structures within |η| < 1.7, and two copper/LAr hadronic endcap calorimeters. Forward electromagnetic calorimeters (FCal) are located in the range 3.1 < |η| <
4.9.
The muon spectrometer (MS) comprises separate trigger and high-precision tracking chambers measuring the deflection of muons in a magnetic field generated by superconducting air-core toroids. The precision chamber system covers the region|η| < 2.7 with three layers of monitored drift tubes, complemented by cathode strip chambers in the forward region, where the background is highest. The muon trigger system covers the range|η| <2.4 with resistive plate chambers in the barrel, and thin gap chambers in the endcap regions.
The ATLAS detector has a three-level trigger system [27]. The hardware-based level-1 (L1) trigger, which is followed by two software-based High Level Triggers (HLT). Single-muon triggers are used to acquire the data analysed in this note. Minimum-bias (MB) events are selected based on signals in the minimum-bias trigger scintillators (MBTS) that detect charged particles in the range 2.1< |η| <3.9.
Muons candidates are first identified in the L1 trigger, which is based on hits either in the Resistive Plate Chamber or in the Thin Gap Chamber systems and the software based High-Level trigger (HLT), which is subdivided in to the L2 trigger and the event filter. Events containing at least one muon withpTgreater than 8 GeV are accepted by the HLT.
3 Data analysis
3.1 Data sample
The analysis presented in this note usesp+Pb collision data at √
sNN =5.02 TeV collected by ATLAS in 2013. The particles were collided using a 4 TeV proton beam and a lead beam with 1.57 TeV per nucleon.
The asymmetric energy of the beams resulted in a shift of the centre-of-mass by 0.465 units of rapidity relative to the laboratory frame1in the direction of the proton beam. The data were recorded in two beam configurations, which differed by the reversed directions of the colliding beams. The results obtained in the two data-taking periods are found to be consistent with each other and are combined for all results presented below. In the following, the convention that the proton beam travels forward in the positive rapidity direction is used.
The analysis ofW boson production in this note uses a data sample corresponding to an integrated lumi- nosity of 28.1±0.8 nb−1. The luminosity measurement for the 2013 p+Pb data is calibrated based on dedicated beam-separation scans. Systematic uncertainties associated with the luminosity determination are similar to those forppcollisions [28] are observed. The combination of these systematic uncertainties results in a total uncertainty on the luminosity scale of 2.7% in this dataset.
3.2 Monte Carlo samples
Simulated events are used to estimate signal and background components. The ATLAS detector response is generated using Geant4 [29]. The signal processes are embedded into MB p+Pb events from data recorded in the same run periods. The simulatedW events are generated with Powheg[21] and interfaced to Pythia8 [23] to model the fragmentation processes. The Monte Carlo (MC) samples are produced for pp andpncollisions. The simulations are added with the weights 82/208 and 126/208 for ppand pn collisions, respectively, to mimicp+Pb collisions.
3.3 Event selection and centrality association
Event selection criteria required in this analysis are the same as used in theZ boson measurement [19].
They include data quality criteria, muon trigger, pileup rejection and rejection of events with large rapidity gaps. Measured events are categorised in centrality classes. Centrality is determined event-by-event using the FCal in the Pb-going direction. Association of centrality classes with the initial geometric parameters of thep+Pb collisions is done following the procedure explained in Ref. [18]. The centrality selections used for this analysis are 0–5%, 5–10%, 10–20%, 20–30%, 30–40%, 40–60% and 60–90%.
MB events are required to have the difference between times measured in each MBTS to be less than 10 ns, and a reconstructed collision vertex within 200 mm of the nominal collision point in the longitudinal direction [18].
3.4 Muon andEmiss
T reconstruction and signal candidate selection
Muon reconstruction in ATLAS consists of separate tracking in the ID and the MS. In this analysis, muons are reconstructed in both sub-systems and combined using a χ2 minimization, see e.g. [30] for more information. These combined muons are required to satisfy a set of selection criteria in the ID, on the transverse and longitudinal impact parameters, and a minimum quality on the muon track fit.
1ATLAS uses a right-handed coordinate system with its origin at the nominal interaction point (IP) in the centre of the detector and thez-axis along the beam pipe. The x-axis points from the IP to the centre of the LHC ring, and the y-axis points upwards. Cylindrical coordinates (r, φ) are used in the transverse plane, φ being the azimuthal angle around thez-axis.
The pseudorapidity is defined in terms of the polar angleθasη =−ln tan(θ/2). Angular distance is measured in units of
∆R≡
q(∆η)2+(∆φ)2.
Missing transverse energyETmissis the energy imbalance in the transverse plane obtained from the negative vector sum of all detected particles. It is expected to arise from high energy neutrinos from the W boson decay. The reconstruction of the missing transverse energyETmiss includes contributions from the calorimeter and muons reconstructed in the MS. Thex,y-components are then each summed to
Ex,ymiss=Emiss,calox,y +Emiss, µx,y , (2)
where the calorimeter term, Ex,ymiss,calo, uses calibrated cells associated with reconstructed and identified high-pT objects, e.g. electrons or photons. The muon term, Emiss, µx,y , is calculated from muons recon- structed within|η| <2.7.
The transverse component of the missing energy, ETmiss, and its direction in the transverse plane, φmiss, are given by
ETmiss= q
(Emissx )2+(Emissy )2,
φmiss=arctan(Emissy ,Emissx ). (3) To identifyW bosons, a high quality muon with transverse momentum of at least 25 GeV is required in an event withETmiss> 25 GeV. The transverse mass, defined as
mT = q
2pTµETmiss(1−cos∆φµ,Emiss
T ), (4)
where∆φµ,Emiss
T is the azimuthal angle between the muon direction and the direction of the missing energy φmiss, is also required to bemT > 40 GeV. Events with opposite-sign dimuon pairs having an invariant mass>66 GeV are rejected in order to reduce the background fromZ bosons.
The background from muons from heavy-flavour decays, can be reduced by requiring the muons to be isolated. Therefore, the summed track-pT within a cone around the muonpconeT is required to be low. The cone radius is calculated by∆R= p
(∆ϕ)2+(∆η)2and is chosen to∆R= 0.3. The isolation criterion is pTcone/pTµ ≤0.2.
After these selection criteria, theW yield as a function of the muon pseudorapidity in the detector coor- dinate system (ηlabµ ) is measured by
NW±(ηlabµ ,centrality)= NWobs±−NWbkg±
CW± (ηlabµ ,centrality), (5) whereNWobs± are all measuredW candidates after applying the selection criteria. However, there are still some events from background sourcesNWbkg± remaining following these selections. The background es- timation and subtraction will be discussed in Section3.4.1. To correct for detector effects and selection criteria, the yield is corrected by MC simulation for the selection efficiencyCW± double differentially in intervals ofηlabµ and centrality. This is discussed in Section3.4.2.
3.4.1 Background estimation
The selected muon candidates include background contributions in addition to theW → µνsignal. The significant background sources which are estimated and subtracted from the muon yield are of two types:
muons from heavy-flavour decays within multijet events (QCD background) and EW muon sources. The background from EW bosons consists ofZ → µµ, where one muon is emitted outside of the acceptance andW →τνdecays with a subsequentτ→ µνµντ decay.
The contributions of the background sources to the measuredWyield are estimated by fitting background and signal templates to the measuredETmissdistribution. This is done for all centrality orηlabµ bins in the range of 10< ETmiss< 60 GeV.
The templates for theW → µνsignal, theZ → µµbackground and theW →τν background are taken from MC samples. The template for the QCD background is estimated in a data-driven approach. All selection criteria are applied as in the signal analysis. Instead of the isolation requirement an anti-isolation cut,pconeT /pTµ > 0.2, is applied on the QCD background template. Moreover, the azimuthal angle of the ETmissand the jet in the event selected for the background template are required to be separated by at least π/2 to remove events with the ETmiss spuriously produced by a miscalibration of a jet. The amount of muons from the QCD background is of the order of 3%.
The Z background MC sample is normalized to the measured yield in each centrality bin [19] and sub- jected to the analysis selections. It increases as a function of |ηlabµ | with the probability of one of the decay muons escaping the detector acceptance. The background is constant as a function of centrality, but increases towards positiveηlabµ , i.e. the p-going direction, which corresponds to a higher Z boson production cross section given the shifted centre-of-mass of the collisions. The amount of muons fromZ bosons is of the order of 1.5−2.0%.
The amount ofW → τν background is constrained by the acceptance and branching ratio difference betweenW → τνandW → µνand is of the order of 1.5 and 2.5% of the number of selected events. It shows noηlabµ or centrality dependence.
The template fitting is performed using the RooFit package [31], assuming Poissonian uncertainties. The parameters of the fits are the relative contributions from the signal, the QCD background and theW →τν background.
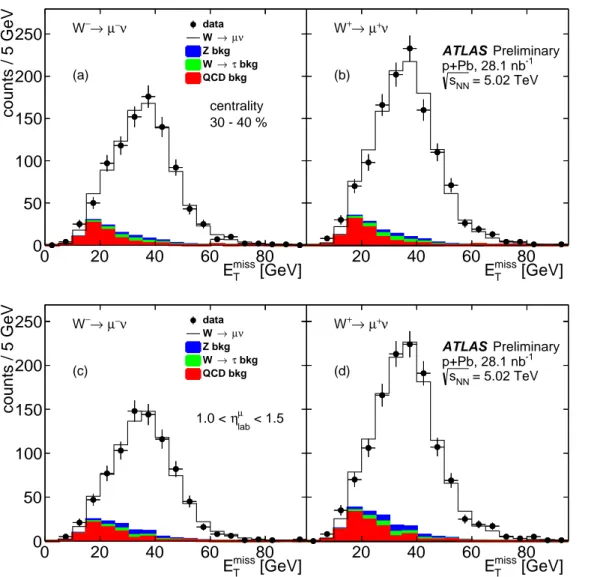
Figure1 shows the ETmiss distributions for positively and negatively charged muons after all selection criteria are applied. Data are compared to signal and background distributions.
3.4.2 Efficiency correction
In order to allow a meaningful comparison with models, losses due to trigger, reconstruction and selection efficiencies are evaluated and corrected. These efficiencies are calculated based onW → µνsignal MC samples. The production yields are calculated within the fiducial phase-space of
0.1< |ηlabµ | <2.4, pTµ >25 GeV, pνT >25 GeV, mT >40 GeV.
[GeV]
miss
ET
0 20 40 60 80
counts / 5 GeV
0 50 100 150 200
250 dataW →µν
Z bkg τ bkg
→ W QCD bkg
−ν µ
−→ W
(a)
centrality 30 - 40 %
[GeV]
miss
ET
20 40 60 80
counts/5 GeV
0 50 100 150 200 250
ATLAS Preliminary p+Pb, 28.1 nb-1
= 5.02 TeV sNN
+ν µ
+→ W
(b)
[GeV]
miss
ET
0 20 40 60 80
counts / 5 GeV
0 50 100 150 200
250 data
ν µ
→ W Z bkg
τ bkg
→ W QCD bkg
−ν µ
−→ W
< 1.5
lab
ηµ
1.0 <
(c)
[GeV]
miss
ET
20 40 60 80
counts/5 GeV
0 50 100 150 200 250
ATLAS Preliminary p+Pb, 28.1 nb-1
= 5.02 TeV sNN
+ν µ
+→ W
(d)
Figure 1:ETmissdistributions in data compared with the signal and background templates for events passing theW− (left) andW+(right) boson requirements. The upper panels are for the 30–40% centrality bin integrated over all ηlabµ and the lower panels are for 1.0< ηlabµ <1.5 integrated over all centralities.
Because of low detector efficiency, the region|ηlabµ | < 0.1 is excluded from the analysis. The reconstruc- tion and identification efficiency is calculated as
CW±(ηlabµ ,centrality)= NAll analysis steps, rec W±
Nfiducial, gen W±
W signal
(ηlabµ ,centrality), (6)
where NAll analysis steps, rec is the number of reconstructedW → µνdecays and Nfiducial, gen are the gen- eratedW → µνdecays within the fiducial region described above. Efficiencies are carried out for each charge separately in bins ofηlabµ and centrality. Since the analysis is always performed in centrality inter- vals, no reweighting of the MC to match the data FCal distribution needs to be applied.
The muon trigger efficiency is about 80–95%. Muon reconstruction efficiency is approximately 99%.
The differences between data and the MC samples for the muon reconstruction efficiency are corrected
by scale factors. These scale factors are typically below 1%. The overall efficiency ofW boson recon- struction is approximately 75–85% and depends onηlabµ .
4 Systematic uncertainties
The systematic uncertainties of the measured production rates are studied inηlabµ and centrality bins for both charges separately. The sources of uncertainties considered in this analysis are theETmissresolution and absolute scale, the QCD background level and isolation efficiency, the muon reconstruction efficiency, the contribution from the EW background, and the calculation ofhNcolli. Variations of these quantities from the nominal values in the analysis procedures are used to investigate the influence on the yield as a function of centrality and on the cross section as a function ofηlabµ . It should also be noted, that in the calculation of the lepton charge asymmetry a fraction of the correlated uncertainties cancels. All efficiencies, background sources, and signal yields have been recalculated with each procedural variation and the variation of the resulting observable used to estimate the systematic uncertainties.
The dominant source of systematic uncertainty is theETmissresolution. Inp+Pb collisions,ETmissresolution increases from 3 GeV in peripheral collisions to 8 GeV in central collisions. Studies inppcollisions at
√s=7 TeV showed, that the range of theETmissresolution can vary within 10–15%, depending on the MC or data sample. To investigate the impact of theETmissresolution on this analysis, theETmissresolution is artificially degraded by smearing the componentsEmissx andEymissby Gaussian distributions with widths of 0.5 (1) GeV corresponding to peripheral (central) events. This results in an uncertainty of approximately 2–5% ranging from peripheral to central events, and depends onηlabµ . The absolute scale uncertainty and non-linearity of the ETmiss signal is studied in MC simulation and is found to have a scale uncertainty of 2%, which propagates to a 1% uncertainty on theW boson yields independent of centrality. The uncertainty on the QCD background is estimated by a variation of the isolation selection criteria. The cone radius and the requirement onpconeT /pTµ are varied, modifying the QCD template shape. This results in an uncertainty of 1–1.5%.
Muon reconstruction efficiency differences between data and MC are studied and found to lead to uncer- tainties of about 0.2%. In the trigger efficiency studies, discrepancies between data and MC amount to 3% in the entire region of the measurement and up to 8% for µ− in the outermost pseudorapidity bin.
The differences in the uncertainty of theZ background contribution is calculated by varying theZboson production rate by its measured uncertainty [19]. The effect on the W boson signal is on the order of 0.1%.
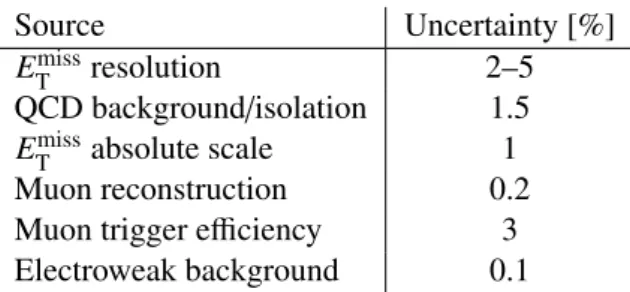
The systematic uncertainties are summarized in Table1. The separate contributions are added in quadra- ture to calculate the total systematic uncertainty.
Source Uncertainty [%]
ETmissresolution 2–5
QCD background/isolation 1.5 ETmissabsolute scale 1
Muon reconstruction 0.2
Muon trigger efficiency 3 Electroweak background 0.1
Table 1: Summary of the systematic uncertainties on the cross section.
5 Results
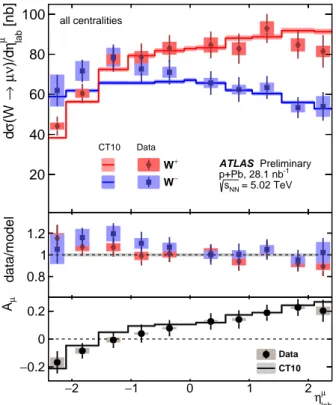
The fully correctedW →µνproduction cross section as a function of the muon pseudorapidity is shown in Figure2. The cross section is measured separately forW+andW−bosons and these show differences
lab
ηl
−2 −1 0 1 2
[nb]µ labη)/dνµ→(W σd
20 40 60 80 100
CT10 Data
all centralities
W+
W−
ATLAS Preliminary p+Pb, 28.1 nb-1
= 5.02 TeV sNN
µ ηlab
−2 −1 0 1 2
data/model 0.8 1 1.2
µ
ηlab
−2 −1 0 1 2
µA
−0.2 0 0.2
Data CT10
Figure 2: The upper panel shows the cross section of theW → µν production as a function of the muon pseu- dorapidity in the laboratory frame measured separately forW+ (diamonds) andW−(squares) and compared to a Powheg–based model (lines) using CT10 PDFs and the ratio of neutrons and protons in Pb nuclei. The middle panel shows the data-to-model ratios forW+andW−bosons. The lower panel shows the asymmetry defined in the text compared to the same model. The error bars correspond to the statistical uncertainties, error boxes correspond to the total systematic uncertainties. An additional uncertainty of 2.7% on luminosity on the cross section is not shown. The uncertainties on the model are from the renormalisation and factorisation scale.
in the positive and in the negative directions. The difference between the charges is shown in the lower panel as an asymmetry defined by Eq.1. The shape of the curves in the figure is partially due to the centre-of-mass system shift of approximatelyηlabµ =0.465. In addition there is a ‘natural’ηdependence to the lepton charge asymmetry due to the valence u quarks which produceW+bosons having on average a higher fraction of the proton momentum. This effect is symmetric in η for ppcollisions, however in p+Pb collisions the charge asymmetry is also sensitive to the difference in the quark content of the proton and neutrons which are found in the Pb nucleus, and this leads to the dependence onηlabµ .
The measurements are compared to the results of a model based on the Powheggenerator using the CT10 PDFs, see Section3.2. This model describes the data well, except for theηlabµ < 0 region where the data points of theW−boson measurement are higher than the model prediction.
The middle panel of Figure2shows the data-to-model ratios forW+andW− bosons, where the points corresponding to negatively charged bosons are above unity in the negativeηlabµ region. The asymmetry
shown in the lower panel agrees well with the model forηlabµ > 0, however, the data are somewhat lower than the calculation on the Pb-going side (ηlabµ <0). The same result has been previously observed by the CMS Collaboration [24]. This pseudorapidity interval is similar to the region where the Z boson cross section exceeds the prediction of the same model [19].
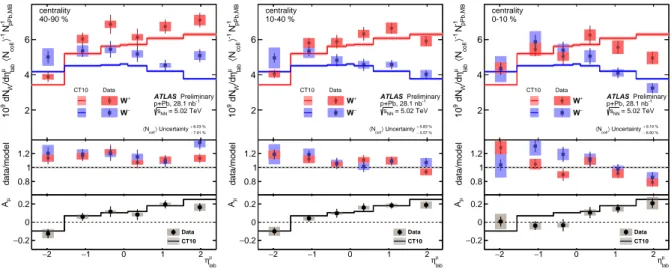
To understand the relation of theW → µνpseudorapidity distribution to the collision geometry Figure3 shows theW± production rate as a function of ηlabµ in three different centrality intervals: 40–90% (pe-
lab ηl
−2 −1 0 1 2
pPb,MB-1 N-1〉collN〈labµη/dW dN910 2
4 6
centrality 40-90 %
CT10 Data
7.91 %
− 6.03 % Uncertainty + coll〉
〈N W+ W−
ATLAS Preliminary p+Pb, 28.1 nb-1
= 5.02 TeV sNN
µ lab 2 η
− −1 0 1 2
data/model 0.8 1 1.2
µ
ηlab
−2 −1 0 1 2
µA
−0.2 0 0.2
Data CT10
lab ηl
−2 −1 0 1 2
pPb,MB-1 N-1〉collN〈 labµη/dW dN910 2
4 6
centrality 10-40 %
CT10 Data
5.57 %
− 5.83 % Uncertainty + coll〉
〈N W+ W−
ATLAS Preliminary p+Pb, 28.1 nb-1
= 5.02 TeV sNN
µ lab 2 η
− −1 0 1 2
data/model 0.8 1 1.2
µ
ηlab
−2 −1 0 1 2
µA
−0.2 0 0.2
Data CT10
lab ηl
−2 −1 0 1 2
pPb,MB-1 N-1〉collN〈labµη/dW dN910 2
4 6
centrality 0-10 %
CT10 Data
6.90 %
− 9.19 % Uncertainty + coll〉
〈N W+ W−
ATLAS Preliminary p+Pb, 28.1 nb-1
= 5.02 TeV sNN
µ lab 2 η
− −1 0 1 2
data/model 0.8 1 1.2
µ
ηlab
−2 −1 0 1 2
µA
−0.2 0 0.2
Data CT10
Figure 3: The upper panels show the production rate per NN collision and per MB events taken in the corresponding centrality class NpPb,MB of theW boson measured in the W → µν decay channel as a function of the muon pseudorapidity in the laboratory frame. Diamonds show the results forW+ and squares for W−. Results are compared to the Powheg–based model using CT10 PDFs and the ratio of neutrons and protons in Pb nuclei (dashed lines). The data-to-model ratios are shown in the middle panels for the particles of both charges. The lower panels show the asymmetry defined in the text compared to the same model. From left to right are the results measured in 40–90%, 10–40% and 0–10% centrality intervals. The error bars correspond to the statistical uncertainties, error boxes correspond to the total systematic uncertainties. The uncertainties on the model are from the renormalisation and factorisation scale.
ripheral), 10–40% (mid-central) and in 0–10% (the most central) collisions. The production rates of the W bosons in the corresponding centrality intervals are corrected for the centrality bias according to the procedure explained in Ref. [19] and divided byhNcollifrom the Glauber model [18].
The results in Figure3are shown forW+andW−bosons and compared to the results of Powhegcalcu- lations. In peripheral collisions the model calculations are lower than the data for all values ofηlabµ . This may be due to the difficulty in definitively determininghNcollifor a given centrality bin; in addition to the hNcolliuncertainties shown in the Figure, the normalisation of each distribution depends on the choice of centrality model (see discussion below). There appears to be a dependence of the shape of the pseudo- rapidity distributions of both positively and negatively charged muons fromWbosons on centrality. The middle panels, displaying the ratios of the measured muon pseudorapidity distribution coming fromW± bosons to that calculated with the model, suggest the presence of a slope in the most central collisions, which does not appear in peripheral collisions.
The asymmetries shown in the lower panel of Figure3agree between the data and model, except in the Pb-going direction (ηlabµ <0) in the most central collisions.
The shape modification of the pseudorapidity distribution with centrality present in theW boson data is similar to the trend observed in theZboson data [19].
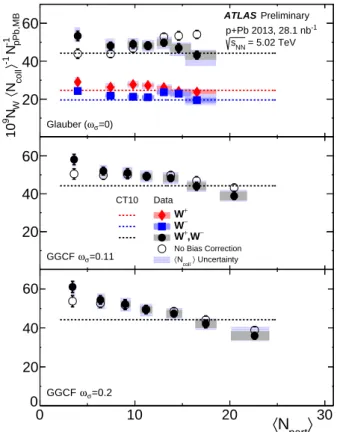
Figure4shows theW boson production rates per nucleon–nucleon collision in the fiducial acceptance of
0 10 20 30
pPb,MB-1 N-1 〉 collN〈WN9 10
20 40
60 ATLASPreliminary
p+Pb 2013, 28.1 nb-1
= 5.02 TeV sNN
σ=0) ω Glauber (
0 10 20 30
20 40 60
CT10 Data
No Bias Correction Uncertainty
coll〉
〈N W+
W− − +,W W
=0.11 ωσ
GGCF
〉 Npart
0 10 20 〈 30
20 40 60
0 GGCF ωσ=0.2
Figure 4:W boson production rates per nucleon–nucleon collision and per MB events taken in the corresponding centrality classNpPb,MBin the fiducial acceptance of the ATLAS detector as a function of the number of participants, hNparti. The three panels are for three centrality association models. The upper panel shows also the rates measured for theW+(diamonds) andW−(squares) separately. Lines show the result of the Powheg–based model using CT10 PDFs and the natural ratio of neutrons and protons in Pb nuclei. Open markers show the data without centrality bias correction.
the ATLAS detector as a function of the number of participants. The results of the CT10 calculations are shown as dashed lines and are the same in all panels. The three panels correspond to the three centrality association models used in Refs. [18,19]. The upper panel uses the standard Glauber model, while the middle and the lower panels use Glauber-Gribov Colour Fluctuation (GGCF) model extensions with the parameter of fluctuationsωσ =0.11 and 0.2 respectively.
InclusiveW±boson production yields are shown with open markers. Filled markers represent the same data after applying the centrality bias correction. The presence of aW boson is correlated with a larger transverse energy of the underlying event. Consequently, more energy may be deposited in the Pb-going side FCal in events containing a hard scattering process than in those coming from soft production. This causes a bias as the W boson yield is enhanced in the more central events but depleted in the more peripheral ones. Centrality bias correction is calculated assuming the average yield from hard scattering processes in each nucleon-nucleon collision and is proportional to the contribution from that collision to theET, which determinesΣETFCal. The centrality bias is corrected according to the procedure explained in
Ref. [20] as was done in Ref. [19]. This correction significantly changes the trend of the data, especially for the Glauber model in the upper panel. After applying this correction, the yield per binary collision is approximately constant withhNparti. In the lower panels the data production rate per collision diminishes withhNparti, and shows a clear negative slope for theωσ =0.2 case.
The upper panel shows also the yields separately measured forW+ and W− bosons. The production rate of the W+ boson is larger than of the W− boson, which is also consistent with the CT10 model calculations.
6 Conclusions
TheW boson production cross section has been measured in p+Pb collisions at √
sNN = 5.02 TeV with the ATLAS detector at the LHC, usingW →µνdecays with an integrated luminosity of 28.1±0.8 nb−1. Predictions based on perturbative QCD calculations reproduce the data well, except for theW−boson in the Pb-going direction (ηµlab < 0), where there appears to be an excess above the model. For the charge asymmetry, the CT10 model prediction appears to agree well with data for the p-going side (ηlabµ > 0).
However, some deviations are seen for the Pb-going side.
The pseudorapidity distribution of the muons coming from theW boson decays measured in different centrality intervals is found to be consistent as a function ofhNpartiwith the presence of some centrality dependence. This centrality dependence is similar to that observed for the rapidity distribution of Z bosons [19].
Following the application of a centrality bias correction, theW+ and W− bosons yields in the entire fiducial acceptance of the ATLAS detector, as well as their sum are measured as a function of hNparti calculated for Glauber and GGCF models withωσ =0.11, 0.2. TheW+andW−yields are compared to the Glauber model. The yields per NN collision are approximately constant as a function ofhNpartifor the Glauber model and show a negative slope for the Glauber-Gribov model calculations withωσ =0.2.
The trends of the yields scaled byhNcolliare similar to those measured forZ bosons.
References
[1] S. Afanasiev et al., PHENIX Collaboration,Phys. Rev. Lett.109(2012) 152302, arXiv:1205.5759.
[2] ATLAS Collaboration,arXiv:1506.08552.
[3] CMS Collaboration,Phys. Lett.B710(2012) 256–277,arXiv:1201.3093.
[4] CMS Collaboration,JHEP03(2015) 022,arXiv:1410.4825.
[5] CMS Collaboration,Phys. Rev. Lett.106(2011) 212301,arXiv:1102.5435.
[6] CMS Collaboration,Phys. Lett.B715(2012) 66–87,arXiv:1205.6334.
[7] ATLAS Collaboration,Phys. Lett.B697(2011) 294–312,arXiv:1012.5419.
[8] ATLAS Collaboration,Phys. Rev. Lett.110no. 2, (2013) 022301,arXiv:1210.6486.
[9] ATLAS Collaboration,Eur. Phys. J.C75no. 1, (2015) 23,arXiv:1408.4674.
[10] B. Abelev et al., ALICE Collaboration,Phys. Lett.B719(2013) 29–41,arXiv:1212.2001.
[11] B. Abelev et al., ALICE Collaboration,Phys. Lett.B726(2013) 164–177,arXiv:1307.3237.
[12] CMS Collaboration,Phys. Lett.B718(2013) 795–814,arXiv:1210.5482.
[13] ATLAS Collaboration,Phys. Rev. Lett.110(2013) 182302,arXiv:1212.5198.
[14] CMS Collaboration,Phys. Lett.B724(2013) 213–240,arXiv:1305.0609.
[15] ATLAS Collaboration,Phys. Lett.B725(2013) 60–78,arXiv:1303.2084.
[16] ATLAS Collaboration,Phys. Rev.C90no. 4, (2014) 044906,arXiv:1409.1792.
[17] J. Adam et al., ALICE Collaboration,Phys. Rev.C91(2015) 064905,arXiv:1412.6828.
[18] ATLAS Collaboration,arXiv:1508.00848.
[19] ATLAS Collaboration,arXiv:1507.06232.
[20] D. V. Perepelitsa and P. A. Steinberg,arXiv:1412.0976.
[21] S. Alioli, P. Nason, C. Oleari, and E. Re,JHEP07(2008) 060,arXiv:0805.4802.
[22] H.-L. Lai et al.,Phys. Rev.D82(2010) 074024,arXiv:1007.2241.
[23] T. Sjostrand, S. Mrenna, and P. Z. Skands,Comput. Phys. Commun.178(2008) 852–867, arXiv:0710.3820.
[24] CMS Collaboration,arXiv:1503.05825.
[25] H. Paukkunen and C. A. Salgado,JHEP03(2011) 071,arXiv:1010.5392.
[26] ATLAS Collaboration,JINST3(2008) S08003.
[27] ATLAS Collaboration,Eur. Phys. J.C72(2012) 1849,arXiv:1110.1530.
[28] ATLAS Collaboration,Eur. Phys. J.C73no. 8, (2013) 2518,arXiv:1302.4393.
[29] S. Agostinelli et al., GEANT4 Collaboration,Nucl. Instrum. Meth.A506(2003) 250–303.
[30] ATLAS Collaboration,Eur. Phys. J. C74(2014) 3130,arXiv:1407.3935.
[31] W. Verkerke and D. P. Kirkby, eConfC0303241(2003) MOLT007,arXiv:physics/0306116.