ATLAS-CONF-2016-098 21September2016
ATLAS NOTE
ATLAS-CONF-2016-098
20th September 2016
Search for new phenomena in events containing a same-flavour opposite-sign dilepton pair, jets, and large missing transverse momentum in √
s = 13 TeV p p collisions with the ATLAS detector
The ATLAS Collaboration
Abstract
Two searches for new phenomena in final states containing a same-flavour opposite-sign lepton (electron or muon) pair, jets, and large missing transverse momentum are presented.
These searches make use of proton–proton collision data, collected during 2015 and 2016 at a centre-of-mass energy
√s = 13 TeV by the ATLAS detector at the Large Hadron Collider, which correspond to an integrated luminosity of 14.7 fb−1. Both searches target the pair production of supersymmetric particles, squarks or gluinos, which decay to final states containing a same-flavour opposite-sign lepton pair via one of two mechanisms: a leptonically decaying Z boson in the final state, leading to a peak in the dilepton invariant mass distribution around theZ boson mass; and decays of neutralinos (e.g. ˜χ0
2→`+`−χ˜0
1), yielding a kinematic endpoint in the dilepton invariant-mass spectrum. The data are found to be consistent with the Standard Model expectation. Results are interpreted in simplified models of gluino (squark)-pair production, and provide sensitivity to gluinos (squarks) with masses as large as 1.7 TeV (980 GeV).
© 2016 CERN for the benefit of the ATLAS Collaboration.
Reproduction of this article or parts of it is allowed as specified in the CC-BY-4.0 license.
1 Introduction
Supersymmetry (SUSY) [1–6] is an extension to the Standard Model (SM) that introduces partner particles (calledsparticles), which differ by half a unit of spin from their SM counterparts. The squarks ( ˜q) and sleptons ( ˜`) are the scalar partners of the quarks and leptons, respectively, and the gluinos ( ˜g) are the fermionic partners of the gluons. The charginos ( ˜χ±i) and neutralinos ( ˜χ0i) are the mass eigenstates (where the indexiis ordered from the lightest to the heaviest) formed from the linear superpositions of the SUSY partners of the Higgs bosons (higgsinos) and electroweak gauge bosons.
If the masses of the gluino, higgsinos, and top squarks are close to the TeV scale, SUSY has the potential to offer a solution to the SM hierarchy problem [7–10]. In this case, strongly interacting sparticles should be produced at a high enough rate to be detected by the experiments at the Large Hadron Collider (LHC). For models with R-parity conservation [11], such sparticles would be pair-produced and are expected to decay into jets, perhaps leptons, and the lightest stable SUSY particle (LSP). The LSP is assumed to be only weakly interacting and therefore escapes the detector, resulting in events with potentially large missing transverse momentum (pmiss
T , with magnitudeEmiss
T ). In such a scenario the LSP could be a dark-matter candidate [12,13].
Final states containing pairs of leptons may arise from the cascade decays of squarks and gluinos via several mechanisms. In this note, two search channels are considered that target scenarios with same- flavour (SF) opposite-sign (OS) lepton (electron or muon) pairs. The first channel requires a lepton pair with an invariant massm`` that is consistent with the Z boson mass mZ (“on-shell Z” channel), while the second channel considers all SFOS lepton pairs (“edge” channel). The presence of two leptons in the final state suppresses large SM backgrounds from, e.g., QCD multijet andW+jets production, providing a clean environment in which to search for new physics. As discussed further below, in such events the distribution of dilepton massm``may be used to characterise the nature of the SUSY particle decay and constrain mass differences between SUSY particles.
The SFOS lepton pairs may be produced in the decay ˜χ0
2 →`+`−χ˜0
1(or, in models of generalised gauge mediation with a gravitino LSP [14–16], via ˜χ0
1 →`+`−G˜). The nature of the ˜χ0
2decay depends on the mass difference∆mχ ≡m
χ˜0 2
−m
χ˜0
1, the mixing of the charginos and neutralinos, and on whether there are additional sparticles with masses less thanm
χ˜0
2 that may be produced in the decay of the ˜χ0
2particle. For
∆mχ > mZ, SFOS lepton pairs may be produced in the decay ˜χ0
2 →Zχ˜0
1 →`+`−χ˜0
1, leading to a peak in the invariant mass distribution nearm`` ≈ mZ. Such models are the target of the on-shell Zsearch. For
∆mχ < mZ, the decay ˜χ0
2 → Z∗χ˜0
1 →`+`−χ˜0
1leads to a rising m``distribution that is truncated above a kinematic endpoint, whose position is given by m``max = ∆mχ < mZ, below the Z boson mass peak.
If there are sleptons with masses less thanm
χ˜0
2, the ˜χ0
2 particle may decay as ˜χ0
2 → `˜±`∓ → `+`−χ˜0
1, also leading to a kinematic endpoint but with a different shape and m`` endpoint position, given by mmax`` =q
(m2
χ˜0 2
−m2
`˜)(m2
`˜−m2
χ˜0 1
)/m2
`˜, which may occur below, on, or above theZ boson mass peak. The latter two scenarios are targeted by the “edge” search channel, which considers the fullm``range.
This note reports on a search for SUSY in the same-flavour dilepton final state with 14.7 fb−1 of pp collision data at
√s=13 TeV recorded in 2015 and 2016 by the ATLAS detector at the LHC. Searches for SUSY in theZ+jets+Emiss
T final state have previously been performed at
√s =8 TeV by the CMS [17,
18] and ATLAS [19] Collaborations using Run 1 LHC data. In the ATLAS analysis performed with 20.3 fb−1of
√s= 8 TeV data reported in Ref. [19], an excess of events above the SM background with a significance of 3 standard deviations was observed. As such, the event selection criteria for the on-shellZ
search in this note are almost identical, differing only in the details of the analysis object definitions and missing transverse momentum. CMS performed a search with
√s = 13 TeV data in a similar kinematic
region but did not observe evidence to corroborate this excess [20].
Searches for an edge in them`` distribution in events with 2`+jets+Emiss
T have been performed by the CMS [18, 21] and ATLAS [19] Collaborations. In Ref. [18], CMS reported an excess above the SM prediction with a significance of 2.6 standard deviations. This excess was not observed in Run 1 ATLAS data [19], nor in Run 2 CMS data [20].
2 ATLAS detector
The ATLAS detector [22] is a general-purpose detector with almost 4π coverage in solid angle.1 The detector comprises an inner tracking detector, a system of calorimeters, and a muon spectrometer.
The inner tracking detector (ID) is immersed in a 2 T magnetic field provided by a superconducting solenoid and allows charged-particle tracking out to |η| = 2.5. It includes silicon pixel and silicon strip tracking detectors inside a straw-tube tracking detector. In 2015 a new innermost layer of silicon pixels has been added to the detector, which improves the track impact parameter and vertex position resolution [23].
High-granularity electromagnetic and hadronic calorimeters cover the region|η| < 4.9. All the electro- magnetic calorimeters, as well as the endcap and forward hadronic calorimeters, are sampling calorimeters with liquid argon as the active medium and lead, copper, or tungsten absorber. The central hadronic calor- imeter is a sampling calorimeter with scintillator tiles as the active medium and steel absorber.
The muon spectrometer uses several detector technologies to provide precision tracking out to|η| = 2.7 and triggering in|η| < 2.4, making use of a system of three toroidal magnets.
The ATLAS detector incorporates a two-level trigger system, with the first level implemented in custom hardware and the second level implemented in software. This trigger system reduces the output rate to about 1 kHz.
3 SUSY signal models
SUSY-inspired simplified models are considered as signal scenarios for these analyses. In all of these models squarks or gluinos are directly pair-produced, decaying via an intermediate neutralino, ˜χ0
2, into the LSP ( ˜χ0
1). All sparticles not directly involved in the decay chains considered are effectively decoupled.
Two example decay topologies are shown in Figure1. For all models with gluino pair production, a three-body decay for ˜g →qq¯χ˜0
2is used. Signal models are generated in a grid over a two-dimensional space, varying the gluino or squark mass and the mass of either the ˜χ0
2or the ˜χ0
1.
1ATLAS uses a right-handed coordinate system with its origin at the nominal interaction point (IP) in the centre of the detector and thez-axis along the beam pipe. The x-axis points from the IP to the centre of the LHC ring, and they-axis points upward. Cylindrical coordinates (r, φ) are used in the transverse plane, φ being the azimuthal angle around the z-axis. The pseudorapidity is defined in terms of the polar angle θ asη = −ln tan(θ/2) and the rapidity is defined as y=1/2/ln[(E+pz)/(E−pz)]), whereEis the energy and pzthe longitudinal momentum of the object of interest. The opening angle between two analysis objects in the detector is defined as∆R=q
(∆y)2+(∆φ)2.
˜ g
˜ g
˜02
˜02 p
p
q q
˜01 Z
q q
˜01 Z
(*)
(*)
˜ g
˜ g
˜ χ02 `/˜˜ν
˜ χ02 `/˜˜ν p
p
q q `/ν
`/ν
˜ χ01
q
q `/ν
`/ν
˜ χ01
Figure 1: Example decay topologies for two of the simplified models considered, involving gluino pair production, with the gluinos following an effective three-body decay for ˜g→qq¯χ˜0
2, with ˜χ0
2→ Z(∗)χ˜0
1(left) and ˜χ0
2→`˜∓`±/νν˜ (right).
Three models, one with squark pair production and two with gluino pair production, which result exclus- ively in events with two on-shell Z bosons in the final state are considered for the on-shell search. For two of these models, signal mass points are generated across the ˜g– ˜χ0
2(or ˜q– ˜χ0
2) plane. These models are produced following the decays ˜g→qq¯χ˜0
2or ˜q→qχ˜0
2, with the ˜χ0
1(LSP) mass set to 1 GeV, inspired by SUSY scenarios with a low-mass LSP (e.g. generalised gauge mediation). These two models are referred to here as the ˜g– ˜χ0
2on-shell and ˜q– ˜χ0
2on-shell grids, respectively, and are summarised in Table1. The third model is based on MSSM-like topologies [24–26] with potentially higher mass LSPs. Signal points are generated across the ˜g– ˜χ0
1 plane, and this model is thus referred to as the ˜g– ˜χ0
1 on-shell grid. In this case the ˜χ0
2 mass is set to be 100 GeV above the ˜χ0
1 mass, which in many models maximises the branching fraction toZbosons. For the two models with gluino pair production, the branching fractions forq=u,d,c,sare equal. For the model involving squark pair production, the super-partners of theu,d, candsquarks have the same mass, with the super-partners of thebandtquarks being decoupled.
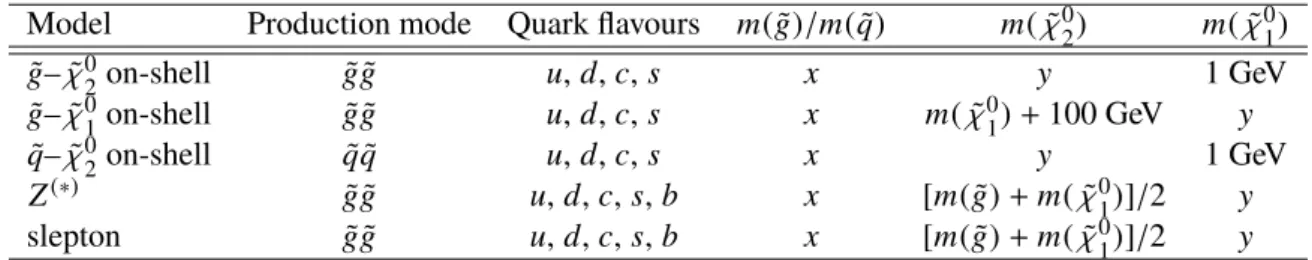
Table 1: Summary of the simplified signal model topologies used in this note. Herexandydenote the x-yplane across which the signal model masses are varied to construct the signal grid. For the slepton model, the masses of the superpartners of the left-handed leptons are given by [m(χ˜0
2)+m(χ˜0
1)]/2, while the superpartners of the right-handed leptons are decoupled.
Model Production mode Quark flavours m(g)/m(˜ q)˜ m(χ˜0
2) m(χ˜0
1) g˜– ˜χ0
2on-shell g˜g˜ u,d,c,s x y 1 GeV
g˜– ˜χ0
1on-shell g˜g˜ u,d,c,s x m(χ˜0
1)+100 GeV y q˜– ˜χ0
2on-shell q˜q˜ u,d,c,s x y 1 GeV
Z(∗) g˜g˜ u,d,c,s,b x [m(g)˜ +m(χ˜0
1)]/2 y slepton g˜g˜ u,d,c,s,b x [m(g)˜ +m(χ˜0
1)]/2 y
The edge search considers two scenarios, both of which involve the direct pair production of gluinos and differ by the decay mode of the ˜χ0
2. In the Z(∗) model the ˜χ0
2 decays as ˜χ0
2 → Z(∗)χ˜0
1. For
∆mχ = m
χ˜0 2
−m
χ˜0 1
> mZ, the Zboson is on-shell, leading to a peak in them`` distribution atmZ, while for ∆mχ < mZ, the Z boson is off-shell, leading to an edge in the dilepton mass distribution with a position belowmZ. The slepton model assumes that the sleptons are lighter than the ˜χ0
2, which decays as χ˜0
2→`˜∓`±; ˜`→`χ˜0
1or ˜χ0
2→νν˜ ; ˜ν→νχ˜0
1, each with branching fractions of 50%, where ˜`=e,˜ µ,˜ τ˜and ν˜ = ν˜e,ν˜µ,ν˜τ, with equal branching fractions. The endpoint position can occur at any mass, highlighting
the need to search over the full dilepton mass distribution. The gluino decays as ˜g → qq¯χ˜0
2, and both models have equal branching fractions forq=u,d,c,s,b. The ˜χ0
2mass is set to the average of the gluino and ˜χ0
1 masses. For the slepton model, the masses of the superpartners of the left-handed leptons or sneutrinos are set as the average of the ˜χ0
2 and ˜χ0
1 masses, while the superpartners of the right-handed leptons are decoupled. The three slepton flavours are mass-degenerate. In both these models the ˜gand ˜χ0
1
masses are free parameters that are varied to produce the two-dimensional signal grid. The mass splittings are chosen to maximize the differences between these simplified models and other models with only one intermediate particle between the gluino and the LSP [27].
All signal models are summarised in Table1.
4 Data and Monte Carlo samples
The data used in this analysis were collected by ATLAS during 2015 and 2016, with a mean number of additional ppinteractions per bunch crossing (pile-up) of approximately 14 in 2015 and 21 in 2016, and a centre-of-mass collision energy of 13 TeV. Following requirements based on beam and detector conditions and data quality, the dataset corresponds to an integrated luminosity of 14.7 fb−1. The preliminary uncertainty on the combined 2015 and 2016 integrated luminosity is±2.9%. It is derived, following a methodology similar to that detailed in Refs. [28] and [29], from a preliminary calibration of the luminosity scale usingx-ybeam-separation scans performed in August 2015 and May 2016.
Data events are collected using a combination of single-lepton and dilepton triggers [30], in order to maximise the signal acceptance. The di-electron, di-muon, and electron-muon triggers have higher lepton pT thresholds in the range 12–24 GeV. Additional single-electron (single-muon) triggers are also used, with trigger pT thresholds of 60 (50) GeV, to increase the trigger efficiency for models with high pT leptons. Events are required to contain at least two selected leptons with pT > 25 GeV, making the selection fully efficient with respect to the triggerpTthresholds.
An additional control sample of events containing photons is collected using a set of single-photon triggers withpTthresholds in the range 20–140 GeV. All triggers except for the one with thresholdpT >120 GeV in 2015, or the one withpT > 140 GeV in 2016, are prescaled. Events are required to contain a selected photon withpT > 37 GeV to be efficient for the lowest availablepTtrigger in 2015, which had a threshold ofpγ
T =35 GeV.
Simulated event samples are used to aid in the estimation of SM backgrounds, validate the analysis techniques, optimise the event selection, and provide predictions for SUSY signal processes. All SM background samples used are listed in Table2, along with the parton distribution function (PDF) set, the configuration of underlying-event and hadronisation parameters (underlying-event tune) and the cross- section calculation order inαsused to normalise the event yields for these samples.
Samples simulated using MG5_aMC@NLO v2.2.2 [31], interfaced with Pythia 8.186 [32] with the A14 underlying-event tune [33] to simulate the parton shower and hadronisation, are generated at leading order inαS(LO) with the NNPDF23LO PDF set [34]. For samples generated using Powheg Box V2 [35–37], Pythia 6.428 [38] is used to simulate the parton shower, hadronisation, and the underlying event. The CTEQ6L1 PDF set is used with the corresponding Perugia2012 [39] tune. In the case of both the MG5_aMC@NLO and Powheg samples, the EvtGen v1.2.0 program [40] is used for properties of the bottom and charm hadron decays. Sherpa 2.1.1 [41] simulated samples use the CT10 PDF set with Sherpa’s own internal parton shower [42] and hadronisation methods, as well as the Sherpa default
underlying-event tune. Diboson processes with 4 charged leptons, 3 charged leptons and 1 neutrino or 2 charged leptons and 2 neutrinos are simulated using the Sherpa 2.1.1 generator. Matrix elements contain all diagrams with four electroweak vertices. They are calculated for up to 1 (4`, 2`+2ν) or 0 (3`+1ν) partons at next-to-leading order inαS (NLO) and up to 3 partons at LO using the Comix [43]
and OpenLoops [44] matrix element generators and merged with the Sherpa parton shower using the ME+PS@NLO prescription [45]. For the Z/γ∗+jets background, Sherpa 2.1.1 is used to generate a sample with up to 2 additional partons at NLO and up to 4 at LO. For Monte Carlo (MC) closure studies, γ+jets events are generated at LO with up to 4 additional partons using Sherpa 2.1.1. Additional MC simulation samples of events with a leptonically decaying vector boson and photon (Vγ, whereV =W,Z) are generated at LO using Sherpa. Matrix elements including all diagrams with 3 electroweak couplings are calculated with up to 3 partons. These samples are used to estimateγ+jets backgrounds with real Emiss
T .
The SUSY signal samples are produced at LO using MG5_aMC@NLO with the NNPDF2.3LO PDF set, interfaced with Pythia 8.186. The scale parameter for CKKW-L matching [46, 47] is set at a quarter of the mass of the gluino. Up to one additional parton is included in the matrix element calculation.
The underlying event is modelled using the A14 tune for all signal samples, and EvtGen is adopted to describe the properties of bottom and charm hadron decays. Signal cross sections are calculated at NLO in αs. This includes the resummation of soft gluon emission at next-to-leading-logarithmic accuracy (NLO+NLL) [48–52].
All of the SM background MC samples are subject to a full ATLAS detector simulation [53] using GEANT4 [54]. A fast simulation [53], which uses a combination of a parameterisation of the response of the ATLAS electromagnetic and hadronic calorimeters and GEANT4, is used in the case of signal MC samples. This fast simulation is validated by comparing a few choice signal samples to some fully simulated points. Minimum-bias interactions are generated and overlaid on top of the hard-scattering process to simulate the effect of multipleppinteractions occurring during the same (in-time) or a nearby (out-of-time) bunch-crossing (pile-up). These are produced using Pythia8 with the A2 tune [55] and MSTW 2008 PDF set [56]. The pile-up distribution in MC samples is simulated to match that in data during 2015 and 2016ppdata-taking.
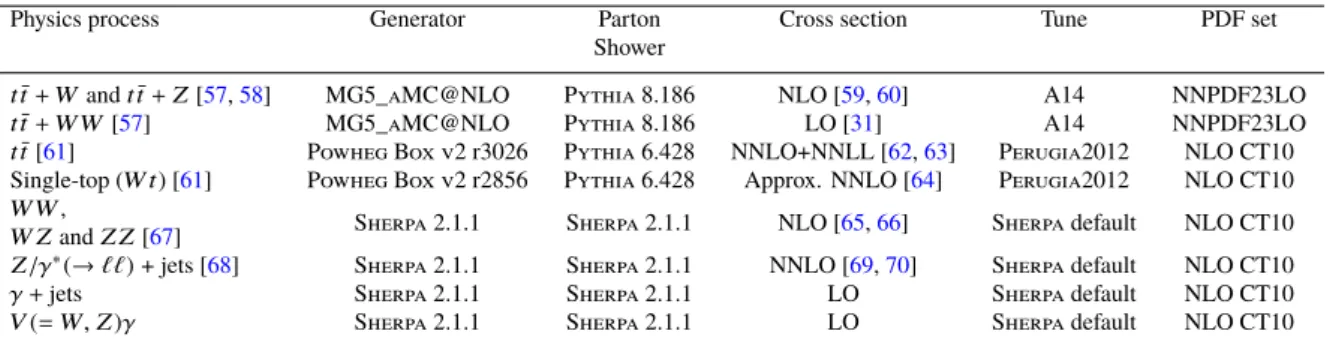
Table 2: Simulated background event samples used in this analysis with the corresponding matrix element and parton shower generators, cross-section order inαs used to normalise the event yield, underlying-event tune and PDF set.
Physics process Generator Parton Cross section Tune PDF set
Shower
tt¯+Wandt¯t+Z[57,58] MG5_aMC@NLO Pythia 8.186 NLO [59,60] A14 NNPDF23LO
tt¯+W W[57] MG5_aMC@NLO Pythia 8.186 LO [31] A14 NNPDF23LO
tt¯[61] Powheg Box v2 r3026 Pythia 6.428 NNLO+NNLL [62,63] Perugia2012 NLO CT10 Single-top (W t) [61] Powheg Box v2 r2856 Pythia 6.428 Approx. NNLO [64] Perugia2012 NLO CT10 W W,
Sherpa 2.1.1 Sherpa 2.1.1 NLO [65,66] Sherpa default NLO CT10 W ZandZ Z[67]
Z/γ∗(→``)+ jets [68] Sherpa 2.1.1 Sherpa 2.1.1 NNLO [69,70] Sherpa default NLO CT10
γ+jets Sherpa 2.1.1 Sherpa 2.1.1 LO Sherpa default NLO CT10
V(=W,Z)γ Sherpa 2.1.1 Sherpa 2.1.1 LO Sherpa default NLO CT10
5 Analysis object identification and selection
All analysis objects are categorised as either “baseline” or “signal” based on various quality and kinematic requirements. Baseline objects are used in the calculation of missing transverse momentum and to disambiguate between the analysis objects in the event, while the jets and leptons entering the final analysis selection must pass more stringentsignalrequirements. The selection criteria for both baseline and signal objects differ from the requirements used in the Run 1 ATLASZ+jets+Emiss
T search of Ref. [19], owing to the new tracking layer and significant changes to the reconstruction software since 2012 data- taking. In particular, improvements in the lepton identification criteria have reduced the background due to hadrons misidentified as electrons. The primary vertex in each event is defined as the reconstructed vertex [71] with the highestP
p2
T, where the summation includes all particle tracks withpT > 400 MeV associated to the vertex.
Electron candidates are reconstructed using energy clusters in the electromagnetic calorimeter matched to ID tracks. Baseline electrons are required to have transverse energy ET > 10 GeV, satisfy the
“loose likelihood” criteria described in Ref. [72] and reside within|η|=2.47. Signal electrons are further required to havepT >25 GeV, satisfy the “medium likelihood” criteria of Ref. [72], and be consistent with originating from the primary vertex. The signal electrons must originate from within|z0sinθ|=0.5 mm of the primary vertex along the direction of the beamline2. The transverse-plane distance of closest approach of the electron to the beamline, divided by the corresponding uncertainty, must be|d0/σd0| <5.
These electrons must also be isolated with respect to other objects in the event, according to a pT- dependent isolation requirement. The isolation uses calorimeter- and track-based information to obtain 95% efficiency atpT=25 GeV, rising to 99% efficiency atpT =60 GeV.
Baseline muons are reconstructed from either ID tracks matched to muon segments (collections of hits in a single muon spectrometer layer) or combined tracks formed from the ID and muon spectrometer [73].
They are required to pass the “medium” selection criteria described in Ref. [73], and to satisfypT >10 GeV and|η| < 2.5. Signal muon candidates are further required to havepT > 25 GeV, be isolated, and have
|z0sinθ| < 0.5 mm and|d0/σd0| < 3. Calorimeter- and track-based isolation criteria are used to obtain 95% efficiency at pT = 25 GeV, rising to 99% efficiency at pT = 80 GeV [73]. Further, the relative uncertainties on the q/p of each of the ID track alone and muon track alone are required to be less than 80% of the uncertainty on the q/p of the combined track. This reduces the already low rate of grossly mis-measured muons. The total selection efficiency, after the trigger requirements, for single leptons, including both isolation and identification requirements, is about 70% (80%) for electrons (muons) with pT ∼25 GeV, rising to about 90% forpT >200 GeV.
Jets are reconstructed from topological clusters of energy [74] in the calorimeter using the anti-kt al- gorithm [75,76] with a distance parameter of 0.4. Calibration corrections are applied to the jets based on a comparison to jets made of stable particles (those with lifetimesτ >0.3×10⁻¹⁰s) in the MC simulation.
A residual correction is applied to jets in data based on studies of jets balancing with well-calibrated objects in the MC simulation and data [77,78]. Baseline jet candidates are required to havepT >20 GeV and reside within |η| = 4.5. Signal jets are further required to satisfy pT > 30 GeV and reside within
|η| = 2.5. Jets with pT < 60 GeV within |η| = 2.4 are required to pass additional criteria designed to select jets from the hard-scatter and reject those originating from pile-up. This is enforced by using the jet vertex tagger described in Ref. [79]. Finally, events containing a jet that does not pass specific jet quality
2The distance of closest approach between a particle object and the primary vertex (beamline) in the longitudinal (transverse) plane is denoted byz0(d0).
requirements are vetoed from the analysis selection in order to remove events impacted by detector noise and non-collision backgrounds [80,81]. TheMV2C10boosted decision tree algorithm [82,83] identifies jets containingb-hadrons (b-jets) based on quantities such as the impact parameters of associated tracks and any reconstructed secondary vertices. A selection that provides 77% efficiency for taggingb-jets in simulatedt¯tevents is used. These tagged jets are calledb-tagged jets.
Photon candidates are required to pass “tight” selection criteria described in Ref. [84], havepT >25 GeV and reside within|η| = 2.37, excluding the region 1.37 < |η| < 1.6 where there is a discontinuity in the calorimeter. Signal photons are further required to havepT >37 GeV and to be isolated from other objects in the event, usingpT-dependent requirements on both track-based and calorimeter-based isolation.
To avoid the duplication of analysis objects in more than one baseline selection, an overlap removal procedure is applied. Any baseline jet within∆R=0.2 of a baseline electron is removed, unless the jet is b-tagged, in which case the electron is identified as coming from a heavy-flavour decay and is removed instead. Remaining electrons residing within ∆R = 0.4 of a baseline jet are then removed from the event. Subsequently, any baseline muon residing within∆R = 0.2 of a remaining baseline b-tagged jet is discarded. If such a jet is notb-tagged then the jet is removed instead. Any remaining muon with∆R satisfying∆R< min(0.04+(10 GeV)/pT,0.4)of a jet is also discarded. This stage of the overlap removal procedure differs from that used in Ref. [19]. It was improved to retain muons near jet candidates mostly containing calorimeter energy from final state radiation from muons, while still rejecting muons from heavy-flavour decays. Finally, to remove electron candidates originating from muon bremsstrahlung, any baseline electron within∆R=0.01 of any remaining baseline muon is removed from the event. Photons are removed if they reside within∆R = 0.4 of a baseline electron, and any jet within∆R = 0.4 of any remaining photon is discarded.
TheEmiss
T is defined as the magnitude of the negative vector sum of the transverse momenta of all baseline electrons, muons, jets, and photons [85,86]. Low momentum contributions from particle tracks from the primary vertex that are not associated with reconstructed analysis objects are included in the calculation ofEmiss
T . This contribution to theEmiss
T is referred to as the “soft term”.
Models with large hadronic activity are targeted by placing additional requirements on the quantity HT, defined as the scalar sum of thepTvalues of all signal jets, or onHincl
T , the scalar sum of thepTvalues of all signal jets and the two leptons with largestpT.
All MC samples have MC-to-data corrections applied to take into account small differences between data and MC simulation in identification, reconstruction and trigger efficiencies for leptons. ThepTvalues of leptons in MC samples are additionally smeared to match the momentum resolution in data.
6 Event selection
For each search channel, signal regions (SRs) are designed to target events from specific SUSY signal models. Control regions (CRs) are defined to be depleted in SUSY signal events and enriched in specific SM backgrounds, and they are used to assist in estimating these backgrounds in the SRs. To validate the background estimation procedures, various validation regions (VRs) are defined to be analogous to the CRs and SRs, but with less stringent requirements than the SRs onEmiss
T , Hincl
T orHT. Other VRs with additional requirements on the number of leptons are used to validate the modelling of backgrounds in which more than two leptons are expected.
Events in SRs are required to contain at least two signal leptons (electrons or muons). If more than two signal leptons are present in a given event, the selection process continues based on the two leptons with the highestpT in the event.
The selected events must pass at least one of the leptonic triggers. In case of a dilepton trigger being used to select an event, the two leading, highestpT, leptons must be matched to one of the objects that triggered the event. These leptons must also havepThigher than the threshold of the trigger in question. For events selected by a single-lepton trigger, at least one of the two leading leptons must be matched to the trigger object in the same way. The leading two leptons in the event must havepT > 25 GeV, and form an SFOS pair.
As at least two jets are expected in all signal models studied, selected events are further required to contain at least two signal jets. Furthermore, events in which the azimuthal opening angle between either of the leading two jets and the Emiss
T ,∆φ(jet12,pmiss
T ), is less than 0.4 are rejected so as to remove events withEmiss
T from jet mismeasurements. This requirement also suppressestt¯events in which the top-quark, anti-top quark or the entiret¯tsystem, has a large Lorentz boost factor.
The various methods used to perform the background prediction in the SRs are discussed in Section7.
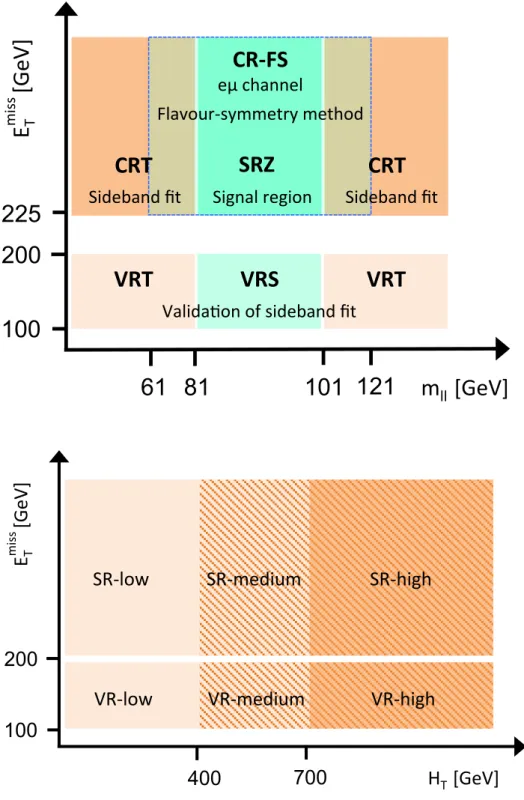
The selection criteria for the CRs, VRs, and SRs are summarised in Tables3 and4. These regions are shown graphically in Figure2.
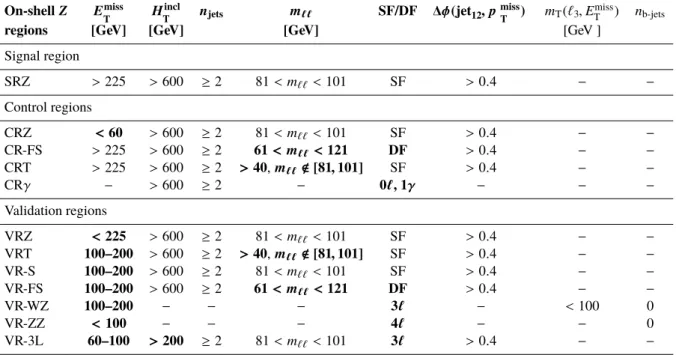
Table 3: Overview of all signal, control and validation regions used in the on-shellZsearch. More details are given in the text. The flavour combination of the dilepton pair is denoted as either “SF” for same-flavour or “DF” for different flavour. All regions require at least two leptons, unless otherwise indicated. In the case of CRγ, VR-WZ, VR-ZZ, and VR-3L the number of leptons, rather than a specific flavour configuration, is indicated. The main requirements that distinguish the control and validation regions from the signal region are indicated in bold. Most of the kinematic quantities used to define these regions are discussed in the text. The quantitymT(`3,Emiss
T )indicates the transverse mass formed by theEmiss
T and the lepton which is not assigned to either of theZ-decay leptons.
On-shellZ Emiss
T Hincl
T njets m`` SF/DF ∆φ(jet12,pmiss
T ) mT(`3,Emiss
T ) nb-jets
regions [GeV] [GeV] [GeV] [GeV ]
Signal region
SRZ >225 >600 ≥2 81<m`` <101 SF >0.4 − −
Control regions
CRZ <60 >600 ≥2 81<m`` <101 SF >0.4 − −
CR-FS >225 >600 ≥2 61< m`` <121 DF >0.4 − −
CRT >225 >600 ≥2 >40,m``<[81,101] SF >0.4 − −
CRγ − >600 ≥2 − 0`, 1γ − − −
Validation regions
VRZ <225 >600 ≥2 81<m`` <101 SF >0.4 − −
VRT 100–200 >600 ≥2 >40,m``<[81,101] SF >0.4 − − VR-S 100–200 >600 ≥2 81<m`` <101 SF >0.4 − −
VR-FS 100–200 >600 ≥2 61< m`` <121 DF >0.4 − −
VR-WZ 100–200 − − − 3` − <100 0
VR-ZZ <100 − − − 4` − − 0
VR-3L 60–100 >200 ≥2 81<m`` <101 3` >0.4 − −
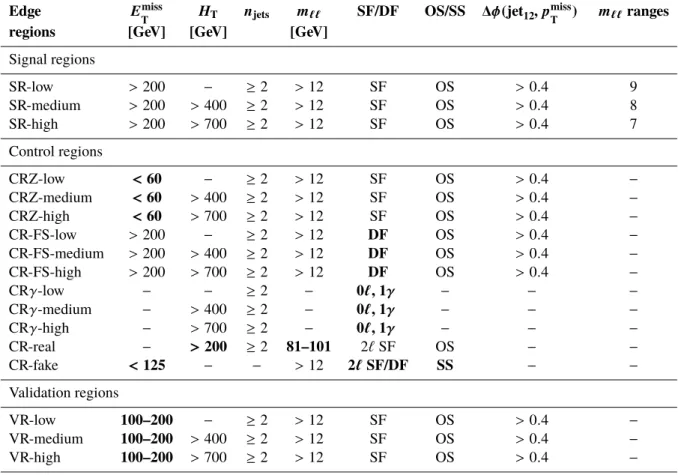
Table 4: Overview of all signal, control and validation regions used in the edge search. The flavour combination of the dilepton pair is denoted as either “SF” for same-flavour or “DF” for different flavour. The charge combination of the leading lepton pairs are given as “SS” for same-sign or “OS” for opposite-sign. All regions requireat least two leptons, with the exception of CR-real, which requiresexactlytwo leptons, and the threeγCRs, which require no leptons and one photon. More details are given in the text. The main requirements that distinguish the control and validation regions from the signal regions are indicated in bold.
Edge Emiss
T HT njets m`` SF/DF OS/SS ∆φ(jet12,pmiss
T ) m``ranges
regions [GeV] [GeV] [GeV]
Signal regions
SR-low >200 − ≥2 >12 SF OS >0.4 9
SR-medium >200 >400 ≥2 >12 SF OS >0.4 8 SR-high >200 >700 ≥2 >12 SF OS >0.4 7 Control regions
CRZ-low <60 − ≥2 >12 SF OS >0.4 −
CRZ-medium <60 >400 ≥2 >12 SF OS >0.4 − CRZ-high <60 >700 ≥2 >12 SF OS >0.4 −
CR-FS-low >200 − ≥2 >12 DF OS >0.4 −
CR-FS-medium >200 >400 ≥2 >12 DF OS >0.4 − CR-FS-high >200 >700 ≥2 >12 DF OS >0.4 −
CRγ-low − − ≥2 − 0`, 1γ − − −
CRγ-medium − >400 ≥2 − 0`, 1γ − − −
CRγ-high − >700 ≥2 − 0`, 1γ − − −
CR-real − >200 ≥2 81–101 2`SF OS − −
CR-fake <125 − − >12 2`SF/DF SS − −
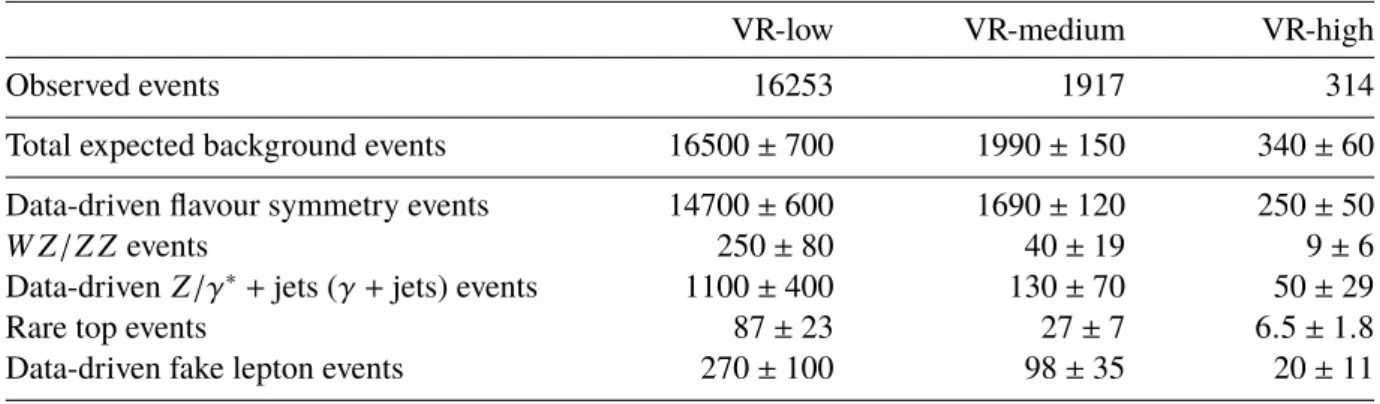
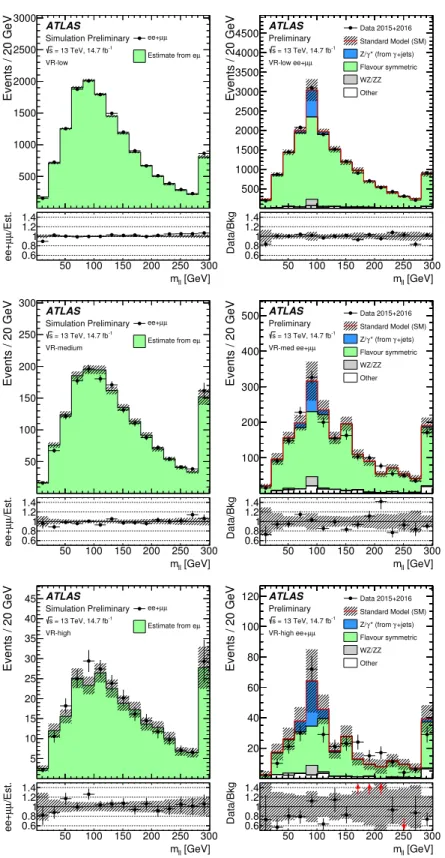
Validation regions
VR-low 100–200 − ≥2 >12 SF OS >0.4 −
VR-medium 100–200 >400 ≥2 >12 SF OS >0.4 − VR-high 100–200 >700 ≥2 >12 SF OS >0.4 −
CR-FS
eμ channel
VRT VRS VRT
m
ll[GeV]
E
T[GeV ]
101 200
225
100
81
Valida2on of sideband fit
61 121
Signal region Sideband fit
CRT
Sideband fit
CRT SRZ
Flavour-symmetry method
miss
H
T[GeV]
E
T[GeV ]
200
100
400 700
miss
SR-low SR-medium SR-high
VR-low VR-medium VR-high
Figure 2: Schematic diagrams of the control, validation and signal regions for the on-shellZ(top) and edge (bottom) searches. For the on-shellZsearch the various regions are shown in them``−Emiss
T plane, whereas in the case of the edge search the signal and validation regions are depicted in theHT−Emiss
T plane.
For the on-shell Z search, the leading leptonpT threshold is raised to 50 GeV to increase the sensitivity to signal models with final-state Z bosons. This is an increased leading lepton pT threshold relative to Ref. [19] and is found to better reject fake lepton candidates from misidentified jets, photon conversions andb-hadron decays, while retaining high efficiency for signal events, which tend to produce boosted Z bosons. To select events containing a leptonically decayingZ boson, the invariant mass of the dilepton system is required to be 81< m`` < 101 GeV. In the CRs and VRs that use theZ mass sidebands only events withm``> 40 GeV are used to reject the lowerm``region dominated by Drell-Yan (DY) production.
In Ref. [19] an “on-Z” SR, denoted SRZ, is defined requiring Emiss
T > 225 GeV and Hincl
T > 600 GeV.
The region is motivated by SUSY signals with high gluino (or squark) mass and high jet activity and also represents the SR for this analysis, SRZ. Since b-jets are not always expected in the simplified models considered here, no requirement is placed onb-tagged jet multiplicity (nb−jets) so as to be as inclusive as possible and to remain in line with Ref. [19]. Dedicated CRs are defined, with selection criteria similar to those of SRZ, to estimate the contribution from the dominant SM backgrounds in SRZ. These CRs are discussed in more detail in Section7.
The edge selection requires at least two leptons withpT > 25 GeV. The search is performed across the fullm``spectrum, with the exception of the region withm``< 12 GeV, which is vetoed to reject low-mass DY events and the J/ψ andΥ resonances. Three regions are defined to target signal models with low, medium and high values of∆mg˜ = mg˜ −m
χ˜10, denoted SR-low, SR-medium, and SR-high, respectively.
All these regions require Emiss
T > 200 GeV. SR-medium and SR-high also include the requirements HT >400 GeV andHT > 700 GeV, respectively, to further isolate high∆mg˜events. Here the leptons are not included in theHTdefinition to avoid introducing any bias in them``distribution. Events selected in SR-low, SR-medium and SR-high are further grouped into non-orthogonalm``windows, which represent the search regions used in the edge analysis. The dilepton mass ranges of these are chosen to maximise sensitivity to the target signal models, with the window boundaries being motivated by the dilepton mass endpoints of generated signal points. In total, 24m`` windows are defined by selecting ranges with the best expected sensitivity to signal models. Of these windows, nine are in SR-low, eight are in SR-medium and seven are in SR-high. Details on them`` definitions in these regions are given along with the results in Section9. Models without light sleptons are targeted by windows withm`` < 60 GeV orm`` <80 GeV for∆m< mZleading to off-shellZ bosons, and by the window with 81< m`` <101 GeV for∆m> mZ leading to on-shell Z bosons. Models with light sleptons are targeted by the remainingm`` windows, which cover the full m`` range. The edge selection and on-shell Z selection are not orthogonal. In particular, SR-medium in the range 81<m`` < 101 GeV overlaps significantly with SRZ.
For the combinedee+ µµchannels, the typical signal acceptance times efficiency values for the signal models considered in SRZ are 2–8%, and 8–40%, 3–35% and 1–35% inclusively in m`` for SR-low, SR-medium and SR-high, respectively. The on-shellZ and edge analyses are each optimised for different signal models. Given the different signatures, there are cases where signal contamination in CRs or VRs could be significant. For example, CRT in Table3is used to normaliset¯t MC sample to data as a cross-check in the on-shell Z search, but it is in a region where the signal contamination from signal models targeted by the edge search can be up to 80% relative to the expected background. In addition, the contamination from on-shell Z signals in the region used to validate the Z/γ∗+jets and flavour- symmetric estimates, VR-S, is up to 60% for models withm(g)˜ < 1 TeV. The contamination from the slepton models in the DF regions used to estimate the flavour-symmetric backgrounds in the edge search, CR-FS-low/medium/high in Table4, is generally less than 20% for models withm(g)˜ > 600 GeV. In general, for models with large signal contamination in CRs or VRs, the signal-to-background ratio in the SRs is very large (e.g. signal-to-background ratio of∼10 in the SR for models with signal contamination
of 50% in the CRs).
7 Background estimation
The dominant background processes in the SRs are “flavour-symmetric” (FS) backgrounds, where the ratio ofee, µµ andeµ dileptonic branching fractions is 1:1:2 because the two leptons originate from independentW →`νdecays. This background is dominated byt¯t(50−70%) and also includesW W,W t, andZ →ττprocesses. The FS background constitutes 60−90% of the expected background in the SRs, and is estimated using control samples ofeµevents.
As all the SRs have a highEmiss
T requirement, Z/γ∗+jets events only enter the SRs when there is large Emiss
T originating from instrumental effects or from neutrinos in jet fragments This background is generally small, but it is difficult to model with MC simulation and can mimic signal, particularly for the on-shellZ search. This background is estimated using a control sample ofγ+jets events in data, which have similar kinematic properties asZ/γ∗+jets and similar sources ofEmiss
T .
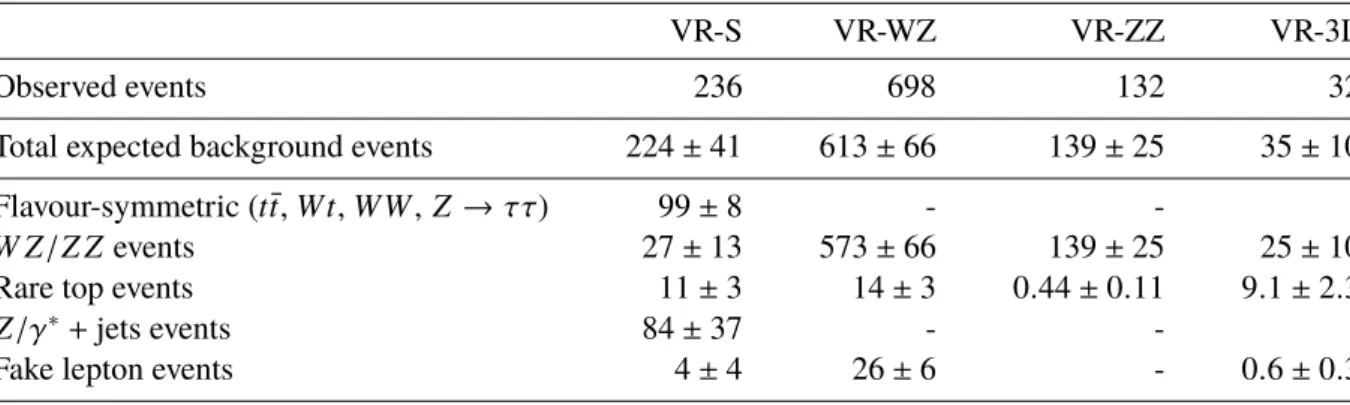
The production ofW Z/Z Z dibosons makes up approximately 30% of the SM background in SRZ and constitutes 5− 20% of the background in the edge SRs. These backgrounds are estimated from MC simulation, after validation in dedicated 3`(W Z) and 4`(Z Z) VRs. Rare top backgrounds, which include ttW¯ ,tt Z¯ andttW W¯ processes, constitute<5% of the SM expectation in all SRs, and are estimated from MC simulation. The contribution from events with fake or misidentified leptons is at most 15% (in one of the edgem``ranges in SR-low), but is generally small at< 5% of the expected SM background in most SRs.
7.1 Flavour-symmetric backgrounds
The flavour-symmetric background is dominant in all SRs. To estimate the contribution of this background to each SR, the so-called “flavour-symmetry” method, detailed in Ref. [19], is used. In this method, data events from a DF control sample, which is defined with identical kinematic requirements with respect to the SR, are used to determine the expected event yields in the SF channels. In the on-shell Z analysis, the method is used to provide a prediction for the background yield in theZwindow, defined as 81 < m`` < 101 GeV. In the edge analysis, the method is extended to provide a prediction for the full dilepton mass shape, such that a prediction can be extracted in any of the pre-definedm``windows.
For the edge search, the flavour-symmetric contribution to eachm``bin of the signal regions is predicted using data from the corresponding bin from aneµcontrol region. All edge control regions (definitions can be seen in Table4) are 88−97% pure in flavour-symmetric processes (this purity is calculated from MC simulation).
For the on-shell search, this method is complicated slightly by a widening of them`` window used in CR-FS, theeµcontrol region (defined in Table3). The window is enlarged to 61 < m`` < 121 GeV to approximately triple the amount of data in the control region and thus increase the statistical precision of the method. This results in a region that is∼ 95% pure in flavour-symmetric processes (the expected composition of this 95% is∼80%t¯t,∼10%W t,∼10%W W and<1%Z →ττ).
Apart from them`` widening in CR-FS, the method used is identical for the on-shell and edge regions.
Events in the control regions are subject topT- andη-dependent correction factors measured in data and
MC simulation. Because the triggers used are not identical in 2015 and 2016, these factors are measured separately for each year and account for the different identification and reconstruction efficiencies for electrons and muons, as well as the different trigger efficiencies for the di-electron, di-muon and electron- muon selections. The estimated numbers of events in the SF channels,Nee/µµest , are given by:
Neeest= 1 2
· fFS· fZ-mass·
Neµdata
X
i
ke(pi,µ
T , ηi,µ)·α(pi,µ
T , ηi,µ), (1)
Nµµest= 1 2
· fFS· fZ-mass·
Neµdata
X
i
kµ(pi,e
T , ηi,e)·α(pi,e
T , ηi,e), (2)
where Neµdata is the number of data events observed in a given control region, α(pi
T, ηi) accounts for the different trigger efficiencies for SF and DF events, and ke(pi
T, ηi) and kµ(pi
T, ηi) are electron and muon selection efficiency factors for the kinematics of the lepton being replaced, in eventi. The trigger and selection efficiency correction factors are derived from the events in an inclusive on-Z selection (81< m``/GeV<101,≥2 jets), according to:
ke(pT, η) = s
Neemeas
Nµµmeas (3)
kµ(pT, η) = s
Nµµmeas
Neemeas (4)
α(pT, η)=
qtrigee(p`1
T, η`1)×trigµµ(p`1
T, η`1) trigeµ(p`1
T, η`1) (5)
wheretrigee/µµ is the trigger efficiency and Nee/µµmeas is the number of ee/µµevents in the inclusive on-Z region outlined above. Hereke(pT, η)andkµ(pT, η)are calculated separately for leading and sub-leading leptons. The correction factors are typically within 10% of unity, except in the region |η| < 0.1 where, because of the lack of coverage of the muon spectrometer, they are up to 50% from unity. For all background estimates based on the flavour symmetry method, results are computed separately foreeand µµand then summed to obtain the combined prediction. The resulting prediction in the SF channels are scaled according to the fraction of flavour-symmetric backgrounds in eacheµcontrol sample, fFS (95% in CR-FS), which is determined by subtracting non flavour-symmetric backgrounds taken from MC from the data observed in the analogouseµregion. In the on-shell case, the result is also scaled by the fraction of events in CR-FS expected to be contained within 81<m``/GeV< 101, fZ−mass(38%), which is otherwise set to 1 for the edge regions. The validity of extrapolating inm``between CR-FS and SRZ was checked by comparing them``shapes in data and MC in a region similar to VR-S, but with them``
requirement relaxed andHincl
T >300 GeV to obtain a high statistics sample. The resulting on-Zfractions in MC were found to agree with data within statistical uncertainties, which are summed in quadrature to assign a systematic uncertainty. In the case of the edge search the fill m`` distirbution is validated by performing a flavour-symmetry method ont¯tMC in VR-Low, VR-Medium and VR-High. This procedure
results in good closure, which is further discussed in Section7.5. The difference between the prediction and the observed distribution is used to assign an MC non-closure uncertainty on the estimate.
The flavour-symmetry method in SRZ is further cross-checked by performing a profile likelihood fit [87]
of MC yields to data in theZ-mass sidebands (m``<[81,101] GeV), the region denoted CRT in Table3, which is dominated bytt¯(with a purity of > 75%) and contains 273 events in data. The other flavour- symmetric processes in this region contribute∼ 12% (W t), 10% (W W) and< 1% (Z → ττ). All SM background processes are taken directly from MC simulation in this cross-check, including backgrounds also estimated using the flavour-symmetry method. The normalisation of the dominantt¯tbackground is a free parameter and is the only parameter affected by the fit. For this cross-check, the contamination from Beyond Standard Model processes in the Z-mass sidebands is assumed to be negligible. The fit results in a scale factor of 0.64 for thet¯tyield predicted by simulation. This result is extrapolated from theZ-mass sidebands to SRZ and gives a prediction of 29±7 events, which is consistent with the nominal flavour-symmetry background estimate in this region of 33±4.
The sideband fit is repeated at lowerEmiss
T in VRT, with the results being propagated to VR-S, so as to test them``extrapolation used in the sideband fit method. The normalisation to data in this region, which is at lowerEmiss
T relative to CRT, results in a scale factor of 0.80 for thett¯yield predicted by simulation.
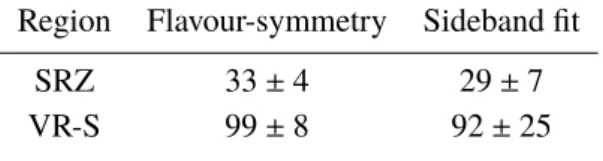
The number of FS events predicted in VR-S using the sideband fit in VRT is compatible with the number estimated by applying the FS method to data in VR-FS. The results of the background estimate in both VR-S and SRZ obtained from the flavour-symmetry method are compared with the values obtained by the sideband fit cross-check in Table5. The methods result in consistent estimates in both regions. Further results in the edge VRs are discussed in Section7.5.
Table 5: Comparison of the predicted yields for the flavour-symmetric backgrounds in SRZ and VR-S as obtained from the nominal data-driven method using CR-FS and theZ-mass sideband method. The quoted uncertainties include statistical and systematic contributions.
Region Flavour-symmetry Sideband fit
SRZ 33±4 29±7
VR-S 99±8 92±25
A potential cause of the low scale factors obtained from the sideband fit at large HT and Emiss
T is
mismodelling of the top-quarkpTdistribution, where measurements oft¯tdifferential cross sections by the ATLAS and CMS experiments indicate that the top-quarkpT distribution predicted by most generators is harder than that observed in data [88, 89]. Corrections to the MC predictions according to NNLO calculations provided in Ref. [90] indicate an improvement in the top-quark pair modelling at high HT andEmiss
T , leading to scale factors closer to unity. Thanks to the robustness of the data-driven method used to estimatet¯tcontributions in this analysis, the results do not depend on these corrections. They are therefore not applied to thet¯tMC for this cross-check.
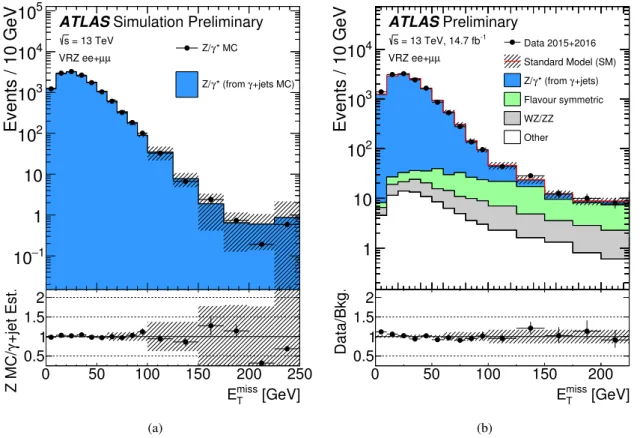
7.2 Z/γ∗+jets background
The Z/γ∗+jets background estimate is based on a data-driven method that usesγ+jets events in data to model theEmiss
T distribution ofZ/γ∗+jets. Theγ+jets andZ/γ∗+jets processes have similar event topologies, with a well measured object recoiling against a hadronic system, and both tend to haveEmiss
T