ATLAS-CONF-2017-054 10July2017
ATLAS CONF Note
ATLAS-CONF-2017-054
6th July 2017
Measurement of the inclusive t t ¯ cross-section in the lepton+jets channel in √ p p collisions at
s = 8 TeV with the ATLAS detector
The ATLAS Collaboration
The inclusive t t ¯ production cross-section is measured in the lepton+jets channel using 20.2 fb
−1of proton–proton collision data at a centre-of-mass energy of 8 TeV recorded with the ATLAS detector at the LHC. Major systematic uncertainties due to the model- ling of the jet energy scale and b -tagging efficiency are constrained by separating selec- ted events into three disjoint regions. In order to reduce systematic uncertainties in the most important background, the W + jets process is modelled using Z + jets events in a data- based approach. The inclusive t t ¯ cross-section is measured with a precision of 5.7 % to be σ
tt¯= 248 . 3 ± 0 . 7 ( stat .) ± 13 . 4 ( syst .) ± 4 . 7 ( lumi .) pb, assuming a top-quark mass of 172.5 GeV. The result is in agreement with the Standard Model prediction.
© 2017 CERN for the benefit of the ATLAS Collaboration.
Reproduction of this article or parts of it is allowed as specified in the CC-BY-4.0 license.
1 Introduction
The top quark is the most massive known elementary particle. Given that its Yukawa coupling to the Higgs boson is close to unity, it may play a special role in electroweak symmetry breaking [1, 2]. Studies of top-quark production and decay are major research goals at the LHC, providing both a precise probe of the Standard Model (SM) [3] and a window for physics beyond the Standard Model (BSM) [4].
The LHC supplies a large number of top-quark events to its precision detectors, offering an excellent environment for such studies.
In proton-proton collisions, the dominant production process of top quarks is pair production via the strong interaction. The measurement of the production cross-section provides a stringent test of QCD calculations with heavy quarks [5], allows for a determination of the top-quark mass in a well-defined renormalisation scheme [6, 7], and can be sensitive to to potential new physics such as top-quark partners degenerate with the SM top quark [8].
The predicted inclusive t¯ t cross-section for a centre-of-mass energy of
√ s = 8 TeV, assuming a top-quark mass m
top= 172 . 5 GeV, is
σ(pp → t¯ t) = 253
+13−15pb . (1)
It is calculated at next-to-next-to-leading order (NNLO) in QCD including resummation of next-to-next- to-leading logarithmic (NNLL) soft-gluon terms with Top++ (v2.0) [5, 9–13]. The uncertainties due to the parton distribution functions (PDFs) and α
Sare calculated using the PDF4LHC prescription [14]
where the uncertainties of MSTW2008 68 % CL NNLO [15, 16], CT10 NNLO [17, 18] and NNPDF 2.3 [19] PDF sets are added in quadrature to the scale uncertainty. Comparable results are obtained using a different resummation technique as reported in Ref. [20]. The total uncertainty of about 6 % sets the current goal for the experimental precision.
Measurements of the t t ¯ cross-section have been published for several centre-of-mass energies between 1.96 and 13 TeV in p p ¯ and pp collisions. At the Tevatron, a combination by the D0 and CDF collabora- tions of the t¯ t cross-section measurements at a centre-of-mass energy of 1.96 TeV is published with an uncertainty of 5.4 % [21]. The most precise measurement for a centre-of-mass energy of 8 TeV, with a total uncertainty of 3.2 %, is performed by the ATLAS collaboration in the dilepton channel, where both top quarks decay via t → `νb [22]. Further measurements at 7, 8 and 13 TeV in the same final state are published by the ATLAS and CMS collaborations [23–25].
The measurement reported in this paper is performed in the semileptonic decay mode (lepton+jets), where one W boson decays leptonically and the other W boson decays hadronically, i.e.
t t ¯ → `νb + q q ¯
0b. ¯ (2)
Here the final state charged lepton ` is either an electron or a muon1.
It is important to measure the t¯ t cross-section in different decay modes, in order to understand if the measured cross-sections are consistent with each other due to the different dependencies on the experimental uncertainties. Furthermore, new physics processes can contribute in different ways to the different decay modes.
1Events involvingW →τνdecays with a subsequent decay of theτ lepton to eithereνeντorµνµντ are included in the signal.
The analysis is based on data collected with the ATLAS detector at the LHC corresponding to an integrated luminosity of 20.2 fb
−1at a pp centre-of-mass energy of
√ s = 8 TeV. The most precise cross-section measured in this channel at
√ s = 8 TeV published by the CMS collaboration reached an uncertainty of 6.8 % [26]. This analysis supersedes the previous measurement from the ATLAS collaboration which achieved a total uncertainty of 9.4 % using the same dataset [27]. This analysis improves on the previous result by constraining important sources of the systematic uncertainty and by splitting the overall sample of t¯ t candidates into three signal regions.
2 ATLAS detector
The ATLAS detector [28] is a multi-purpose particle physics detector with forward-backward symmetry and a cylindrical geometry2. The inner tracking detectors (ID) are surrounded by a thin superconducting solenoid magnet, electromagnetic and hadronic calorimeters, and a muon spectrometer (MS) inside a magnetic field generated by three superconducting toroidal magnets of eight coils each. The inner detector, in combination with the 2T magnetic field from the solenoid, provides precision momentum measurements for charged particles within the pseudorapidity range | η | < 2.5. It consists of, from the interaction point to the outside, a silicon pixel detector and a silicon microstrip detector (together allowing a precise and efficient identification of secondary vertices), complemented with a straw-tube tracker contributing transition radiation measurements to electron identification. The calorimeter system covers the pseudorapidity range |η| < 4.9. A high-granularity liquid-argon (LAr) sampling calorimeter with lead absorbers provides the measurement of electromagnetic showers within |η| < 3.2. In the ID acceptance region, | η | < 2.5, the innermost layer has a fine segmentation in η to allow separation of electrons and photons from π
0and to improve the resolution of the shower position and direction measurements. Hadronic showers are measured by a steel/plastic scintillator tile calorimeter in the central region, |η | < 1.7, and by a LAr calorimeter in the end-cap region, 1.5 < |η| < 3.2. In the forward region, measurements of both electromagnetic and hadronic showers are provided by a LAr calorimeter covering the pseudorapidity range 3.1 < |η| < 4.9. The muon spectrometer combines trigger and high precision tracking detectors, and allows measurements of charged particle trajectories within |η| < 2.7.
The combination of all ATLAS detector sub-systems provides charged particle tracking, along with identification for lepton and photons, in the pseudorapidity range |η| < 2.5.
A three-level trigger system is used to select interesting events [29]. An hardware-based first level trigger uses a subset of detector information to bring the event rate below 75 kHz. Two additional software-based trigger levels together reduce the event rate to about 400 Hz on average, depending on the data-taking conditions.
2ATLAS uses a right-handed coordinate system with its origin at the nominal interaction point (IP) in the centre of the detector and thez-axis along the beam pipe. Thex-axis points from the IP to the centre of the LHC ring, and they-axis points upwards. Cylindrical coordinates(r, φ)are used in the transverse plane,φbeing the azimuthal angle around the z-axis. The pseudorapidity is defined in terms of the polar angleθasη=−ln tan(θ/2), and the distance∆Rin theη−φ space is defined as∆R≡p
(∆η)2+(∆φ)2.
3 Data and simulated events
This analysis is performed using pp collision data recorded at a centre-of-mass energy of
√ s = 8 TeV, corresponding to the full 2012 dataset. The data-taking periods in which all the subdetectors were operational are considered resulting in a data sample with an integrated luminosity of L
int= 20 . 2 fb
−1. Detector and trigger simulations are performed within the GEANT4 framework [30, 31]. The same offline reconstruction methods used on data are applied to the simulated events. Minimum bias events generated with Pythia8 [32] are used to simulate multiple pp interactions in the same and nearby bunch crossings (pile-up). The distribution of the number of pile-up interactions in the simulation is reweighted to match the corresponding distribution in the data. The simulated pile-up events are reweighted according to the instantaneous luminosity spectrum in the data.
Signal t¯ t events are simulated using the Powheg generator (r3026) [33] with the CT10 PDF sets [17].
The renormalisation and factorisation scales are set to the value µ = q m
2top
+ p
2T
(t) where p
T(t) is the p
Tof the top quark, evaluated for the underlying Born configuration, i.e. before radiation. The h
dampparameter, which controls the transverse momentum p
Tof the first additional emission beyond the Born configuration, is set to m
top. The main effect of this is to regulate the high- p
Temission against which the t t ¯ system recoils. Parton showering, hadronisation and the underlying event are simulated with Pythia (v6.428) [34] and the Perugia2011C set of tuned parameters [35].
For systematic studies of the t t ¯ process, alternative generators and parameter variations in the set of tuned parameters of Pythia are used. The Powheg generator interfaced to Herwig (v6.5.20) [36] is used for hadronisation modelling studies, while MC@NLO (v4.09) [37, 38] interfaced to Herwig is used to study the dependence on the matching method between the next-to-leading order (NLO) matrix element (ME) generation and the parton shower (PS) evolution. In case of Herwig showered events, the Jimmy (v4.31) [39] model with the ATLAS AUET2 [40] set of tuned parameters is used to simulate the underlying event. Variations of the amount of additional radiation are studied using events generated with the Powheg-Box + Pythia 6 generators after changing the hard-scatter scales and the scales in the parton shower simultaneously. In these samples, a variation of the factorisation and renormalisation scales by a factor of 2.0 is combined with the Perugia2012radLo parameters and a variation of both scale parameters by a factor of 0.5 is combined with the Perugia2012radHi parameters [35]. In the case of the up-variation, the h
dampparameter is also changed and set to twice the top-quark mass [41].
For the generation of the associated production of an on-shell W boson and a top quark ( Wt ), and single top-quark production in the s - and t -channel, the Powheg (r2819, r2556) [42–44] generator with the CT10 PDF sets interfaced to Pythia using the Perugia2011C set of tuned parameters is used. The Wt process has a predicted production cross-section of 22.3 pb [45], calculated at approximate NNLO accuracy with an uncertainty of 7.6 % including scale and PDF uncertainties. The cross-sections for single top-quark production in the s - and t -channels are calculated with the Hathor v2.1 [46] tool at NLO precision, based on work documented in Ref. [47]. Uncertainties in the hard scatter scales and the PDFs are estimated using the same methodology as for t¯ t production. For t -channel production, this leads to a cross-section of 84.6 pb with a total uncertainty of 5 %, while for s -channel production a cross-section of 5.2 pb with a total uncertainty of 4.2 % is predicted.
All top-quark processes are simulated with a top-quark mass of 172.5 GeV and a width of 1.32 GeV
modelled using a Breit-Wigner distribution. The top quark decays via t → W b 100 % of the time.
Vector-boson production in association with jets ( W / Z +jets) is simulated with Alpgen (v2.14) [48], using the CTEQ6L1 set of PDFs [49]. The partonic events are showered with Pythia using the Perugia2011C set of tuned parameters. W + jets and Z +jets events with up to five additional partons are generated, and the overlap between ME and PS is removed with the “MLM” matching scheme [50].
The double counting between the inclusive W + n parton samples and dedicated samples with at least one heavy quark ( c - or b -quark) in the ME is removed by vetoing events based on a ∆R matching. The cross-sections for inclusive W - and Z -boson production are predicted with NNLO precision using the FEWZ program [51, 52] and are estimated to be 12.1 nb and 1.13 nb, respectively. The uncertainty is 4 %, including the uncertainty from the PDF and scale variations.
VV events ( WW , W Z and Z Z ) are produced using the Sherpa (v1.4.1) [53] generator with the PDF set CT10, up to three additional partons in the ME, and a dedicated parton-shower tuning developed by the Sherpa authors. The CKKW method [54] is used to remove overlap between partonic configurations generated by the ME and by PS. All three processes are normalised to the inclusive NLO cross-sections provided by MCFM [55] which are 56.8 pb for WW , 7.36 pb for Z Z , and 21.5 pb for W Z production.
The total uncertainty for each of the three processes, including scale variations and uncertainties in the PDF, is estimated to be 5 %.
4 Object definition
In this analysis, t t ¯ candidate events are identified by means of isolated electrons and muons, jets, some of which are possibly b -tagged as likely to contain b-hadrons, and sizable missing transverse momentum.
The definitions of these reconstructed objects are discussed in this section.
Electrons : Electron candidates are reconstructed by matching tracks from the ID to energy deposits (clusters) in the electromagnetic calorimeter [56]. Selected electrons are required to satisfy strict quality requirements in terms of shower shape, track properties and matching quality. Electron candidates are required to be within |η| < 2 . 47, and candidates in the calorimeter barrel-endcap overlap-region, 1 . 37 < |η| < 1 . 52 are excluded. Hadronic jets misidentified as electrons, electrons from heavy- flavour decays, and photon conversions become the major backgrounds for isolated high- p
Telectrons associated with a W -boson decay. Suppression of these backgrounds is possible via isolation criterion which require minimum calorimeter activity and small sum of track p
Tin an η - φ cone around the electron. The electromagnetic (EM) calorimeter isolation variable is defined as the scalar sum of the transverse momenta of calorimeter energy deposits and the track isolation variable is defined as the scalar sum of all track transverse momenta excluding the track belonging to the electron candidate [57].
The isolation cuts imposed on the electron candidates are tuned to achieve a uniform selection efficiency of 90 % across electron transverse energy E
Tand pseudorapidity η . The electron pseudorapidity is taken from the associated track. Thresholds are applied on the EM calorimeter isolation in a cone size of 0.2 around the electron and track isolation in a cone size of ∆R = 0 . 3.
Muons : Muon candidates are reconstructed by matching track segments in the muon spectrometer with the inner detector tracks [58]. The final candidates are required to be in the pseudorapidity region of
|η| < 2 . 5. A set of requirements on the number of hits in the inner detector must also be satisfied by
muon candidates. An isolation requirement [59] is applied to reduce the contribution of muons from
heavy-flavour decays. The isolation variable is defined as the scalar sum of the transverse momenta
of all tracks originating from the primary vertex with p
Tabove 1 GeV, (except the one matched to the
muon) within a cone with radius R
iso= 10 GeV /p
T(µ) , where p
T(µ) is the transverse momentum of the muon. Muon candidates are accepted when the isolation divided by the p
T( µ) is less than 0.05. Muons overlapping with a jet within ∆R < 0 . 4 are removed from the event.
Jets : Jets are reconstructed using the anti- k
talgorithm [60] with a radius parameter of 0.4, using topological clusters calibrated with the local cluster weighting (LCW) method [61] as inputs to the jet finding algorithm. Jets are calibrated using a combination of an energy- and η -dependent simulation- based scheme and an in-situ correction scheme based on data [62]. Additionally a pileup correction is applied on both data and MC before selection to further calibrate the jets [63]. Jets overlapping with identified electron candidates within a cone of ∆R < 0 . 2 are removed from the list of jets, as the jet and the electron are very likely to correspond to the same physics object. After the overlap removal, if there are still electrons within ∆R < 0 . 4 distance to a jet, the electron is removed from the event. To reject jets likely to have originated from pile-up, a quantity called jet vertex fraction (JVF) is defined as the ratio of Í
p
T,i∈PVof all tracks of the jet originating from the primary vertex to the Í
p
T,iof all tracks of the jet:
JVF =
Í p
T,i∈PVÍ p
T,i(3)
Jets with |η| < 2 . 4 and p
T< 50 GeV are required to have | JVF | > 0 . 5.
Identification of b-quark jets : One of the most important selection criteria for the analysis of events containing top quarks is the identification of jets likely to contain b -hadrons, called b -tagging. Identi- fication of b -jets is based on the long lifetime of b -hadrons resulting in a significant flight path length, leading to reconstructable secondary vertices and tracks with large impact parameters relative to the primary vertex. In this analysis, a neural network-based algorithm is used at a working point corres- ponding to a b -tagging efficiency in the simulated t¯ t events of 70 %, a c -jet rejection factor of 5 and light-flavour jet rejection factor of 140 [64]. Correction factors applied to simulated events compensate for differences between data and simulation in the tagging efficiency for b , c and light flavour jets.
The correction for b -jets is derived from t¯ t events in the dilepton channel and dijet events, and the corrections are consistent with unity with uncertainties at the level of a few percent over most of the jet p
Trange [64].
Missing Transverse Momentum : The missing transverse momentum is a measure of the momentum of the escaping neutrinos. It also includes energy losses due to detector inefficiencies and its resolution, leading to the mis-measurement of the true transverse energy E
Tof the final interacting objects. The vector of the transverse components of the missing energy, E ®
missT
is calculated as the vector sum over all topological clusters in the event, and is further refined by applying object level corrections for the contributions which arise from identified electrons, muons and jets [65]. The magnitude of the missing transverse momentum vector is defined as E
missT
= | ® E
missT
| .
5 Event selection and classification
This section describes the selection of t t ¯ candidate events. The data sets used in this analysis are obtained
from high- p
Tsingle-electron or single-muon triggers. For the electron channel, a calorimeter energy
cluster needs to be matched to a track and the trigger electron candidate is required to have E
T> 60 GeV
or E
T> 24 GeV with additional isolation requirements [29]. The single-muon trigger [66] requires
either an isolated muon with p
T> 24 GeV or a muon with p
T> 36 GeV.
Each event is required to have at least one vertex reconstructed from at least five tracks. The vertex with the largest sum of p
2T
of the associated tracks is chosen as the primary vertex. Events containing any jets with p
T> 20 GeV failing to satisfy quality criteria defined in Ref. [67] are rejected, in order to suppress background from beam gas or beam halo interactions, cosmic rays and calorimeter noise.
Depending on the accepted trigger, events are selected which contain exactly one isolated electron or muon with p
T> 25 GeV. In addition to the requirements explained in Sect. 4, the ∆R between the reconstructed lepton and the trigger-lepton has to be less than 0.15. Events containing an electron candidate and a muon candidate sharing an ID track are discarded.
Furthermore, events must have at least four jets with p
T> 25 GeV and |η | < 2 . 5. At least one of the jets has to be b -tagged. To enhance the fraction of events with a leptonically decaying W boson, events are required to have E
missT
> 25 GeV and the transverse mass m
T(W) of the lepton - E
missT
pair is required to be
m
T(W) = r
2 p
T(`) · E
missT
h 1 − cos
∆φ
`, ® E ®
missT
i > 30 GeV , (4)
with p
T(`) the transverse momentum of the charged lepton and ∆φ the angle in the transverse plane between the charged lepton and the E ®
missT
.
The measurement of the t¯ t cross-section is performed by splitting the selected sample into three disjoint signal regions. These have different sensitivities to the various backgrounds, to the production of additional radiation, and to detector effects.
• SR1 : ≥ 4 jets, 1 b -tag
In this region, events with at least four jets of which exactly one is b -tagged are selected. This region has the highest background fraction of all three signal regions, with W + jets being the dominat background. The number of selected events is the highest of the signal regions.
• SR2 : 4 jets, 2 b -tags
In this region, events with exactly four jets of which exactly two are b -tagged are selected.
Small background is expected in this region and it provides an unambiguous association of the reconstructed objects to the top-quark decay-products. In particular, the two untagged jets are likely to originate from the hadronically decaying W boson. The reconstructed W boson mass is sensitive to the jet energy scale and to additional radiation.
• SR3 : ≥ 4 jets, ≥ 2 b -tags (excluding events from SR2 )
In the third region, events are required to have at least four jets with at least two b -tagged jets. Events with four jets and exactly two b -tags are assigned to SR2. This region includes t t ¯ events with extra jet radiation including extra t t ¯ + heavy flavour production and is sensitive to the efficiency of identifying c -jets, originating mainly from the W → cs decay, as b -jets. The expected background is the smallest of the signal regions.
For the determination of the t¯ t cross-section a discriminant variable in each signal region is defined.
The number of t¯ t events is extracted using a simultaneous fit of all three discriminant distributions to
observed data. In order to reduce systematic uncertainties due to the jet energy scale and b -tagging
efficiency, their effects on the signal and background distributions are parametrised with nuisance
parameters, which are included in the fit.
6 Background modelling and estimation
The dominant background to t¯ t pair production is W + jets production. This analysis uses a sample defined from collision data to model the discriminant distribution shapes for this background, while the normalisation in each signal region is determined in the final fit. The multijet background process, which is difficult to model in the simulation, is also modelled using collision data but normalised using control regions. All remaining backgrounds are determined using simulated events and theoretical predictions.
The method to obtain a modelling of the W + jets background shape from data is based on the similarity of the production and decay of the Z boson to that of the W boson.
First, an almost background-free Z + jets sample is selected in the following way:
• Events are required to contain exactly two opposite charged leptons of the same flavour, i.e. e
+e
−or µ
+µ
−.
• The dilepton invariant mass m(``) has to match the Z -boson mass (80 ≤ m(``) ≤ 102 GeV).
These events are then ‘converted’ into W + jets events. This is achieved in a first step by boosting the leptons of the Z -boson decay into the Z boson rest-frame, scaling their momenta to that of a lepton decay from a W boson by the ratio of the boson masses and boosting the leptons back into the laboratory system.
p ®
0∗`i= m
Wm
Zp ®
∗`i(5)
where p ®
∗`iis the momentum vector of lepton i in the Z-boson rest frame, m
Wand m
Zare the masses of the W- and Z-bosons respectively and p ®
0∗`iis the scaled momentum vector of lepton i in the Z-boson rest frame.
After this conversion, one of the leptons is randomly chosen to be removed, and the E ®
missT
is re-calculated.
Finally, the event selection cuts discussed in Sect. 5 are applied, except for the b -tagging requirement.
In the following, this sample is referred to as the Z to W sample.
Detailed studies are performed in simulation and in validation regions, e.g. requiring exactly two jets instead of four, to show the applicability of this method for the extraction of the t¯ t cross-section.
As an example two important variables, discriminating between W + jets and t t ¯ events, are compared between simulated W + jets events with at least one b -tag and Z to W events derived from a simulated Z + jets sample with no b -tagging requirement. Fig. 1 shows these variables: the event-shape variable aplanarity and the mass of the hadronically decaying top-quark candidate. Details about the top-quark reconstruction are given in Sect. 7. The aplanarity is defined as
A = 3 2
λ
3, (6)
where λ
3is the smallest eigenvalue of the sphericity tensor, defined by S
αβ=
Í
i
p
αip
βiÍ
i
| p
i|
2.
Here, α, β correspond to the x , y and z momentum components of final state object i in the event, i.e.
the jets, the charged lepton and the reconstructed neutrino (see Sect. 7).
Fraction of events / 0.02
0 0.1 0.2
Simulation Preliminary
ATLAS s = 8 TeV
W+Jets ZtoW
MC stat. uncertainty
aplanarity
0 0.1 0.2 0.3
rel. diff.
-0.5 0 0.5
(a)
Fraction of events / 20 GeV
0 0.05 0.1
Simulation Preliminary
ATLAS s = 8 TeV
W+Jets ZtoW
MC stat. uncertainty
) [GeV]
bjj m(
0 100 200 300 400 500
rel. diff.
-0.5 0 0.5
(b)
Figure 1: Probability densities of(a)the aplanarity and (b) the mass of the hadronically decaying top quark distributions for simulatedW+ jets events with at least four jets and at least oneb-tag andZtoW events derived from a simulatedZ+ jets sample with at least four jets and nob-tagging requirement. The relative difference between the numbers ofZtoW andW+ jets events in each bin is shown in the lower histogram. The gray error band represents the Monte Carlo statistical uncertainty of theW+ jets sample. Events beyond thex-axis range are included in the last bin.
Residual differences between the shapes of the W + jets and Z to W templates are accounted for as a systematic uncertainty in the analysis. Since the method only provides shape information, the number of expected events for the W + jets process in the signal regions is obtained from the acceptance of simulated samples using Alpgen + Pythia and normalised to the inclusive NNLO W + jets cross- section as described in Sect. 3. These numbers are only used as starting points for fit in the final statistical analysis and to provide an pre-fit event yield.
Multijet events may be selected if a jet is misidentified as an isolated lepton or if the event has a non- prompt lepton that appears to be isolated (fake lepton). The normalisation of the multijet background is obtained from a fit to the observed E
missT
in the electron channel or m
T(W) distribution in the muon channel in the signal regions. In order to construct a sample of multijet background events, different methods are adopted for the electron and muon channels.
The ‘jet-lepton’ method [68] is used to model the background due to fake electrons using a dijet sample simulated with the Pythia8 event generator [32]. A jet that resembles the electron has to have E
T> 25 GeV and be located in the same η region as the signal electrons. The fraction of the electromagnetic energy of the jet has to be between 0.8 and 0.95. The event is accepted if exactly one
‘jet-lepton’ is found, and if the event passes all other selection cuts as described above, except that on E
missT
. The yield of the multijet background in the electron-triggered data sample is estimated using a binned maximum-likelihood fit to the E
missT
distribution as detailed later in this section. In order to improve the modelling of the η(`) distribution of the ‘jet-lepton’ model in SR1, the fit is done separately in the barrel region ( |η| ≤ 1 . 37) and in the end-cap region ( |η| > 1 . 52). The fits for SR2 and SR3 are performed inclusively in |η| due to the lower number of selected events.
The ‘anti-muon’ method [68] uses a dedicated selection on data to enrich a sample in events that
contain fake muons in order to build a multijet model for muon triggered events. A few of the muon
identification cuts are changed compared to signal muon candidates. The calorimeter isolation is
inverted, while keeping the total energy loss of the muon in the calorimeters below 6 GeV, and the cut
on the impact parameter is omitted. Applying additionally all other event selection cuts mentioned in Section 5 results in a sample that is highly enriched in fake muons from multijet events, but contains only a small amount of prompt muons from Z - and W -boson decays. The yield of the multijet background in the muon triggered data sample is estimated from a maximum-likelihood fit to the m
T(W) distribution.
In both methods to obtain the multijet background normalisation, the multijet template is fitted together with templates derived from MC simulation for the t¯ t and W + jets processes; their rate uncertainties, obtained from theoretical cross-section uncertainties, are accounted for in the fitting process in the form of constrained normalisation factors. The rates for Z + jets, single top-quark processes, and VV processes are fixed. For the fits in SR2 and SR3, the W + jets process is fixed as well, since the predicted yield is very small in these signal regions. The resulting fitted rate of t t ¯ events is in agreement within the statistical uncertainty with the result of the final estimation of the t¯ t cross-section and therefore does not bias the result. Distributions of the fitted observable, normalised to the fit results, are shown in Fig. 2.
The Matrix Method [68] is used as an alternative method to evaluate systematic uncertainties in the multijet background estimate. It provides template distributions and estimates of the number of multijet events in SR1 . Differences between the two methods are taken into account as systematic uncertainties yielding a normalisation uncertainty of 67 %. Due to the lack of statistics for the Matrix Method in SR2 and SR3 an uncertainty of 50 % is assigned, based on comparisons of the rates obtained using alternative methods described in previous analyses [68].
The resulting fractions of the multijet background for E
missT
> 25 GeV and m
T(W) > 30 GeV are 4 . 5 % ± 3 . 0 % in SR1, 2 . 5 % ± 1 . 3 % in SR2 and 1 . 5 % ± 0 . 8 % in SR3. All other processes, namely t t ¯ and single-top-quark production, Z + jets and VV production, are modelled using simulation samples as described in Sect. 3.
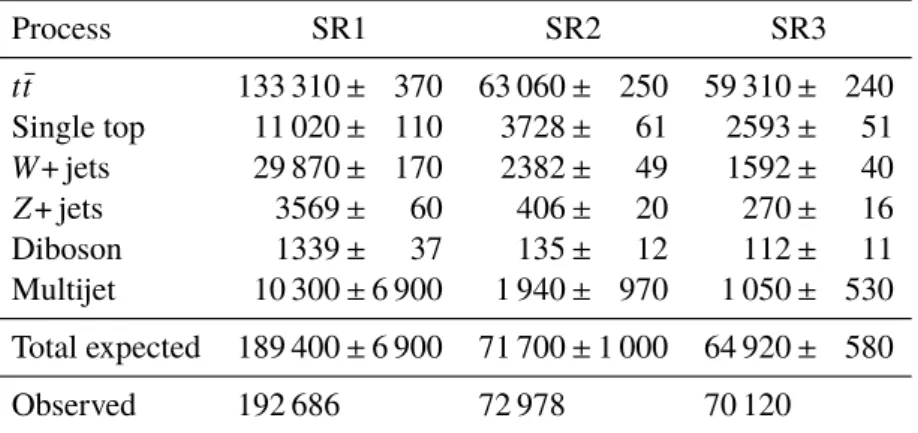
Table 1 summarises the event yields in the three signal regions for the t t ¯ signal process and each of the background processes. The yields, apart from the multijet background, are calculated using the acceptance from MC samples normalised to their respective theoretical cross-sections as discussed in Sect. 3.
Table 1: Event yield for the three signal regions. The multijet background is estimated from themT(W)orEmiss
T
fit to data and the uncertainty is calculated as explained in the Section6. All the other expectations are derived using theoretical cross-sections, and the corresponding uncertainties arise from Monte Carlo statistics only.
Process SR1 SR2 SR3
t¯ t 133 310 ± 370 63 060 ± 250 59 310 ± 240 Single top 11 020 ± 110 3728 ± 61 2593 ± 51
W + jets 29 870 ± 170 2382 ± 49 1592 ± 40
Z + jets 3569 ± 60 406 ± 20 270 ± 16
Diboson 1339 ± 37 135 ± 12 112 ± 11
Multijet 10 300 ± 6 900 1 940 ± 970 1 050 ± 530 Total expected 189 400 ± 6 900 71 700 ± 1 000 64 920 ± 580
Observed 192 686 72 978 70 120
[GeV]
miss
ET
Events / 5 GeV
0 2000 4000 6000
[GeV]
miss
ET
0 50 100 150 200
Pred.Data 0.81 1.2
|<1.5 η
|
4 jets 1 tag, electrons
≥ Preliminary
ATLAS s=8 TeV, 20.2 fb-1 Data
t t Single top W+Jets Z+Jets Diboson Multijet MC stat. + syst.
(a)
(W) [GeV]
mT
Events / 5 GeV
0 5000 10000
(W) [GeV]
mT
0 50 100 150 200
Pred.Data 0.81 1.2
4 jets 1 tag, muons
≥
Preliminary
ATLAS s=8 TeV, 20.2 fb-1 Data
t t Single top W+Jets Z+Jets Diboson Multijet MC stat. + syst.
(b)
[GeV]
miss
ET
Events / 5 GeV
0 1000 2000 3000
[GeV]
miss
ET
0 50 100 150 200
Pred.Data 0.81 1.2
4 jets 2 tag, electrons Preliminary
ATLAS s=8 TeV, 20.2 fb-1 Data
t t Single top W+Jets Z+Jets Diboson Multijet MC stat. + syst.
(c)
(W) [GeV]
mT
Events / 5 GeV
0 1000 2000 3000 4000
(W) [GeV]
mT
0 50 100 150 200
Pred.Data 0.81 1.2
4 jets 2 tag, muons Preliminary
ATLAS s=8 TeV, 20.2 fb-1 Data
t t Single top W+Jets Z+Jets Diboson Multijet MC stat. + syst.
(d)
[GeV]
miss
ET
Events / 5 GeV
0 1000 2000
[GeV]
miss
ET
0 50 100 150 200
Pred.Data 0.81 1.2
2 tag, electrons
≥ 4 jets
≥ Preliminary
ATLAS s=8 TeV, 20.2 fb-1 Data
t t Single top W+Jets Z+Jets Diboson Multijet MC stat. + syst.
(e)
(W) [GeV]
mT
Events / 5 GeV
0 1000 2000 3000 4000
(W) [GeV]
mT
0 50 100 150 200
Pred.Data 0.81 1.2
2 tag, muons
≥ 4 jets
≥ Preliminary
ATLAS s=8 TeV, 20.2 fb-1 Data
t t Single top W+Jets Z+Jets Diboson Multijet MC stat. + syst.
(f) Figure 2: Observed and simulated (left)Emiss
T distributions in the electron channel for the barrel region and (right) mT(W)distributions in the muon channel, normalised to the result of the binned maximum-likelihood fit,(a)-(b) in SR1,(c)-(d)in SR2, and(e)-(f)in SR3. The hatched error band represents the uncertainty due to the sample size and the normalisation of the multijet background. The ratio of observed to predicted (Pred.) number of events in each bin is shown in the lower histogram. Events beyond thex-axis range are included in the last bin.
Table 2: The seven input variables of the NN, ordered by their discriminating power.
Variable Definition
m
12The smallest invariant mass between jet pairs.
cos (θ
∗)
b j jAngle between the hadronic top-quark momentum and the beam direction in the t¯ t rest frame.
m(`νb) Mass of the reconstructed semileptonically decaying top quark.
A Aplanarity, as defined in Eq. 6
m(b j j) Mass of the reconstructed hadronically decaying top quark.
m
`1The smallest invariant mass between the charged lepton and a jet.
m
23The second smallest invariant mass between jet pairs.
7 Discriminating observables
In order to further separate the signal events from background events in SR1 and SR3 , the output distribution of an artificial neural network (NN) [69, 70] is used. A large number of potential NN input variables are studied for their discriminating power between W + jets and t t ¯ and the consistency of their distributions between simulated W + jets events with at least one b -tag and Z to W events with no b -tagging requirement. The observables investigated are based on invariant masses between jets and leptons, event shape observables and properties of the reconstructed top quarks.
In SR1 and SR3 , the semileptonically decaying top quark is reconstructed. First the semileptonically decaying W boson four-momentum is reconstructed from the identified charged lepton four-momentum and the E
missT
, the latter representing the transverse momentum of the neutrino. The unmeasured z - component of the neutrino momentum p
z(ν) is inferred by imposing a W -boson mass constraint on the lepton-neutrino system, leading to a two-fold ambiguity. In the case of two real solutions, the one with the lower |p
z| is chosen. In the case of complex solutions, which can occur due to the E
missT
resolution, a fit is performed that rescales the neutrino p
xand p
ysuch that the imaginary radical vanishes, at the same time keeping the transverse components of the neutrino as close as possible to the x - and y -components of E
missT
. To reconstruct the semileptonically decaying top quark, the four jets with the highest p
Tare selected and the one with the smallest ∆R to the charged lepton is chosen to be the b -jet.
The semileptonically decaying top quark is then reconstructed by adding the four-vector of the W boson and the chosen b -jet. The hadronically decaying top quark is reconstructed by adding the four-vectors of the remaining three highest- p
Tjets.
Seven observables are finally chosen as input variables to the NN (see Table 2). The NN infrastructure consists of one input node for each input variable plus one bias node, eight nodes in the hidden layer, and one output node, which gives a continuous output o
NNin the interval [0 , 1]. For the training of the NN, an equal number of simulated t t ¯ events and Z to W events is used. The discriminating power of the NN between Z to W and t¯ t events can be seen in Fig. 3 for SR1 and SR3.
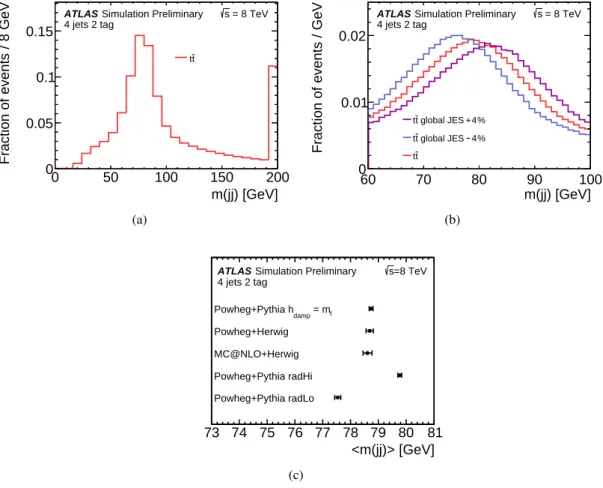
Since in SR2 the background contribution is very small, a different distribution is used as the discriminant
in the final fit. In measurements of the top quark mass, the invariant mass of the two untagged jets
m( j j) is frequently utilised to reduce the impact of the jet energy scale (JES) uncertainty [71–74]. This
approach is also followed here. The normalised distribution of m( j j) is shown in Fig. 4(a) with the
binning used in the final fit, while the dependency on the JES is shown in Fig. 4(b) using simulated
oNN
0 0.2 0.4 0.6 0.8 1
Fraction of events
0 0.05 0.1
0.15 tt
ZtoW data 4 jets 1 tag
≥ Preliminary
ATLAS s=8 TeV, 20.2 fb-1
(a)
oNN
0 0.2 0.4 0.6 0.8 1
Fraction of events
0 0.05 0.1 0.15
t t ZtoW data 2 tag
≥ 4 jets
≥ Preliminary
ATLAS s=8 TeV, 20.2 fb-1
(b)
Figure 3: Probability densities of the neural-network discriminantoNNfor the simulatedtt¯signal process and the W+ jets background process derived from data using convertedZ+ jets events(a)for SR1 and(b)for SR3.
t¯ t events with modified JES correction factors. Here the energy of the jets are scaled by a constant scaling factor of 1 . 00 ± 0 . 04. Additionally, the mean of the m( j j) distribution is sensitive to the amount of additional radiation. A comparison of the mean value of a Gaussian distribution fitted to the m( j j) distribution in the range of 60 GeV < m( j j) < 100 GeV for different generator setups is presented in Fig. 4(c). It can be seen that the mean value is consistent between different generator setups, but different for different settings of the parameters controlling the initial and final state radiation. For these reasons, the m( j j ) is used as discriminant in SR2.
Finally the ratio of single to double b -tagged events, i.e. the ratio of events in SR1 and the sum of events
in SR2 and SR3 together is sensitive to the b -tagging efficiency. A small sensitivity to heavy flavour
production in the parton shower is obtained through the inclusion of events with more than two b -tags
in SR3.
m(jj) [GeV]
0 50 100 150 200
Fraction of events / 8 GeV
0 0.05 0.1 0.15
t t 4 jets 2 tag
Simulation Preliminary
ATLAS s = 8 TeV
(a)
m(jj) [GeV]
60 70 80 90 100
Fraction of events / GeV
0 0.01 0.02
% 4 + global JES t t
% -4 global JES t t
t t 4 jets 2 tag
Simulation Preliminary
ATLAS s = 8 TeV
(b)
<m(jj)> [GeV]
73 74 75 76 77 78 79 80 81
= mt
Powheg+Pythia hdamp
Powheg+Herwig MC@NLO+Herwig Powheg+Pythia radHi Powheg+Pythia radLo
=8 TeV s Simulation Preliminary ATLAS
4 jets 2 tag
(c)
Figure 4: Probability densities for thett¯signal process of them(j j)distribution(a)as used in the analysis, where events beyond thex-axis range are included in the last bin,(b)for three different values of the JES, where events beyond thex-axis range are not shown and the range is restricted to show the peak. (c)Mean value of a fit to the m(j j)distribution using a Gaussian distribution for different signal generator setups. The uncertainties shown are statistical only.
8 Sources and evaluation of systematic uncertainties
Several sources of systematic uncertainties affect the t t ¯ cross-section measurement. In addition to the luminosity determination, they are related to the modelling of the physics objects, the modelling of t¯ t production and the understanding of the background processes. All of them affect the yields and kinematic distributions (shape of the distributions) in the three signal regions.
The uncertainties are split into the following categories:
Physics object modelling
Systematic uncertainties due to the residual differences between collision data and Monte Carlo simu- lations on jets, electron and muon reconstruction after calibration, and uncertainties in corrective scale factors are propagated through the entire analysis.
Uncertainties due to the lepton trigger, lepton reconstruction and selection efficiencies in simulation are estimated from measurements of the efficiency in data using Z → `` decays. The same processes are used to evaluate uncertainties in the lepton momentum scale and resolution and correction factors and associated uncertainties are derived to match simulated to observed distributions [57, 58, 75].
The jet energy scale JES is derived using information from test-beam data, collision data and simulation.
The uncertainty is parametrised in p
Tand η of the reconstructed jet [62, 76]. The JES uncertainty is broken down into various components originating from the calibration method, the calorimeter response, the detector simulation, and the set of parameters used in the MC event generator. Furthermore, contributions from the modelling of pile-up effects, differences between b -quark and light-quark or gluon-induced jets are included. A large source of uncertainty in the JES originates from the unknown relative fractions of quark-induced and gluon-induced jets in a generic sample, which is normally assumed to be 50 ± 50 %. Because the actual fraction of gluon-induced jets in events considered by this analysis is known, the uncertainty is reduced. The fraction of gluon-induced jets is obtained from simulated events, considering all selected jets apart from b -jets and it is between 15 % to 30 % depending on the p
Tand η of the jet. The uncertainty in this fraction is estimated by comparing different t¯ t samples, namely Powheg +Pythia, Powheg +Herwig, and MC@NLO +Herwig as well as samples with varied scale settings in the Powheg +Pythia setup. To evaluate the systematic uncertainty of the JES, a parametrisation with 25 uncorrelated components is used, as described in Ref. [76]. For the purpose of the extraction of the t t ¯ cross-section, a single correction factor for the JES is included in the fit as a nuisance parameter (see Sect. 9). In this procedure, the dependence of the acceptance and the shape of the m( j j ) template distribution on the JES is parametrised using the single JES uncertainty correction factor corresponding to the total JES uncertainty. Fig. 5 shows the the ± 1 σ deviation of the JES correction factor for the m( j j ) distribution. When estimating the systematic uncertainty in the t t ¯ cross-section due to JES in the statistical procedure all 25 components are considered and evaluated as described in Sect. 9.
Smaller uncertainties come from modelling of the jet energy resolution [77, 78] and missing transverse momentum [65] to account for contributions from calorimeter cells not matched to any jets, soft jets, and pile-up. Uncertainties from the scale and resolution corrections on leptons and jets are propagated into the calculation of the missing transverse momentum as well. The effect of uncertainties associated with the jet-vertex fraction is also considered for each jet.
Since the analysis makes use of b -tagging, the uncertainties in the b -tagging efficiencies and the c -jet
and light-jet mistag probability are taken into account [79, 80]. Similar to the JES, the correction factor
Fraction of events / 8 GeV 0 0.05 0.1
0.15 4 jets 2 tag
Simulation Preliminary
ATLAS s = 8 TeV
t t
σ 1 + global JES
σ -1 global JES MC stat. uncertainty
m(jj) [GeV]
0 50 100 150 200
rel. diff. -0.10 0.1
Figure 5: Probability density of them(j j)distribution of simulatedtt¯events in SR2 for the nominal JES and the
±1σdeviation. The hatched error band represents the statistical uncertainty of the sample. Events beyond the x-axis range are included in the last bin.
of the b -tagging efficiency is included as a nuisance parameter in the fit for the extraction of the t t ¯ cross-section. The parametrisation of the correction factor is obtained from the total uncertainty on the b -tagging efficiency.
Signal Monte Carlo modelling and parton distribution functions
Systematic effects from MC modelling are estimated by comparing different generators and varying parameters for the event generation of the signal process.
The uncertainty due to the choice of the factorisation scale, renormalisation scale, and amount of additional radiation in the parton shower is evaluated using the Powheg generator interfaced to Pythia by varying these scales and using alternative sets of tuned parameters for the parton shower as described in Section 3. Systematic effects due to the matching of the NLO matrix element calculation and the parton shower for t t ¯ is estimated by comparing MC@NLO with Powheg, both interfaced to the Herwig parton shower. An uncertainty related to the modelling of parton-shower, underlying event and hadronization effects, is estimated by comparing samples produced with Powheg +Herwig and Powheg +Pythia. More details about these sample were given in Sect. 3.
Systematic uncertainties related to the PDF sets are taken into account for the signal process. The uncertainty is calculated following the PDF4LHC recommendation [81] using the PDF4LHC15_NLO PDF set. In addition, we consider the acceptance difference between PDF4LHC15_NLO and CT10, since the latter PDF set is not covered by the uncertainty obtained with PDF4LHC15_NLO and it is used in the simulation of t t ¯ events. Finally the larger of the two uncertainties is used in the final analysis.
Finally, the statistical uncertainty of the MC samples as well as the Z to W data sample is included.
Background normalisation for non-fitted backgrounds
Uncertainties in the normalisation of the non-fitted backgrounds, i.e single top-quark production, VV ,
and Z + jets, are estimated using the uncertainties in the theoretical cross-section predictions. In the
case of Z + jets, an uncertainty of 24 % per additional jet is added to the uncertainty of the inclusive
cross-section. The uncertainty in the multijet background is obtained in SR1 from the comparison
between the fitting method and the matrix method as detailed in Section 6. For the other two regions, an uncertainty of 50 % is used.
Background modelling
Uncertainties in the shape of the W + jets and multijet backgrounds are taken into account for the discriminating observables used in the analysis. For the W + jets background, shape uncertainties are extracted from the differences between Z -boson and W -boson production. Although their production modes are very similar, differences exist in the details of the production and decay. There are differences in heavy-flavour production and in the different helicity structures of the decay vertices. Shape variations are built from a comparison of the NN discriminant and the m( j j ) distribution between simulated W + jets events, described in detail in Section 3, and Z to W events derived from a simulated Z + jets sample. The uncertainty in the multijet background kinematics is determined from the differences between the predictions from the ‘jet-lepton’ or ‘anti-muon’ method and the matrix method in SR1.
Luminosity The absolute luminosity scale is derived from beam-separation scans performed in November 2012. The uncertainty in the integrated luminosity is 1.9 % [82].
Beam energy The beam energy of the LHC was determined at 4 TeV based on the LHC magnetic model together with measurements of the revolution frequency difference of proton and lead-ion beams with an uncertainty of 0.1 % [83]. The impact of the uncertainty of the beam energy on the measured cross section is negligible.
9 Extraction of the t t ¯ cross-section
To extract the t¯ t cross-section, a binned maximum-likelihood fit is performed in the three signal regions defined in Sect. 5. For SR1 and SR3 the distribution used in the fit is the NN discriminant, while the invariant-mass distribution m( j j) of the two untagged jets is used in SR2. Electron and muon triggered events are combined in these templates.
Scale factors for the signal β
t¯t, for the W + jets background, β
Wj, and two nuisance parameters δ
i, namely the b -tagging efficiency correction factor δ
b−tagand the JES correction factor δ
JES, are fitted in all three signal regions simultaneously. The δ
iare defined such, that 0 corresponds to the nominal value and ± 1 . 0 to a deviation of ± 1 σ of the corresponding systematic uncertainty.
In order to account for differences in the flavour composition of the W + jets background, two uncorrelated scale factors are used: one in SR1 ( β
W1) and one in the two other signal regions ( β
W2,3). The event yields of the other backgrounds are not allowed to vary in the fit, but instead are fixed to their predictions. The likelihood function is given by the product of the Poisson likelihoods in the individual bins M of the histograms. A Gaussian prior is incorporated into the likelihood function to constrain δ
b−tagwithin the associated uncertainty:
L( β
tt¯, β
W1, β
W2,3, δ
b−tag, δ
JES) =
M
Ö
k=1
e
−µk· µ
nkkn
k!
· G(δ
b−tag; 0 , 1 ) (7)
with
µ
k= β
s· ν ˜
s· α
sk+ Õ
2j=1
β
Wj· ν ˜
Wj· α
kWj+ Õ
4b=1
ν ˜
b· α
kb,
β
s= β
tt¯( 1 + Õ
2i=1
|δ
i| · (H(δ
i) ·
i++ H(−δ
i) ·
i−) )
,
α
ks= α
kt¯tÕ
2i=1
|δ
i| ·
(α
ki+− α
k) · H(δ
i) + (α
ki−− α
k) · H(−δ
i) .
(8)
The number of expected events µ
kin bin k is the sum of the expected number of events for the signal and the background processes. These are given by the product of the predicted events ˜ ν
pof each process and the fraction of events α
kpin bin k of the normalised distribution. Here p denotes the signal s and background processes W
j, b , where b represents the background processes which are not varied in the fit. The number of observed events in bin k is denoted by n
k. For t¯ t signal, the scale factor β
scontains the acceptance uncertainties for positive
i+and negative
i−variations of the two profiled systematic uncertainties, multiplied by their nuisance parameter δ
i. H denotes the Heaviside function. The signal template shape for each profiled systematic variation are calculated by interpolating in each bin k between the standard template α
kand the systematically altered histograms α
ki±using the systematic nuisance parameter δ
ias a weight. Linearity and closure tests are done to validate the statistical procedure.
The fit finds the minimum of the negative log-likelihood function for the parameter values shown in Table 3. The estimators for the nuisance parameters, which parametrise their optimal shift relative to the default value 0 in terms of theirs uncertainty, are found to be ˆ δ = 0.62 ± 0.09 for the b -tagging efficiency correction factor and 0.68 ± 0.07 for JES correction factor. These deviations of the b -tagging efficiency correction factor from the nominal values of the simulated sample corresponds to a shift of the acceptance in SR1 of 1 % and 2.6 % in SR2 and SR3. The deviations for the JES correction factor corresponds to a shift of the acceptance of 2.9 % in SR1 , of 1.4 % in SR2 , and of 4.4 % in SR3. The deviation of JES scale factor also accounts for differences in the modelling of additional radiation in the MC generator. Finally the fitted scale factor of the W + jets process in SR2 and SR3 yields a significantly higher value then the expected one from MC simulation, consistent with underestimating additional heavy-flavour production in the simulation.
The signal and background processes scaled and morphed to the fitted values are compared to the observed distributions of the NN discriminant distribution in SR1 and SR3 and the m( j j) distribution in SR2, shown in Fig. 6. Comparisons of the data and the fit results are shown for the three most important input variables of the NN in Fig. 7 for SR1 and for SR3.
The systematic uncertainties in the cross-section measurements are determined using pseudo experi- ments. In each of these experiments, the detector effects, background contributions and model uncer- tainties are varied within their systematic uncertainties. They impact the yields of the processes and shapes of the template distributions used to create the pseudo datasets in the the three signal channels.
Correlations between rate and shape uncertainties for a given component are taken into account. The
entire set of pseudo experiments can thereby be interpreted as a replication of the sample space of all
systematic variations given the systematically limited knowledge. By performing the measurement of
the t t ¯ cross-section an estimator of the probability density of all possible outcomes of the measurement
is obtained. The RMS of this estimator distribution is itself an estimator of the observed uncertainties.
Table 3: Result of the maximum-likelihood fit to data. Estimators of the parameters of the likelihood function, the scale factor ˆβfor thett¯and the twoW+ jets channels and the derived contributions of the various processes to the three signal regions. The quoted uncertainties are statistical only fortt¯andW+ jets and they contain for all other processes normalisation uncertainties.