ATLAS-CONF-2010-035 13July2010
ATLAS NOTE
ATLAS-CONF-2010-035
June 7, 2010
Preliminary studies for the measurement of the inclusive muon spectrum in pp collisions at √ s = 7 TeV with the ATLAS detector
The ATLAS Collaboration
Abstract
We report preliminary studies for the measurement of the inclusive muon spectrum in pp collisions at √s=7 TeV with the ATLAS detector at the LHC collider. The studies have been performed in the kinematic range|η|<2.5 andpT >4 GeV. Data have been collected using a minimum bias trigger. Present results are based on an integrated luminosity of 0.6 nb−1. A comparison of data with Monte Carlo simulation is shown.
1 Introduction
Isolated high transverse momentum muons are a key signature of interesting physics processes in hadronic interactions. At low transverse momenta the muon spectrum is dominated by light hadron decays, while at intermediate momenta it is dominated by heavy flavour decays. Yield and shape of these components, whose tails are relevant for the high transverse momentum physics, have to be measured at the new en- ergy scale of √s=7 TeV reached by LHC. Moreover the inclusive muon spectrum is interesting in that it is sensitive to heavy flavor production in ppcollisions. Such a measurement can be used to optimize theoretical models and effective Monte Carlo generators in order to improve the understanding of the heavy flavour production at the LHC.
The inclusive muon yield provides also an important input to the muon trigger tuning and to the understanding of the background sources in the search for new particles with muons in the final state.
Our first results on the muon inclusive production in ppcollisions at √s=7 TeV are given in this paper.
2 The ATLAS detector and the data sample
The analysis was performed on data collected by the ATLAS detector [1] in spring 2010 at √s=7 TeV with the minimum bias trigger, requiring at least one hit in one of the two Minimum Bias Trigger Scin- tillators (MBTS) located atz=±3.56 m from the center of the ATLAS detector.
The ATLAS detector can be divided into three main parts. An inner detector up tor =1.15 m in the transverse plane, a calorimeter, and a muon spectrometer (MS), located outside the calorimeter, made of three layers of detectors. In the inner detector a solenoidal magnetic field is used while in the Muon Spectrometer a toroidal shape of the magnetic field lines has been deployed. The inner detector (ID) has three main components: the pixel detector (pixel), a SemiConductor Tracker (SCT) and a Transition Radiation Tracker (TRT), while the muon spectrometer is made of three stations composed by Monitored Drift Tubes chambers (MDT) and Resistive Plate Chambers (RPC) in the barrel, MDT and Thin Gap Chambers (TGC) in the endcaps. The MDT chambers measure the coordinate in the bending plane containing the beam axis, while the RPC and TGC chambers measure the φ coordinate and provide the muon trigger. In the very forward regions, where a higher detector granularity is needed, Cathode Strip Chambers (CSC) are used instead of the MDT chambers in the first station. The TRT system has an acceptance up to |η| < 2.1, while the pixel and SCT have an acceptance up to |η| < 2.5. A muon that crosses the whole detector is therefore confirmed by a minimum of 4 subdetectors to a maximum of 6 subdetectors. During the data analysis a large effort has been devoted to assuring good detector conditions and to monitoring the status of all the subdetectors. Experts from all subdetectors perform daily detector performance studies and carefully flag the status of the detector. This information is then used at analysis level to select events acquired in the best possible conditions.
In this analysis we consider only data taken with stable beams, fully operational subdetectors in the inner detector, in the muon spectrometer and in the minimum bias trigger system. Moreover nominal magnetic field both for the solenoid and the toroid were required. The selected data sample corresponds to an integrated luminosity of about 0.6 nb−1.
Data have been compared to non-diffractive minimum bias Monte Carlo simulation (20 M events), generated with PYTHIA 6.4 [2], fully simulated through GEANT4 [3] and fully reconstructed with the ATLAS reconstruction software. A set of optimised parameters was used, which employs the MRST LO∗[4] parton density functions and the pT-ordered parton shower, and was tuned to describe the charged particle multiplicity distribution in minimum bias events measured at 630 GeV and 1.8 TeV centre-of- mass energies [5].
3 Event selection
The offline event selection aims at rejecting non-collision muons, and in particular cosmic rays triggering the MBTS, beam-halo and beam-gas events. Collision events are selected exploiting the timing and charge information from the MBTS trigger system, requiring at least one hit on either side. We compute the times TA and TC for each side from a charge-weighted average over the MBTS module times and subtracting the time of flight of particles travelling at the speed of light from the interaction point (IP) to the MBTS system. The resolution of TA and TC is 1 ns. A cut √(T2A +TC2) < 6 ns is applied.
This selection efficiently accepts beam collision events and rejects cosmic, as well as beam halo and beam gas, events. In the present analysis we require that a muon has been reconstructed in at least two ID subdetectors and two muon stations. The fraction of events with reconstructed muons that pass the collision selection criteria is Datasel =0.9915±0.0003 in very good agreement with the Monte Carlo that predictsselMC=0.9925±0.0005.
In order to evaluate the purity of the collision selection algorithm, the rate of background from beam gas, beam halo, and cosmic events was measured using MBTS triggered events from unpaired LHC bunches crossing the interaction region without collisions. The rate of these events results to be 0.405±0.006 Hz before the collision event selection and < 4×10⁻⁵Hz after the request for collision events, corresponding to a contamination of 0.7% and<7×10⁻⁷respectively.
4 Muon identification and reconstruction
Muon identification and reconstruction algorithms are based on two approaches, granting a coverage in pseudorapidity up to 2.7 over a wide pT range: standalone reconstruction and combined reconstruction [6],[7].
Thestandalone muonreconstruction is entirely based on the tracks reconstructed in the muon spec- trometer. The muon reconstruction is initiated locally in a muon chamber asking for a track segment in the bending plane. Hits in the precision chambers are used and the segment candidates are required to point loosely to the centre of ATLAS. The hit coordinate in the non-bending plane (so-called ”second coordinate”) measured by the trigger detectors is associated to the segment when available. A minimum of two track segments in different muon stations are combined to form a muon track candidate using three-dimensional tracking in the magnetic field. The track parameters (pT, η, φof the track, the distance of the point of closest approach to the beam axis and itszcoordinate ) are obtained from the muon spec- trometer track fit and they are extrapolated to the interaction point taking into account multiple scattering and energy loss. The typical muon energy loss is 3 GeV.
Thecombined muonreconstruction associates a standalone muon spectrometer track with an inner detector track on the basis of a match χ2, defined from the difference between the two sets of track parameters weighted by their combined covariance matrix. The parameters are evaluated at the point of minimum approach to the beam axis. The combined track parameters are derived from a statistical combination of the parameters of the two tracks.
5 Acceptance and reconstruction efficiency
In the present analysis we use only combined muons, therefore an inner detector track and a muon spectrometer track are required. The acceptance is therefore limited by the inner detector acceptance.
Acceptance and reconstruction efficiency were determined from Monte Carlo taking into account only muons coming from prompt decays (see the following section). The geometrical acceptance (A) is de-
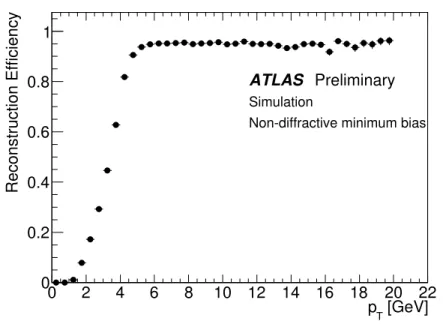
about 0.6 at low pT to a plateau of 0.8 atpT >6 GeV. The reconstruction efficiency (Rec) is defined as the fraction of muons within the acceptance of the detector that are reconstructed:
Rec(pT)= Nrecmatched(pT,|η|<2.5)
Ngen(pT,|η|<2.5) (1) where pT andηare the generated quantities of the muons,Nmatchedrec is the number of reconstructed muon tracks in a given pT bin matched to a generated muon andNgenis the number of generated muons in that bin. The reconstruction efficiencyRecis shown in Fig. 1.
[GeV]
pT
0 2 4 6 8 10 12 14 16 18 20 22
Reconstruction Efficiency
0 0.2 0.4 0.6 0.8 1
= 7 TeV s
ATLAS Preliminary
Simulation
Non-diffractive minimum bias
Figure 1: Reconstruction efficiency as a function of the muon transverse momentum.
6 Sample composition and kinematic distributions
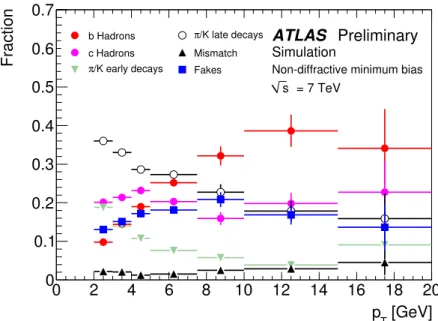
In pp collisions muons are mainly produced by weak decays of light mesons, heavy mesons, gauge bosons and by Drell-Yan processes. The first category of events comes mainly from charged πand K decays in the detector volume and from semileptonic KLdecays. Due to the relatively large decay time, the light mesons can decay far from the interaction region. Therefore the muon production rate depends strongly on the detector geometry and construction details. Muons from Drell-Yan and from decays of short-lived particles (mainly c and b hadrons), will be considered as signal and are referred to as prompt muons in the following. The ATLAS Monte Carlo simulation allows the identification of each particle that contributes to a track reconstructed in the inner detector. This allows to study the particle species that originate the track. The composition of reconstructed muons in the minimum bias Monte Carlo is shown in Fig. 2, where we distinguish among:
1. the decays ofbandcquarks, that are the main sources of prompt muons;
2. the earlyπ/Kdecays, that we define as decays in which the muon is tracked in the inner detector;
3. the lateπ/Kdecays, that occur when the muon from the decay is not tracked in the inner detector;
4. the fakes, mainly due to muons from hadronic showers into the calorimeter;
5. the mismatched muons, when a muon in the spectrometer is wrongly matched to an ID track;
6. the sail-through, that occurs when a non muon particle crosses the calorimeter and enters the muon spectrometer.
Category 6) amounts to about 0.3% of all reconstructed combined muons and is not shown in Fig. 2.
[GeV]
pT
0 2 4 6 8 10 12 14 16 18 20
Fraction
0 0.1 0.2 0.3 0.4 0.5 0.6 0.7
ATLAS Preliminary
Simulation
Non-diffractive minimum bias = 7 TeV
s b Hadrons
c Hadrons /K early decays π
/K late decays π
Mismatch Fakes
Figure 2: Monte Carlo estimated composition of the reconstructed muons as a function of pT: b and c decays, earlyπ/Kdecays and others (lateπ/Kdecays, fake muons and mismatched muons).
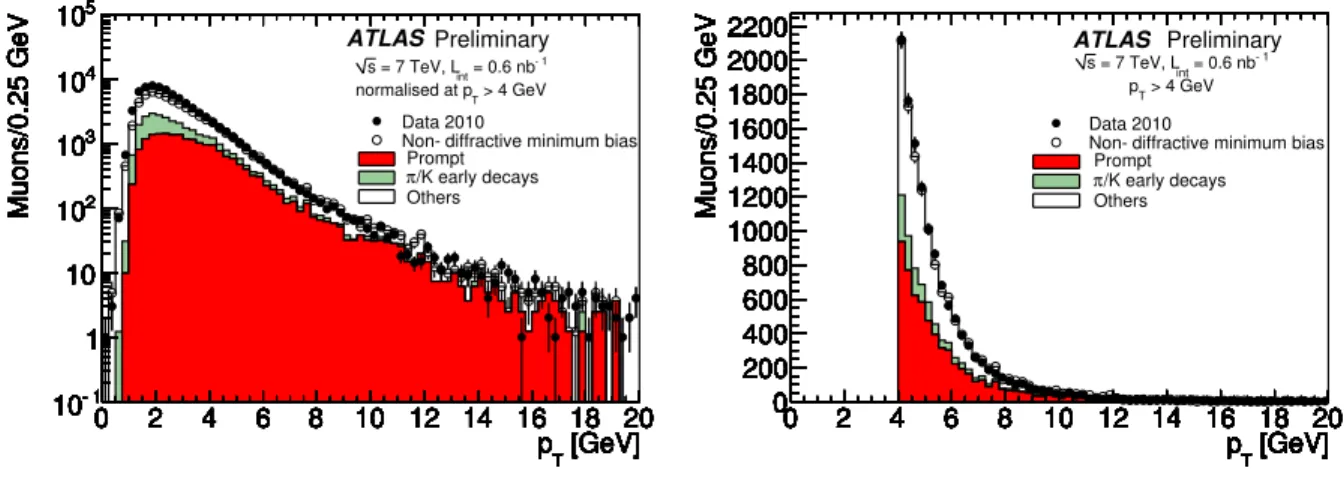
The pT region below 4 GeV is largely dominated by background. The expected signal fraction in this region is 26%, while the reconstruction efficiency is below 40%. In the region pT > 4 GeV the signal fraction becomes 46%. Therefore in the following we will focus on the study of the transverse momentum spectrum in the region above 4 GeV. In Fig. 3, the distributions of the pseudorapidityηand of the azimuthal angleφare shown forpT >4 GeV. In this figure and subsequent figures, we distinguish among reconstructed prompt muons, muons originating fromπorKdecay and reconstructed in the inner detector (π/K early decays, category 2 above), and all reconstructed muons that do not have any hit in the inner detector (others, categories 3-6). The earlyπ/K decays and the prompt contributions are flat inη, while the othersshow a more complex structure. In fact these are mostly due toK andπdecays in the calorimeters and are much more affected by the detector material budget inhomogeneity. The two distributions show a very good agreement giving confidence on the reliability of the Monte Carlo simulation in reproducing the detector acceptance and reconstruction efficiency.
In Fig. 4 the transverse momentum spectrum of the reconstructed muons is compared with the Monte Carlo prediction, the three components of the muon spectrum are shown. In order to evaluate
-3 -2 -1 0 1 2 3φ
Muons/0.32
0 200 400 600 800 1000 1200
ATLAS Preliminary
= 0.6 nb-1
= 7 TeV, Lint
s
> 4 GeV pT Data 2010
Non-diffractive minimum bias Prompt
/K early decays Othersπ
-3 -2 -1 0 1 2 3φ
Muons/0.32
0 200 400 600 800 1000 1200
-3 -2 -1 0 1 2 3φ
Muons/0.32
0 200 400 600 800 1000 1200
-3 -2 -1 0 1 2 3φ
Muons/0.32
0 200 400 600 800 1000 1200
-3 -2 -1 0 1 2 3φ
Muons/0.32
0 200 400 600 800 1000 1200
-3 -2 -1 0 1 2 3φ
Muons/0.32
0 200 400 600 800 1000 1200
-3 -2 -1 0 1 2 3φ
Muons/0.32
0 200 400 600 800 1000 1200
-3 -2 -1 0 1 2 3φ
Muons/0.32
0 200 400 600 800 1000 1200
-3 -2 -1 0 1 2 3φ
Muons/0.32
0 200 400 600 800 1000 1200
-3 -2 -1 0 1 2 3φ
Muons/0.32
0 200 400 600 800 1000 1200
-3 -2 -1 0 1 2 3φ
Muons/0.32
0 200 400 600 800 1000 1200
-3 -2 -1 0 1 2 3φ
Muons/0.32
0 200 400 600 800 1000 1200
-3 -2 -1 0 1 2 3φ
Muons/0.32
0 200 400 600 800 1000 1200
-3 -2 -1 0 1 2 3φ
Muons/0.32
0 200 400 600 800 1000 1200
-3 -2 -1 0 1 2 3φ
Muons/0.32
0 200 400 600 800 1000 1200
-3 -2 -1 0 1 2 3φ
Muons/0.32
0 200 400 600 800 1000 1200
-3 -2 -1 0 1 2 η3
Muons/0.2
0 200 400 600 800 1000 1200
ATLAS Preliminary
= 0.6 nb-1
= 7 TeV, Lint
s
> 4 GeV pT Data 2010
Non-diffractive minimum bias Prompt
/K early decays Othersπ
-3 -2 -1 0 1 2 η3
Muons/0.2
0 200 400 600 800 1000 1200
-3 -2 -1 0 1 2 η3
Muons/0.2
0 200 400 600 800 1000 1200
-3 -2 -1 0 1 2 η3
Muons/0.2
0 200 400 600 800 1000 1200
-3 -2 -1 0 1 2 η3
Muons/0.2
0 200 400 600 800 1000 1200
-3 -2 -1 0 1 2 η3
Muons/0.2
0 200 400 600 800 1000 1200
-3 -2 -1 0 1 2 η3
Muons/0.2
0 200 400 600 800 1000 1200
-3 -2 -1 0 1 2 η3
Muons/0.2
0 200 400 600 800 1000 1200
-3 -2 -1 0 1 2 η3
Muons/0.2
0 200 400 600 800 1000 1200
-3 -2 -1 0 1 2 η3
Muons/0.2
0 200 400 600 800 1000 1200
-3 -2 -1 0 1 2 η3
Muons/0.2
0 200 400 600 800 1000 1200
-3 -2 -1 0 1 2 η3
Muons/0.2
0 200 400 600 800 1000 1200
-3 -2 -1 0 1 2 η3
Muons/0.2
0 200 400 600 800 1000 1200
-3 -2 -1 0 1 2 η3
Muons/0.2
0 200 400 600 800 1000 1200
-3 -2 -1 0 1 2 η3
Muons/0.2
0 200 400 600 800 1000 1200
-3 -2 -1 0 1 2 η3
Muons/0.2
0 200 400 600 800 1000 1200
-3 -2 -1 0 1 2 η3
Muons/0.2
0 200 400 600 800 1000 1200
-3 -2 -1 0 1 2 η3
Muons/0.2
0 200 400 600 800 1000 1200
Figure 3: Muon azimuthal angle distribution (left) and pseudorapidity distribution (right) forpT>4 GeV, data and Monte Carlo are normalised to the number of events.
region pT >4 GeV in the figure on the left, while only the region pT >4 GeV is shown on the right. At pT >4 GeV, a region where the efficiency is small and rapidly varying, some discrepancy is observed.
[GeV]
pT
0 2 4 6 8 10 12 14 16 18 20
Muons/0.25 GeV
10-1
1 10 102
103
104
105
ATLAS Preliminary
= 0.6 nb-1
= 7 TeV, Lint
s
> 4 GeV normalised at pT
Data 2010
Non-diffractive minimum bias Prompt
/K early decays Othersπ
[GeV]
pT
0 2 4 6 8 10 12 14 16 18 20
Muons/0.25 GeV
10-1
1 10 102
103
104
105
[GeV]
pT
0 2 4 6 8 10 12 14 16 18 20
Muons/0.25 GeV
10-1
1 10 102
103
104
105
[GeV]
pT
0 2 4 6 8 10 12 14 16 18 20
Muons/0.25 GeV
10-1
1 10 102
103
104
105
[GeV]
pT
0 2 4 6 8 10 12 14 16 18 20
Muons/0.25 GeV
10-1
1 10 102
103
104
105
[GeV]
pT
0 2 4 6 8 10 12 14 16 18 20
Muons/0.25 GeV
10-1
1 10 102
103
104
105
[GeV]
pT
0 2 4 6 8 10 12 14 16 18 20
Muons/0.25 GeV
10-1
1 10 102
103
104
105
[GeV]
pT
0 2 4 6 8 10 12 14 16 18 20
Muons/0.25 GeV
10-1
1 10 102
103
104
105
[GeV]
pT
0 2 4 6 8 10 12 14 16 18 20
Muons/0.25 GeV
10-1
1 10 102
103
104
105
[GeV]
pT
0 2 4 6 8 10 12 14 16 18 20
Muons/0.25 GeV
10-1
1 10 102
103
104
105
[GeV]
pT
0 2 4 6 8 10 12 14 16 18 20
Muons/0.25 GeV
10-1
1 10 102
103
104
105
[GeV]
pT
0 2 4 6 8 10 12 14 16 18 20
Muons/0.25 GeV
10-1
1 10 102
103
104
105
[GeV]
pT
0 2 4 6 8 10 12 14 16 18 20
Muons/0.25 GeV
10-1
1 10 102
103
104
105
[GeV]
pT
0 2 4 6 8 10 12 14 16 18 20
Muons/0.25 GeV
10-1
1 10 102
103
104
105
[GeV]
pT
0 2 4 6 8 10 12 14 16 18 20
Muons/0.25 GeV
10-1
1 10 102
103
104
105
[GeV]
pT
0 2 4 6 8 10 12 14 16 18 20
Muons/0.25 GeV
10-1
1 10 102
103
104
105
[GeV]
pT
0 2 4 6 8 10 12 14 16 18 20
Muons/0.25 GeV
10-1
1 10 102
103
104
105
[GeV]
pT
0 2 4 6 8 10 12 14 16 18 20
Muons/0.25 GeV
10-1
1 10 102
103
104
105
[GeV]
pT
0 2 4 6 8 10 12 14 16 18 20
Muons/0.25 GeV
10-1
1 10 102
103
104
105
[GeV]
pT
0 2 4 6 8 10 12 14 16 18 20
Muons/0.25 GeV
10-1
1 10 102
103
104
105
[GeV]
pT
0 2 4 6 8 10 12 14 16 18 20
Muons/0.25 GeV
10-1
1 10 102
103
104
105
[GeV]
pT
0 2 4 6 8 10 12 14 16 18 20
Muons/0.25 GeV
0 200400 600800 10001200 14001600 18002000
2200 ATLAS Preliminary
= 0.6 nb-1
= 7 TeV, Lint
s
> 4 GeV pT
Data 2010
Non-diffractive minimum bias Prompt
/K early decays Othersπ
[GeV]
pT
0 2 4 6 8 10 12 14 16 18 20
Muons/0.25 GeV
0 200400 600800 10001200 14001600 18002000 2200
[GeV]
pT
0 2 4 6 8 10 12 14 16 18 20
Muons/0.25 GeV
0 200400 600800 10001200 14001600 18002000 2200
[GeV]
pT
0 2 4 6 8 10 12 14 16 18 20
Muons/0.25 GeV
0 200400 600800 10001200 14001600 18002000 2200
[GeV]
pT
0 2 4 6 8 10 12 14 16 18 20
Muons/0.25 GeV
0 200400 600800 10001200 14001600 18002000 2200
[GeV]
pT
0 2 4 6 8 10 12 14 16 18 20
Muons/0.25 GeV
0 200400 600800 10001200 14001600 18002000 2200
[GeV]
pT
0 2 4 6 8 10 12 14 16 18 20
Muons/0.25 GeV
0 200400 600800 10001200 14001600 18002000 2200
[GeV]
pT
0 2 4 6 8 10 12 14 16 18 20
Muons/0.25 GeV
0 200400 600800 10001200 14001600 18002000 2200
[GeV]
pT
0 2 4 6 8 10 12 14 16 18 20
Muons/0.25 GeV
0 200400 600800 10001200 14001600 18002000 2200
[GeV]
pT
0 2 4 6 8 10 12 14 16 18 20
Muons/0.25 GeV
0 200400 600800 10001200 14001600 18002000 2200
[GeV]
pT
0 2 4 6 8 10 12 14 16 18 20
Muons/0.25 GeV
0 200400 600800 10001200 14001600 18002000 2200
[GeV]
pT
0 2 4 6 8 10 12 14 16 18 20
Muons/0.25 GeV
0 200400 600800 10001200 14001600 18002000 2200
[GeV]
pT
0 2 4 6 8 10 12 14 16 18 20
Muons/0.25 GeV
0 200400 600800 10001200 14001600 18002000 2200
[GeV]
pT
0 2 4 6 8 10 12 14 16 18 20
Muons/0.25 GeV
0 200400 600800 10001200 14001600 18002000 2200
[GeV]
pT
0 2 4 6 8 10 12 14 16 18 20
Muons/0.25 GeV
0 200400 600800 10001200 14001600 18002000 2200
[GeV]
pT
0 2 4 6 8 10 12 14 16 18 20
Muons/0.25 GeV
0 200400 600800 10001200 14001600 18002000 2200
[GeV]
pT
0 2 4 6 8 10 12 14 16 18 20
Muons/0.25 GeV
0 200400 600800 10001200 14001600 18002000 2200
[GeV]
pT
0 2 4 6 8 10 12 14 16 18 20
Muons/0.25 GeV
0 200400 600800 10001200 14001600 18002000 2200
[GeV]
pT
0 2 4 6 8 10 12 14 16 18 20
Muons/0.25 GeV
0 200400 600800 10001200 14001600 18002000 2200
[GeV]
pT
0 2 4 6 8 10 12 14 16 18 20
Muons/0.25 GeV
0 200400 600800 10001200 14001600 18002000 2200
[GeV]
pT
0 2 4 6 8 10 12 14 16 18 20
Muons/0.25 GeV
0 200400 600800 10001200 14001600 18002000 2200
[GeV]
pT
0 2 4 6 8 10 12 14 16 18 20
Muons/0.25 GeV
0 200400 600800 10001200 14001600 18002000 2200
[GeV]
pT
0 2 4 6 8 10 12 14 16 18 20
Muons/0.25 GeV
0 200400 600800 10001200 14001600 18002000 2200
[GeV]
pT
0 2 4 6 8 10 12 14 16 18 20
Muons/0.25 GeV
0 200400 600800 10001200 14001600 18002000 2200
[GeV]
pT
0 2 4 6 8 10 12 14 16 18 20
Muons/0.25 GeV
0 200400 600800 10001200 14001600 18002000 2200
[GeV]
pT
0 2 4 6 8 10 12 14 16 18 20
Muons/0.25 GeV
0 200400 600800 10001200 14001600 18002000 2200
[GeV]
pT
0 2 4 6 8 10 12 14 16 18 20
Muons/0.25 GeV
0 200400 600800 10001200 14001600 18002000 2200
[GeV]
pT
0 2 4 6 8 10 12 14 16 18 20
Muons/0.25 GeV
0 200400 600800 10001200 14001600 18002000 2200
Figure 4: Muon transverse momentum distribution, (left) data and Monte Carlo are normalised in the range pT >4 GeV, (right) same distribution in linear scale shown in the regionpT >4 GeV.
7 Background reduction
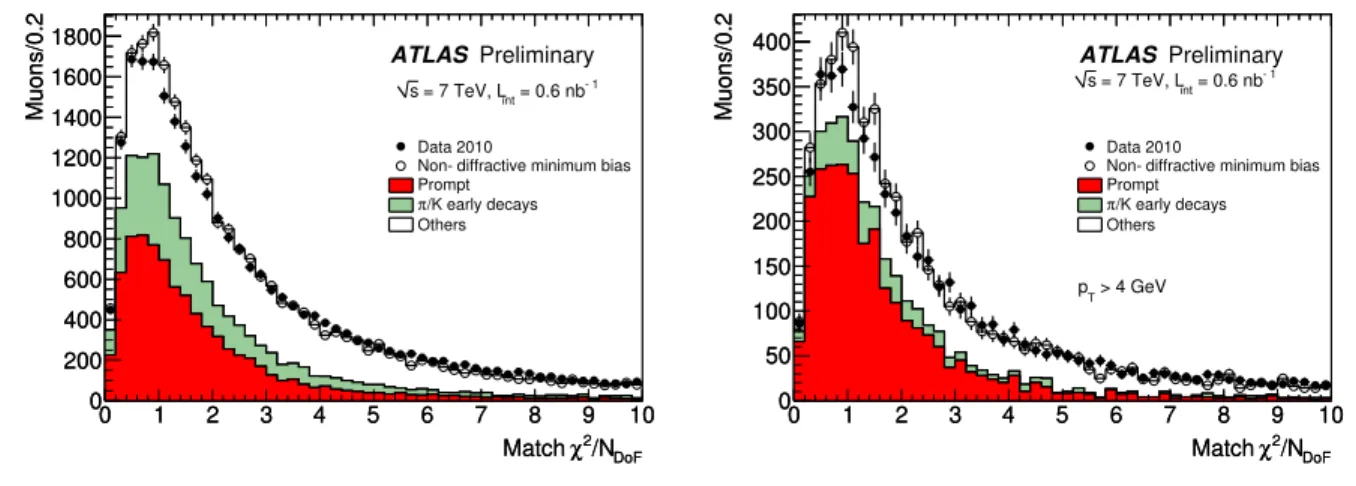
In order to reduce the background, we are studying several reconstruction and kinematic variables. One of them is theχ2of the statistical match between the muon spectrometer and the inner detector track. In the case of a decay in flight of aπorK, the inner detector track parameters are mainly determined by the πandK particle while the muon spectrometer will measure the parameters of the muon from the decay.
Therefore an imbalance in both particle momentum and angles is observed that increases the value of the matchingχ2of the combination.
Theχ2is computed by fitting the ten tracking parameters, 5 for the ID track and 5 for the MS track, with the 5 combined track parameters. The number of degrees of freedom is therefore five. The distri- bution ofχ2Match/NDoF is shown in Fig. 5 in the whole pT range and for pT > 4 GeV. The Monte Carlo
nicely reproduces the shape of the distribution and predicts that the tail is dominated by the background.
Selecting onχ2Match/NDoF allows us to enrich the prompt component of the sample. For example a cut at χ2Match/NDoF <3 has an efficiency of 82% and reduces the background fraction from 70% to 55% in the Monte Carlo simulation.
In case we restrict our analysis to the regionpT >4 GeV the expected selection efficiency is 83% and the background contamination reduces from 54% to 39%.
/NDoF
χ2
Match
0 1 2 3 4 5 6 7 8 9 10
Muons/0.2
0 200 400 600 800 1000 1200 1400 1600 1800
/NDoF
χ2
Match
0 1 2 3 4 5 6 7 8 9 10
Muons/0.2
0 200 400 600 800 1000 1200 1400 1600 1800
= 0.6 nb-1
= 7 TeV, Lint
s
ATLAS Preliminary
Data 2010
Non-diffractive minimum bias Prompt
/K early decays πOthers
/NDoF
χ2
Match
0 1 2 3 4 5 6 7 8 9 10
Muons/0.2
0 50 100 150 200 250 300 350 400
/NDoF
χ2
Match
0 1 2 3 4 5 6 7 8 9 10
Muons/0.2
0 50 100 150 200 250 300 350 400
= 0.6 nb-1
= 7 TeV, Lint
s
> 4 GeV pT
ATLAS Preliminary
Data 2010
Non-diffractive minimum bias Prompt
/K early decays πOthers
Figure 5: χ2Match/NDoF distribution for data and Monte Carlo, (left) without pT cut, (right) requiring pT >4 GeV.
8 Conclusions
Preliminary studies for the measurement of the muon inclusive spectrum with the ATLAS detector have been described together with the analysis techniques being developed for background reduction. The expected spectrum composition has been shown as a function of pT up to 20 GeV. The preliminary results show a good agreement between data and the Monte Carlo simulation in describing the main kinematic distribution of the muons.
References
[1] ATLAS Collaboration, G. Aad et al.,The Atlas Experiment at the CERN Large Hadron Collider, JINST3(2008) S08003.
[2] T. Sjostrand, S. Mrenna, and P. Z. Skands,PYTHIA 6.4 Physics and Manual, JHEP05(2006) 026.
[3] GEANT4 Collaboration, S. Agostinelli et al.,GEANT4: A simulation toolkit, Nucl. Instrum. Meth.
A506(2003) .
[4] A. Sherstnev and R. S. Thorne,Parton Distributions for LO Generators, Eur. Phys. J.C55(2008) 553–575.
[5] ATLAS Collaboration, G. Aad et al.,ATLAS Monte Carlo Tunes for MC09, Tech. Rep.
ATL-PHYS-PUB002(2010) .
[6] ATLAS Collaboration, G. Aad et al.,Expected performance of the ATLAS experiment: detector, trigger and physics, arXiv:0901.0512. CERN-OPEN-2008-020 (2009) .
[7] ATLAS Collaboration, G. Aad et al.,Muon Performance in Minimum Bias pp Collision Data at
√s=7TeV with ATLAS, ATLAS-CONF36(2010) .