ATLAS-CONF-2014-062 25November2014
ATLAS NOTE
ATLAS-CONF-2014-06 2
24th November 2014
Search for direct production of charginos and neutralinos decaying via the 125 GeV Higgs boson in √
s = 8 TeV pp collisions with the ATLAS detector
The ATLAS Collaboration
Abstract
A search for the direct pair production of charginos and neutralinos pp
→χ ˜
±1χ ˜
02is presen- ted, where the chargino decays via a W boson ˜ χ
±1 →χ ˜
01(W
±→`
±ν), while the neutralino decays via the 125 GeV Higgs boson ˜ χ
02 →χ ˜
01(h
→bb/γγ/`
±νqq) to the lightest neut- ralino. The final states considered for the search have large missing transverse momentum, an isolated electron or muon, and one of the following: either two jets identified as ori- ginating from bottom quarks, or two photons, or a second electron or muon with the same electric charge. The analysis is based on 20.3 fb
−1of
√s
=8 TeV proton–proton collision data delivered by the Large Hadron Collider and recorded with the ATLAS detector. Ob- servations are consistent with the Standard Model expectations, and limits are set in the context of a simplified supersymmetric model within which, in the case where the ˜ χ
01is massless, the direct production of ˜ χ
±1and ˜ χ
02of equal mass below 250 GeV is excluded.
c
Copyright 2014 CERN for the benefit of the ATLAS Collaboration.
Reproduction of this article or parts of it is allowed as specified in the CC-BY-3.0 license.
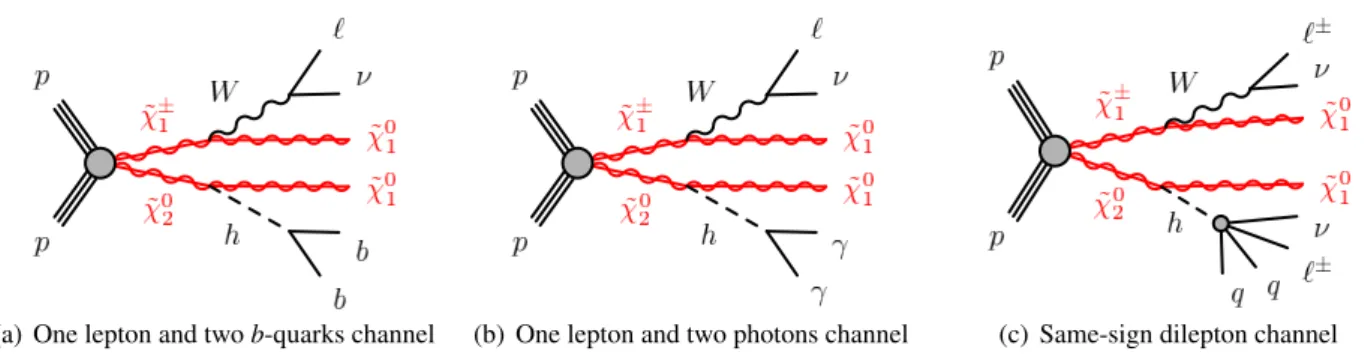
(a) One lepton and twob-quarks channel (b) One lepton and two photons channel (c) Same-sign dilepton channel
Figure 1: Diagrams for the direct production of ˜ χ
±1χ ˜
02and the three decay modes studied in this note.
For the same-sign dilepton channel (c), only the dominant decay mode is shown.
1 Introduction
Supersymmetry (SUSY) [1–9] proposes the existence of supersymmetric particles, with spin di
ffering by one half unit with respect to that of their Standard Model (SM) partners. Charginos, ˜ χ
±1,2, and neut- ralinos, ˜ χ
01,2,3,4, are the ordered mass eigenstates formed from the linear superposition of the SUSY part- ners of the Higgs and electroweak gauge bosons (higgsinos, winos and binos). In R-parity-conserving models [10–13], SUSY particles are pair-produced in colliders and the lightest SUSY particle (LSP) is stable. In many models it is assumed to be the ˜ χ
01, which is weakly interacting. Naturalness ar- guments [14, 15] suggest that the lightest of the charginos and neutralinos may have masses at the electroweak scale, and the direct production of charginos and neutralinos may be accessible at the LHC.
A simplified SUSY model [16] is considered for the optimization of the search and the interpreta- tion of results. It describes the direct production of ˜ χ
±1and ˜ χ
02, where the masses and the decay modes of the relevant particles ( ˜ χ
±1, ˜ χ
01, ˜ χ
02) are the only free parameters. It is assumed that the ˜ χ
±1and ˜ χ
02are pure wino states and degenerate in mass, while the ˜ χ
01is a pure bino state. The prompt decays χ ˜
±1 →W
±χ ˜
01and ˜ χ
02 →h χ ˜
01are assumed to have 100% branching fractions. The Higgs boson mass is set to the measured 125 GeV and its branching ratios are assumed to be the same as in the SM. The latter assumption is motivated by those SUSY models in which the mass of the pseudo-scalar Higgs boson is much larger than the Z-boson mass.
The search presented in this note targets three Higgs boson decay modes as illustrated in Fig. 1. The Higgs boson decays either into a pair of b-quarks, or a pair of photons, or a pair of W bosons where at least one of the bosons decays leptonically. The final states therefore contain missing transverse momentum from neutrinos and neutralinos, one lepton (e or µ), and one of the following: two b-quarks (`bb), or two photons (`γγ), or an additional lepton with the same electric charge (`
±`
±). The h
→ZZ and h
→ττ decays also contribute to the same-sign dilepton signature.
The analysis is based on a data sample of proton–proton collisions recorded by the ATLAS de- tector at a centre-of-mass energy of 8 TeV. Its integrated luminosity corresponds to 20.3 fb
−1. Previous searches for charginos and neutralinos have been reported by ATLAS [17–19] and CMS [20, 21]. Sim- ilar searches were conducted at the Tevatron [22, 23] and LEP [24–28].
The results of this note are combined with the ATLAS search using the three-lepton and missing
transverse momentum final state, performed with the same dataset [17]. The three-lepton signal regions
may contain up to two hadronically decaying τ leptons providing sensitivity to the h
→ττ/WW/ZZ
Higgs boson decay modes. The statistical combination of the results is facilitated by the fact that all
signal and control regions have been constructed not to overlap.
This note is organized in the following way: the ATLAS detector is described in Sec. 2, followed by a description of the Monte Carlo simulation in Sec. 3. In Sec. 4 the common aspects of the event reconstruction are illustrated; Sections 5, 6, and 7 describe the channel-specific features; Section 8 describes the systematic uncertainties; the results and conclusions follow in Secs. 9 and 10.
2 The ATLAS detector
ATLAS is a multipurpose particle physics experiment [29]. It consists of a detector with forward- backward symmetric cylindrical geometry.
1The Inner Detector (ID) covers
|η|< 2.5 and consists of a silicon pixel detector, a semiconductor microstrip detector, and a transition radiation tracker. The ID is surrounded by a thin superconducting solenoid providing a 2 T axial magnetic field. A high-granularity lead/liquid-argon (LAr) sampling calorimeter measures the energy and the position of electromagnetic showers within
|η|< 3.2. Sampling calorimeters with LAr are also used to measure hadronic showers in the end-cap (1.5 <
|η|< 3.2) and forward (3.1 <
|η|< 4.9) regions, while a steel
/scintillator tile calor- imeter measures hadronic showers in the central region (|η| < 1.7). The muon spectrometer (MS) sur- rounds the calorimeters and consists of three large superconducting air-core toroid magnets, each with eight coils, a system of precision tracking chambers (|η| < 2.7), and fast trigger chambers (|η| < 2.4). A three-level trigger system selects events to be recorded for permanent storage.
3 Monte Carlo simulation
The propagation of particles through the ATLAS detector is modelled with GEANT4 [30] using the full ATLAS detector simulation [31] for all Monte Carlo (MC) simulated samples, except for the t¯ t P
owheg+P
ythiaand the SUSY signal samples in which the Higgs boson decays to two b-quarks, for which a fast simulation based on a parametric response of the electromagnetic and hadronic calori- meters is used [32]. The effect of multiple proton–proton collisions from the same or nearby beam bunch crossings (in-time or out-of-time pile-up) is incorporated into the simulation by overlaying addi- tional minimum-bias events generated with Pythia8 [33] onto hard-scatter events. Simulated events are weighted to match the distribution of the average number of interactions per bunch crossing observed in data, but are otherwise reconstructed in the same manner as data.
The event generators, the accuracy of theoretical cross sections, the underlying event parameter tunes, and the parton distribution function (PDF) sets used for simulating the SM background processes are summarized in Table 1.
The SUSY signal samples are produced with Herwig
++[56] using the CTEQ6L1 PDF set. Sig- nal cross sections are calculated at next-to-leading order (NLO) in the strong coupling constant using P
rospino2 [57]. These agree with the NLO calculations matched to resummation at next-to-leading logarithmic (NLL) accuracy within
∼2% [58, 59]. The nominal cross section and the uncertainty are taken respectively from the centre and the spread of the cross section predictions using different PDF sets and their associated uncertainties, as well as from variations of factorisation and renormalisation scales, as described in Ref. [60].
1ATLAS uses a right-handed coordinate system with its origin at the nominal interaction point (IP) in the centre of the detector and thez-axis along the beam line. Thex-axis points from the IP to the centre of the LHC ring, and they-axis points upward. Cylindrical coordinates (r, φ) are used in the transverse plane,φbeing the azimuthal angle around thez-axis. The pseudorapidity is defined in terms of the polar angleθasη=−ln tan(θ/2).
Table 1: Simulated samples used for background estimates. “Tune” refers to the choices of parameters used for the underlying event generation.
Process Generator Cross section Tune PDF set
Single top,t-channel AcerMC [34]+Pythia[35] NNLO+NNLL [36] AUET2B [37] CTEQ6L1 [38]
Single top,s-channel Powheg[39,40]+Pythia NNLO+NNLL [41] Perugia2011C [42] CT10 [43]
tW Powheg+Pythia NNLO+NNLL [44] Perugia2011C CT10
t¯t Powheg+Pythia NNLO+NNLL [45–50] Perugia2011C CT10
t¯tW,t¯tZ MadGraph[51]+Pythia NLO AUET2B CTEQ6L1
W,Z(`bbchannel) Sherpa[52] NLO – CT10
W,Z(`±`±channel) Alpgen[53]+Pythia NLO Perugia2011C CTEQ6L1
WW,WZ,ZZ Sherpa NLO – CT10
WγWγγ Alpgen+Pythia NLO AUET2B CTEQ6L1
Zγ,Zγγ Sherpa NLO – CT10
W±W± Sherpa NLO – CT10
Wh,Zh Pythia8 [33] NNLO(QCD)+NLO(EW) [54] AU2 [55] CTEQ6L1
t¯th Pythia8 NLO(QCD) [54] AU2 CTEQ6L1
4 Event reconstruction
The data sample considered in this analysis was collected with a combination of single-lepton, dilepton, and diphoton triggers. After applying beam, detector, and data-quality requirements, the dataset corres- ponds to an integrated luminosity of 20.3 fb
−1, with an uncertainty of 2.8%. The uncertainty is derived, following the methodology detailed in Ref. [61], from a preliminary calibration of the luminosity scale from beam-separation scans performed in November 2012.
Events are analysed if the primary vertex has five or more tracks with transverse momentum p
T>
400 MeV associated with it, unless stated otherwise. For this purpose, the primary vertex of an event is identified as the vertex with the largest
Pp
2Tof associated tracks.
Electron candidates must satisfy “medium” identification criteria, following Ref. [62] (modified for 2012 data conditions), and are required to have p
T> 10 GeV and
|η|< 2.47. Electron p
Tand η are determined from the calibrated clustered energy deposits in the electromagnetic calorimeter and the matched ID track, respectively.
Muon candidates are reconstructed by combining tracks in the ID and tracks or segments in the MS [63] and are required to have p
T> 10 GeV and
|η|< 2.7. To suppress cosmic-ray muon back- ground, events are rejected if they contain a muon having transverse impact parameter with respect to the primary vertex
|d0|> 0.2 mm or longitudinal impact parameter with respect to the primary vertex
|z0|
> 1 mm.
Photon candidates are reconstructed from clusters of energy deposits in the electromagnetic calor- imeter. Clusters without matching tracks as well as those matching one or two tracks consistent with a photon conversion are considered. The shape of the cluster must match that expected for an electro- magnetic shower, using criteria tuned for robustness under the pile-up conditions of 2012 [64]. The cluster energy is calibrated, separately for converted and unconverted photon candidates, using simula- tion. In addition, η-dependent correction factors determined from Z
→e
+e
−events are applied to the cluster energy, as described in Ref. [64]. The photon candidates must have p
T> 20 GeV and
|η|< 2.37, excluding the gap of 1.37 <
|η|< 1.56 between the barrel and end-cap electromagnetic calorimeters.
Jets are reconstructed with the anti-k
talgorithm [65] with a radius parameter 0.4 using three-
dimensional clusters of energy in the calorimeter [66] as input. The clusters are calibrated, weight-
ing differently the energy deposits arising from the electromagnetic and hadronic components of the
showers. The final jet energy calibration corrects the calorimeter response to the particle-level jet en-
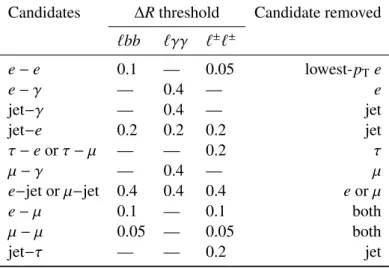
Table 2: Summary of the overlap removal procedure. Potential ambiguities are resolved by removing nearby objects in the indicated order, from top to bottom. Di
fferent
∆R separation requirements are used in the three channels. In the same-sign channel, e
+e
−and µ
+µ
−pairs with m
`+`−< 12 GeV are also removed.
Candidates
∆R threshold Candidate removed
`bb `γγ `
±`
±e
−e 0.1 — 0.05 lowest-p
Te
e
−γ — 0.4 — e
jet−γ — 0.4 — jet
jet−e 0.2 0.2 0.2 jet
τ
−e or τ
−µ — — 0.2 τ
µ
−γ — 0.4 — µ
e−jet or µ−jet 0.4 0.4 0.4 e or µ
e
−µ 0.1 — 0.1 both
µ
−µ 0.05 — 0.05 both
jet−τ — — 0.2 jet
ergy [67,68], where correction factors are obtained from simulation and then refined and validated using data. Corrections for in-time and out-of-time pile-up are also applied, as described in Ref. [69]. Events containing jets failing the quality criteria described in Ref. [67] are rejected to suppress non-collision background and events with large noise in the calorimeters.
Jets with p
T> 20 GeV are considered in the central pseudorapidity (|η| < 2.4) region, and p
T>
30 GeV in the forward (2.4 <
|η|< 4.5) region. For central jets, information from the ID makes it possible to suppress pile-up using the “jet vertex fraction” (JVF). It is defined as the p
T-weighted fraction of tracks within the jet that originate from the primary vertex of the event, and it is
−1 ifthere are no tracks within the jet. Central jets can also be tagged as originating from bottom quarks (referred to as b-jets) using the MV1 multivariate b-tagging algorithm based on quantities related to impact parameters of tracks and reconstructed secondary vertices [70]. The e
fficiency of the b-tagging algorithm depends on the operating point chosen for each channel, and it is reported in Secs. 5 and 7.
Hadronically decaying τ leptons are reconstructed as 1- or 3-prong hadronic jets within
|η|< 2.47, and are required to have p
T> 20 GeV after being calibrated to the τ energy scale [71]. Final states with hadronically decaying τ leptons are not considered here; however, they are used in the overlap removal procedure described below, as well as to make the same-sign lepton channel non-overlapping with the three-lepton search [17] that is included in the combined result.
Potential ambiguities between candidate leptons, photons and jets are resolved by removing one or both objects if they are separated by
∆R
≡ p(∆ φ)
2+(∆ η)
2below a threshold. This process eliminates duplicate objects reconstructed from a single particle, and suppresses leptons and photons contained inside hadronic jets. The thresholds and the order in which overlapping objects are removed are sum- marized in Table 2. The remaining leptons and photons are referred to as “preselected" objects.
Isolation criteria are applied to improve the quality of reconstructed objects. The criteria are based
on the scalar sum of the transverse energies E
Tof the calorimeter cell clusters within a radius
∆R of
the object (E
cone∆T R), and on the scalar sum of the p
Tof the tracks within
∆R and associated with the
primary vertex (p
coneT ∆R). The contribution due to the object itself is not included in either sum. The
detailed values of the isolation criteria depend on the channel; they are specified in Secs. 5, 6 and 7.
The missing transverse momentum, ~ p
Tmiss(with magnitude E
missT), is the negative vector sum of the transverse momenta of all preselected electrons, muons, and photons as well as jets and energy of calorimeter clusters with
|η|< 4.9 not associated with these objects. Clusters that are associated with electrons, photons and jets are calibrated to the scale of the corresponding objects; the ones that are not associated with any reconstructed object are calibrated at the hadronic scale [72, 73].
The efficiencies for electrons, muons, and photons to pass the reconstruction and identification criteria are measured in control samples, and corrections are applied to the simulated samples to re- produce the efficiencies in data. Similar corrections are also applied to the jet b-tagging efficiency and mis-identification probability.
5 One lepton and two b-jets channel
5.1 Event selection
The events considered in the one lepton and two b-jets channel are recorded with a combination of single-lepton triggers. The o
ffline event selection requires exactly one signal lepton (e or µ) with p
T> 25 GeV, to ensure that the event is triggered with a constant high e
fficiency. The signal electrons must satisfy the “tight” identification criteria of Ref. [62],
|d0|/σd0< 5, where σ
d0is the error on d
0, and
|z0sin θ| < 0.4 mm. The signal muons must satisfy
|η|< 2.4,
|d0|/σd0< 3, and
|z0sin θ| < 0.4 mm.
The signal electrons (muons) are required to satisfy the isolation criteria E
Tcone0.3/p
T< 0.18 (0.12) and p
cone0.3T/ p
T< 0.16 (0.12).
Events with two or three jets are selected, where the jets can be either central (|η| < 2.4) or forward (2.4 <
|η|< 4.9). Central jets have p
T> 25 GeV, and forward jets have p
T> 30 GeV. For central jets with p
T< 50 GeV, the JVF must be > 0.5. The two highest-p
Tcentral jets must be b-tagged.
The chosen operating point of the b-tagging algorithm identifies b-jets in simulated t¯ t events with an e
fficiency of 70%; it mis-identifies charm and light-flavour (including gluon induced) jets 20% and
< 1% of the time respectively.
The dominant background contributions in the `bb channel are t¯ t, W
+jets, and single-top Wt production. Their contributions are suppressed using the kinematic selections described below, which defines the two signal regions SR`bb-1 and SR`bb-2 summarized in Table 3.
The contransverse mass m
CT[74, 75] is defined as m
CT = q(E
bT1 +E
bT2)
2− |~p
bT1−~ p
bT2|2, (1)
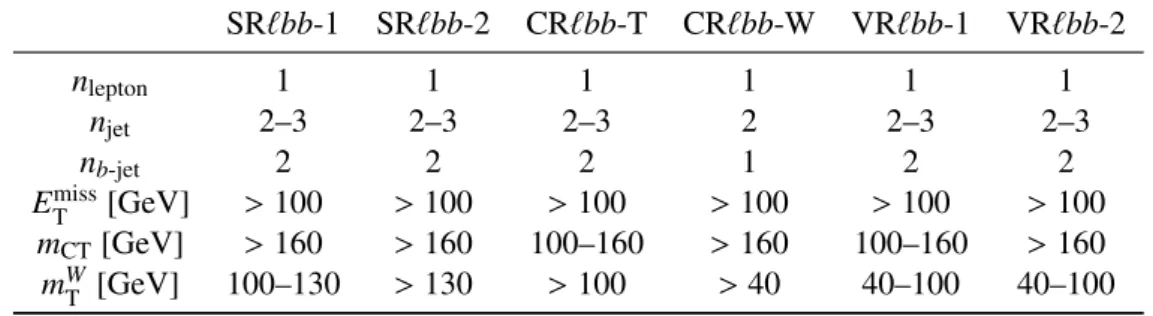
Table 3: Selection requirements for the signal, control and validation regions of the one lepton and two b-jets channel.
SR`bb-1 SR`bb-2 CR`bb-T CR`bb-W VR`bb-1 VR`bb-2
n
lepton1 1 1 1 1 1
n
jet2–3 2–3 2–3 2 2–3 2–3
n
b-jet2 2 2 1 2 2
E
Tmiss[GeV] > 100 > 100 > 100 > 100 > 100 > 100
m
CT[GeV] > 160 > 160 100–160 > 160 100–160 > 160
m
WT[GeV] 100–130 > 130 > 100 > 40 40–100 40–100
where E
bTiand ~ p
bTiare the transverse energy and momentum of the i-th b jet. The SM t¯ t background has an upper endpoint at m
CTof approximately m
t, and is efficiently suppressed by requiring m
CT>
160 GeV.
The transverse mass m
WT, describing W candidates in background events, is defined as m
WT = q2E
`TE
missT −2~ p
`T·~ p
missT, (2) where E
T`and ~ p
`Tare the transverse energy and momentum of the lepton. Requiring m
WT> 100 GeV ef- ficiently suppresses the W
+jets background. The two SRs are distinguished by 100 < m
WT< 130 GeV for SR`bb-1 and m
WT> 130 GeV for SR`bb-2. The first signal region provides sensitivity to signal models with a mass splitting between the lightest neutralinos similar to the Higgs boson mass, while the second one targets larger mass splittings.
In each SR, events are classified into five bins of the invariant mass m
bbof the two b-jets as 45–
75–105–135–165–195 GeV. In the SRs, about 70% of the signal events due to h
→b b ¯ populate the central bin of 105–135 GeV. The other four bins (sidebands) are used to constrain the background normalization, as described below.
5.2 Background estimation
The contributions from the t¯ t and W
+jets background sources are estimated from simulation, and normalized to data in dedicated control regions defined in the following paragraphs. The contribution from multi-jet production, where the signal lepton is a mis-identified jet or comes from a heavy-flavour hadron decay or photon conversion, is estimated using the “matrix method” described in Ref. [18], and is found to be less than 3% of the total background in all regions and is thus neglected. The remaining sources of background (single top, Z
+jets, WW, WZ, ZZ, Zh and Wh production) are estimated from simulation.
Two control regions (CR), CR`bb-T and CR`bb-W, are designed to constrain the normalization of the t¯ t and W
+jets backgrounds respectively. The acceptance for t¯ t events is increased in CR`bb-T by modifying the requirement on m
CTto 100 < m
CT< 160 GeV. The acceptance of W
+jets events is increased in CR`bb-W by requiring exactly two jets, of which only one is b-tagged, and m
WT> 40 GeV.
These two control regions are summarized in Table 3. The control regions are defined to be similar to the signal regions in order to reduce systematic uncertainties on the extrapolation to the signal regions;
at the same time they are dominated by the targeted background processes and the expected signal contamination is small.
As in the signal regions, the control regions are binned in m
bb(m
b jin the case of CR`bb-W). In
the “background-only" likelihood fit, a simultaneous fit is performed to the eight m
bbsideband bins
of the SRs and the ten m
bbbins of the CRs. This fit, as well as the limit setting procedure, is per-
formed using the H
istF
itterpackage described in Ref. [76]. The two free parameters of the fit, namely
the normalizations of the t¯ t and W
+jets background components, are constrained by the number of
events observed in the control regions, where the number of events is described by a Poisson probab-
ility density function. The remaining nuisance parameters correspond to the systematic uncertainties
described in Sec. 8. They are taken into account with their uncertainties, and adjusted to maximize the
likelihood. The yields estimated with the background-only fit are reported in Table 4. While CR`bb-T
is dominated by t¯ t events, CR`bb-W is populated evenly by t¯ t and W
+jets events, which causes the
normalisation of the t¯ t and W
+jets contributions to be negatively correlated after the fit. As a result,
the uncertainties on individual background sources do not add up quadratically to the uncertainty on
Events / 30 GeV
10-1
1 10 102
103 s = 8 TeV, 20.3 fb-1 ATLASPreliminary Data
Total SM t t
W+jets Single top Other ) = (250,0) GeV
1
χ0
,∼
2
χ0
∼
1
χ±
m(∼
[GeV]
mCT
100 150 200 250 300
Data / SM 0
1 2
(a)mCTin CR`bb-T, SR`bb-1 and SR`bb-2, centralmbbbin
Events / 30 GeV
10-1
1 10 102
103
104
= 8 TeV, 20.3 fb-1 s
ATLASPreliminary Data Total SM
t t
W+jets Single top Other ) = (250,0) GeV
1
χ0
,∼
2
χ0
∼
1
χ±
m(∼
[GeV]
mCT
100 150 200 250 300
Data / SM 0
1 2
(b)mCTin CR`bb-T, SR`bb-1 and SR`bb-2,mbbsidebands
Events / 15 GeV
10-1
1 10 102
103
= 8 TeV, 20.3 fb-1 s
ATLASPreliminary Data Total SM
t t
W+jets Single top Other ) = (250,0) GeV
1
χ0
,∼
2
χ0
∼
1
χ±
m(∼
[GeV]
mT
40 60 80 100 120 140 160 180
Data / SM 0
1 2
(c)mWT in VR`bb-2, SR`bb-1 and SR`bb-2, centralmbbbin
Events / 15 GeV
10-1
1 10 102
103 s = 8 TeV, 20.3 fb-1 ATLASPreliminary Data
Total SM t t
W+jets Single top Other ) = (250,0) GeV
1
χ0
,∼
2
χ0
∼
1
χ±
m(∼
[GeV]
mT
40 60 80 100 120 140 160 180
Data / SM 0
1 2
(d)mWT in VR`bb-2, SR`bb-1 and SR`bb-2,mbbsidebands
Events
1 10 102
103
104 s = 8 TeV, 20.3 fb-1
ATLASPreliminary Data Total SM
t t
W+jets Single top Other ) = (250,0) GeV
1
χ0
,∼
2
χ0
∼
1
χ±
m(∼
-jets Number of b
0 1 2
Data / SM 0.5 1 1.5
(e)nb-jetin SR`bb-1 and SR`bb-2, centralmbbbin
Events / 30 GeV
10-1
1 10 102
103
= 8 TeV, 20.3 fb-1 s
ATLASPreliminary Data Total SM
t t
W+jets Single top Other ) = (250,0) GeV
1
χ0
,∼
2
χ0
∼
1
χ±
m(∼
[GeV]
mbb
60 80 100 120 140 160 180
Data / SM 0
1 2
(f) mbbin SR`bb-1 and SR`bb-2
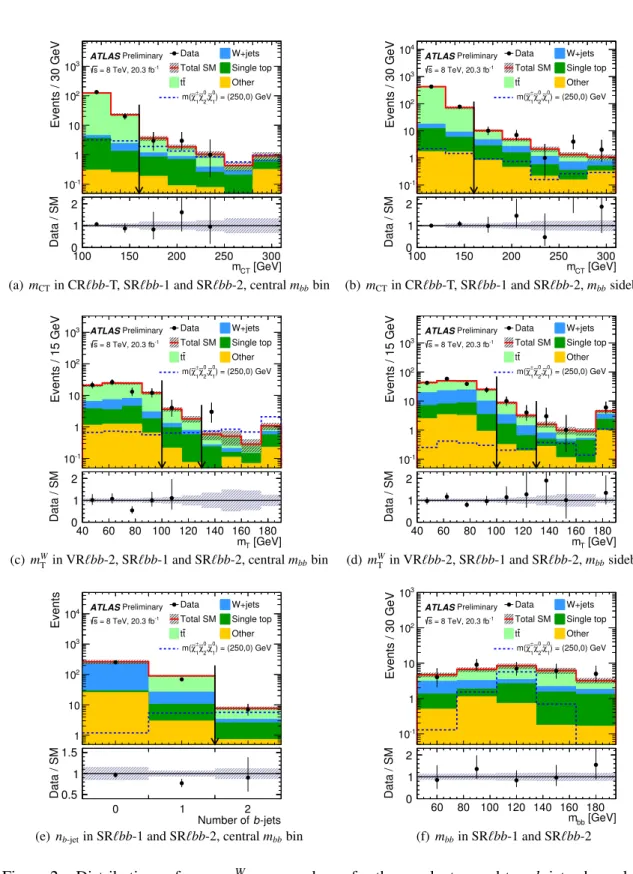
Figure 2: Distributions of m
CT, m
WT, n
b-jetand m
bbfor the one lepton and two b-jets channel in the
indicated regions. The background histograms are obtained from the background-only fit. The hatched
regions represent the total uncertainties on the background estimates. The rightmost bin in (a)–(d)
includes overflow. The distributions of a signal hypothesis are also shown. The vertical arrow indic-
ates the boundary of the signal regions. The lower panel shows the ratio between data and the SM
background prediction.
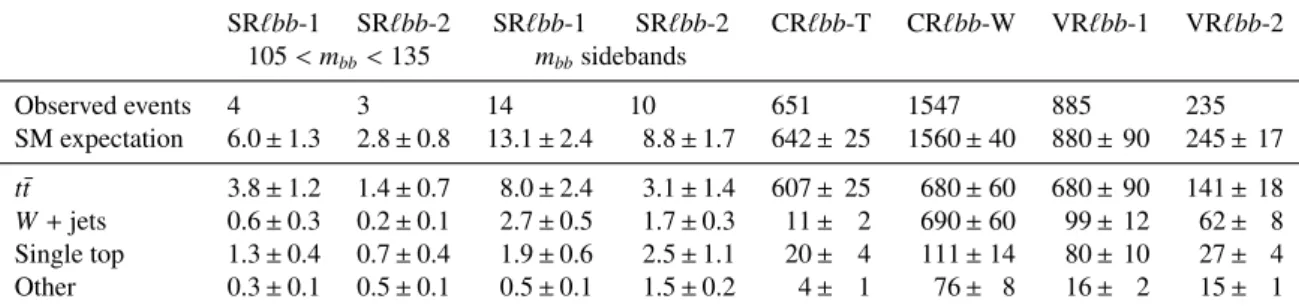
Table 4: Event yields and SM expectation in the one lepton and two b-jets channel obtained with the background-only fit. “Other” includes Z
+jets, WW , WZ, ZZ, Zh and Wh processes. The errors shown include statistical and systematic uncertainties.
SR`bb-1 SR`bb-2 SR`bb-1 SR`bb-2 CR`bb-T CR`bb-W VR`bb-1 VR`bb-2 105<mbb<135 mbbsidebands
Observed events 4 3 14 10 651 1547 885 235
SM expectation 6.0±1.3 2.8±0.8 13.1±2.4 8.8±1.7 642±25 1560±40 880±90 245±17 t¯t 3.8±1.2 1.4±0.7 8.0±2.4 3.1±1.4 607±25 680±60 680±90 141±18 W+jets 0.6±0.3 0.2±0.1 2.7±0.5 1.7±0.3 11± 2 690±60 99±12 62± 8 Single top 1.3±0.4 0.7±0.4 1.9±0.6 2.5±1.1 20± 4 111±14 80±10 27± 4
Other 0.3±0.1 0.5±0.1 0.5±0.1 1.5±0.2 4± 1 76± 8 16± 2 15± 1
the total SM expectation. The normalization factors are found to be 1.03
±0.15 for t¯ t and 0.79
±0.07 for W
+jets, where the errors include statistical and systematic uncertainties.
To validate the background modelling, two validation regions (VR) are defined similarly to the SRs except for requiring 40 < m
WT< 100 GeV, and requiring 100 < m
CT< 160 GeV for VR`bb-1 and m
CT> 160 GeV for VR`bb-2 as summarized in Table 3. The yields in the VRs are shown in Table 4 after the background-only fit, which does not use the data in the VRs to constrain the background. The data event yields are found to be consistent with background expectations. Figure 2 shows the distri- butions of m
CT, m
WT, n
b-jetand m
bbin various regions. The data agree well with the SM expectations in all distributions.
6 One lepton and two photons channel
6.1 Event Selection
Events recorded with diphoton triggers are used in the one lepton and two photons channel. The transverse energy thresholds at trigger level for the most energetic (leading) and second most energetic (sub-leading) photons are 35 GeV and 25 GeV, respectively. In addition, events recorded with the single-lepton triggers used for the lepton
+2 b-jet channel are included. The event selection requires exactly one signal lepton (e or µ) and exactly two signal photons, with p
Tthresholds of 15 GeV for electrons, 10 GeV for muons, and 40 (20) GeV for leading (sub-leading) photons. The isolation criteria for both electrons and muons are E
cone0.4T/ p
T< 0.2 and p
cone0.2T/ p
T< 0.15. Signal photons are required to satisfy E
cone0.4T< 6 GeV and p
cone0.2T< 2.6 GeV.
In this channel, a neural network algorithm, based on the momenta of the tracks associated to each vertex and the direction of flight of the photons, is used to select the primary vertex, similarly to the ATLAS SM h
→γγ analysis described in Ref. [77]. Signal muons must satisfy
|d0|< 1 mm and
|z0|
< 10 mm, with the impact parameters defined relative to the primary vertex.
The two largest background contributions are due to multi-jet and Zγ production, with leptons or jets mis-reconstructed as photons. These background contributions are suppressed by requiring E
Tmiss> 40 GeV.
The p
Tof the W
→`ν system, reconstructed assuming background events with p
νT =E
Tmiss, is
required to be back-to-back with the p
Tof the h
→γγ candidate (
∆φ(W, h) > 2.25). Only events with
a diphoton invariant mass m
γγbetween 100 and 160 GeV are considered, and all such events are used
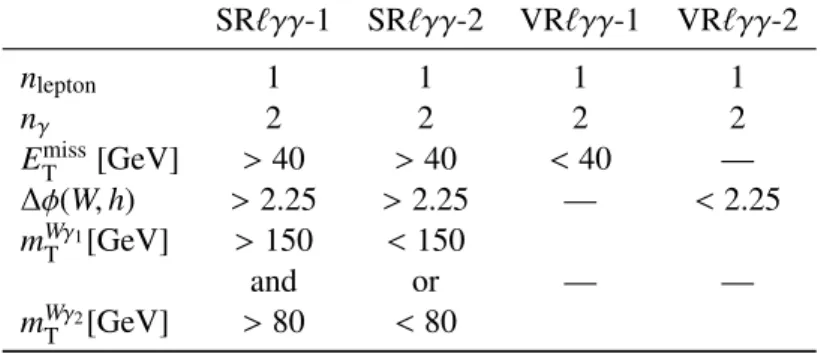
Table 5: Selection requirements for the signal and validation regions of the one lepton and two photons channel.
SR`γγ-1 SR`γγ-2 VR`γγ-1 VR`γγ-2
n
lepton1 1 1 1
n
γ2 2 2 2
E
missT[GeV] > 40 > 40 < 40 —
∆
φ(W , h) > 2.25 > 2.25 — < 2.25 m
WTγ1[GeV] > 150 < 150
and or — —
m
WTγ2[GeV] > 80 < 80
in a signal plus background fit to the data, described in Sec. 6.2. Events in the sideband, outside the Higgs-mass window between 120 and 130 GeV, are included to constrain the non-Higgs background.
Selected events are split into two SRs with di
fferent expected signal sensitivities based on two variables m
WγT 1and m
WγT 2, which are defined as
m
WTγi = q(m
WT)
2+2E
WTE
γTi −2~ p
WT ·~ p
γTi, (3) where m
WT, E
WTand ~ p
WTare the transverse mass, energy and momentum of the W candidate, and E
γTiand ~ p
γTiare the transverse energy and momentum of the i-th, p
T-ordered, photon. Including a photon in the transverse mass calculation provides a means to identify leptonically decaying W bosons in the presence of a final-state radiation photon. Events with m
WTγ1> 150 GeV and m
WγT 2> 80 GeV are classified into SR`γγ-1, and those with either m
WγT 1< 150 GeV or m
WTγ2< 80 GeV into SR`γγ-2.
SR`γγ-1 provides the most sensitivity to the signal, while SR`γγ-2 assists in constraining systematic uncertainties.
Two overlapping validation regions are defined by inverting and relaxing the E
Tmissand
∆φ(W , h) cuts relative to those of the signal regions. The first region VR`γγ-1 requires E
missT< 40 GeV and no cut on
∆φ(W , h), and the second region VR`γγ-2 requires
∆φ(W , h) < 2.25 and no cut on E
missT. The signal and validation regions are summarized in Table 5.
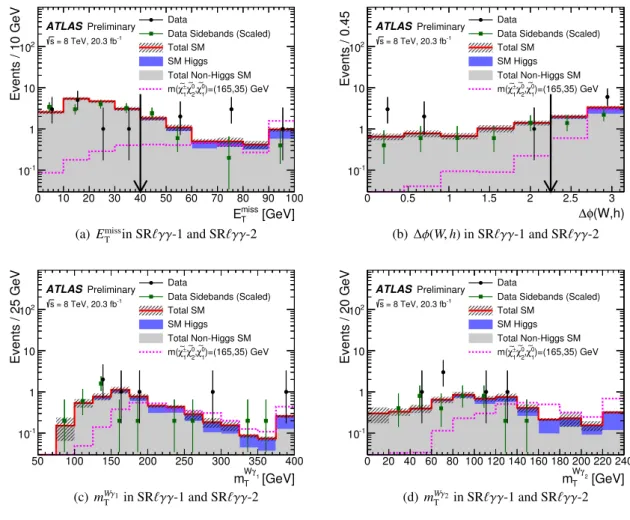
The distributions in the Higgs window of the four kinematic variables used to define the SRs are shown in Fig. 3. For illustration purposes, the observed yield in the sideband region is shown for each distribution, scaled into the Higgs window by the relative widths of the sideband and Higgs window, 10 GeV
/50 GeV
=0.2. Also shown, in each plot, is a simulation-based cross check of the background es- timate. To reduce statistical uncertainties originating from the limited number of simulated events, the non-Higgs contributions are obtained in the Higgs sideband and scaled into the Higgs window by 0.2.
The simulation-based prediction of the non-Higgs background is estimated from the W/Z(γ, γγ)+jets samples, after applying a data-driven correction for the probability of electrons or jets to be reconstruc- ted as photons. A small contribution from backgrounds with jets reconstructed as leptons is determined by using the ‘fake factor’ method [78]. This simulation-based background estimate is only used as a cross check of the data sideband background estimate described below. It shows consistent results with the data estimate, but it is not used for limit setting.
6.2 Background estimation
The contribution from background sources that do not contain a h
→γγ decay can be statistically
separated by a template fit to the m
γγdistribution. A similar approach is followed as in Ref. [77]: the
[GeV]
miss
ET
0 10 20 30 40 50 60 70 80 90 100
Events / 10 GeV
10-1
1 10 102
Data
Data Sidebands (Scaled) Total SM
SM Higgs Total Non-Higgs SM
)=(165,35) GeV
1
χ∼0 2, χ∼0 1
χ∼±
m(
ATLASPreliminary = 8 TeV, 20.3 fb-1
s
(a) ETmissin SR`γγ-1 and SR`γγ-2
(W,h) φ
∆
0 0.5 1 1.5 2 2.5 3
Events / 0.45
10-1
1 10 102
Data
Data Sidebands (Scaled) Total SM
SM Higgs Total Non-Higgs SM
)=(165,35) GeV
1
χ∼0 2, χ∼0 1
χ∼±
m(
ATLASPreliminary = 8 TeV, 20.3 fb-1
s
(b)∆φ(W,h) in SR`γγ-1 and SR`γγ-2
[GeV]
γ1
W
mT
50 100 150 200 250 300 350 400
Events / 25 GeV
10-1
1 10 102
Data
Data Sidebands (Scaled) Total SM
SM Higgs Total Non-Higgs SM
)=(165,35) GeV
1
χ∼0 2, χ∼0 1
χ∼±
m(
ATLASPreliminary = 8 TeV, 20.3 fb-1
s
(c)mWγT 1in SR`γγ-1 and SR`γγ-2
[GeV]
γ2
W
mT
0 20 40 60 80 100 120 140 160 180 200 220 240
Events / 20 GeV
10-1
1 10 102
Data
Data Sidebands (Scaled) Total SM
SM Higgs Total Non-Higgs SM
)=(165,35) GeV
1
χ∼0 2, χ∼0 1
χ∼±
m(
ATLASPreliminary = 8 TeV, 20.3 fb-1
s
(d)mWγT 2in SR`γγ-1 and SR`γγ-2
Figure 3: Distributions of E
missT,
∆φ(W , h), m
WγT 1and m
WγT 2in the one lepton and two photons signal regions for the Higgs window (120 < m
γγ< 130 GeV). The selections on E
missTand
∆φ(W , h) have been removed for these distributions; their positions are indicated by arrows. The filled and hashed regions represent the yield and total uncertainties on the simulation-based background cross check.
The contributions from non-Higgs backgrounds are scaled by 10 GeV
/50 GeV
=0.2 from the m
γγsideband (100 < m
γγ< 120 GeV and 130 < m
γγ< 160 GeV) into the Higgs window. The rightmost bin in (a), (c), and (d) includes overflow. Scaled data in the sideband are shown as squares, while events in the Higgs window are shown as circles. The distributions of a signal hypothesis are also shown.
non-Higgs background is modeled as exp(−αm
γγ), with the decay constant α as a free, positive para-
meter in the fit. Alternate functional models are used to evaluate the systematic uncertainty due to the
choice of background modelling function. The h
→γγ template, used for the Higgs background and
signal, is defined by the sum of a Crystal Ball function [79] for the core of the distribution and a Gaus-
sian function for the tails. This functional form follows the one used in the SM h
→γγ analysis [77],
with the nominal values and uncertainties of the fit parameters determined by fits to the simulation in
SR`γγ-1 and SR`γγ-2. The results of the fit to the simulation are used as an external constraint on
the template during the fit to data. The width of the Gaussian core of the Crystal Ball quantifies the
detector resolution and is determined in simulation to be approximately 3 GeV. This is comparable to
the resolution found in the SM h
→γγ analysis [77].
Table 6: Event yields and SM expectation in the Higgs window of the lepton plus two photon channel (120 < m
γγ< 130 GeV) after the background-only fit. The Higgs window is excluded from the fit in the two signal regions. The errors shown include statistical and systematic uncertainties.
SR`γγ-1 SR`γγ-2 VR`γγ-1 VR`γγ-2
Observed events 1 5 30 26
SM expectation 1.6
±0.4 3.3
±0.8 30.2
±2.3 20.4
±1.9 Non-Higgs 0.6
±0.3 3.0
±0.8 29.2
±2.3 19.8
±1.9 Wh 0.85
±0.02 0.23
±0.01 0.71
±0.02 0.29
±0.01 Zh 0.04
±0.01 0.02
±0.01 0.14
±0.02 0.05
±0.01 t¯ th 0.14
±0.01 0.02
±0.01 0.11
±0.01 0.25
±0.01
[GeV]
γ
mγ
100 110 120 130 140 150 160
Events / 2.5 GeV
0 1 2 3 4 5
6 Data
Fit to Data
ATLASPreliminary = 8 TeV, 20.3 fb-1
s
(a) SR`γγ-1
[GeV]
γ
mγ
100 110 120 130 140 150 160
Events / 2.5 GeV
0 2 4 6 8 10 12
Data Fit to Data
ATLASPreliminary = 8 TeV, 20.3 fb-1
s
(b) SR`γγ-2
[GeV]
γ
mγ
100 110 120 130 140 150 160
Events / 2.5 GeV
0 5 10 15 20 25
30 Data
Fit to Data
ATLASPreliminary = 8 TeV, 20.3 fb-1
s
(c) VR`γγ-1
[GeV]
γ
mγ
100 110 120 130 140 150 160
Events / 2.5 GeV
0 5 10 15 20 25
Data Fit to Data
ATLASPreliminary = 8 TeV, 20.3 fb-1
s
(d) VR`γγ-2
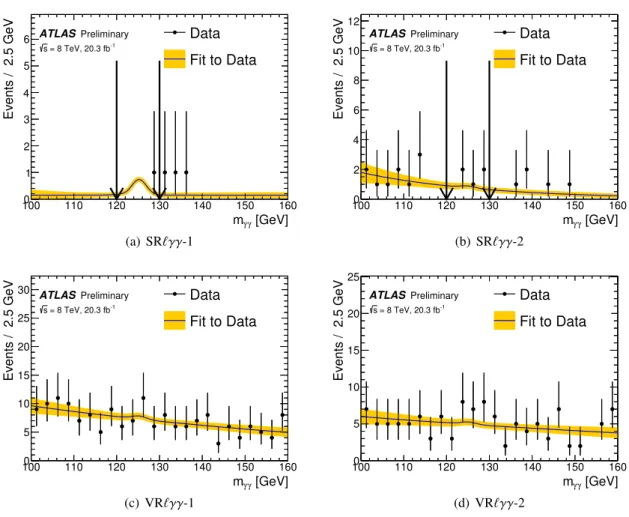
Figure 4: Results of the background-only fit to the m
γγdistribution in the one lepton and two photons
signal and validation regions. The contributions from SM Higgs boson production are constrained to
the MC prediction and associated systematic uncertainties. The band shows the systematic uncertainty
in the fit. The fit is performed on events with 100 GeV < m
γγ< 160 GeV, with events in SR`γγ-1 or
SR`γγ-2 in the Higgs window (120 GeV
≤m
γγ ≤130 GeV), indicated by the arrows, excluded from
the fit.
Contributions from SM processes with a real Higgs boson decay are estimated by simulation and come primarily from Wh associated production, followed by t¯ th and Zh. Systematic uncertainties on the signal yield of these SM processes are discussed in Sec. 8. Figure 4 shows the background-only fits to the observed m
γγdistributions in the signal and validation regions, with the signal region Higgs window (120 < m
γγ< 130 GeV) excluded from the fit. Table 6 summarizes the observed event yields in the Higgs window and the background estimates in the signal and validation regions. The errors are dominated by the statistical uncertainty due to the number of events in the m
γγsidebands.
7 Same-sign dilepton channel
7.1 Event Selection
Events recorded with a combination of dilepton triggers are used in the same-sign dilepton channel. The lowest unprescaled trigger p
Tthresholds depend on the flavour of the leptons and are at most 25 GeV and 14 GeV for the leading and sub-leading lepton, respectively. The offline event selection requires two same-sign signal leptons (ee, eµ or µµ) with p
T> 30 GeV and 20 GeV and no additional preselected lepton. The signal electrons must satisfy the “tight” identification criteria from Ref. [62],
|d0|/σd0<
3, and
|z0sin θ| < 0.4 mm. The signal muons must satisfy
|η|< 2.4,
|d0|/σd0< 3, and
|z0sin θ| <
1 mm. The isolation criteria for electrons (muons) are E
cone0.3T/min(p
T, 60 GeV)< 0.13 (0.14) and p
cone0.3T/min(p
T, 60 GeV)< 0.07 (0.06). Events containing a hadronically decaying preselected τ lepton are rejected in order to avoid statistical overlap with the three-lepton final states [17].
Events are required to contain between one and three central (|η| < 2.4) jets with p
T> 20 GeV and
|JVF|
> 0 if p
T< 50 GeV. To reduce backgrounds with heavy-flavour decays, all the jets must fail the b-tagging criteria at the 80% efficiency operating point. There must be no forward (2.4 <
|η|< 4.9) jet with p
T> 30 GeV.
The dominant background contributions in the `
±`
±channel are due to SM diboson production (WZ and ZZ) leading to two “prompt" leptons and to events with “non-prompt" leptons (heavy-flavour decays, photon conversions and mis-identified jets). These backgrounds are suppressed with the tight identification criteria described above, and with the kinematic requirements summarized in Table 7.
The requirements have been optimized separately for each lepton flavour combination (ee, µµ, and eµ), and for different numbers of reconstructed jets, leading to six signal regions.
The dilepton invariant mass m
``is required to di
ffer by at least 10 GeV from the Z-boson mass for the ee channel, in which contamination due to electron charge mis-identification is significant.
The visible mass of the Higgs boson candidate is defined for the 1-jet signal regions as the invariant mass (m
`j) of the jet and the lepton that is closest to it in terms of
∆R, and for the two-or-three-jet signal regions as the invariant mass (m
`j j) of the two highest-p
Tjets and the lepton that is closest to them as a system. In the signal regions, the cut m
`j< 90 GeV is required for SR``-1 and the cut m
`j j< 120 GeV for SR``-2.
Depending on the final state additional kinematic variables are used to further reduce the back- ground. Requiring the pseudorapidity difference between the two leptons
∆η
``< 1.5 decreases the WZ and ZZ background. Requirements on E
miss,relT, defined as
E
miss,relT =(
E
missTif
∆φ > π/2,
E
missTsin (∆ φ) if
∆φ < π/2, (4)
where
∆φ is the azimuthal angle difference between ~ p
missTand the nearest lepton or jet, reduce the Z
+jets and non-prompt lepton background in the ee channel. The E
miss,relTis defined to reduce the impact
Table 7: Selection requirements for the signal regions of the same-sign dilepton channel.
SRee-1 SRee-2 SRµµ-1 SRµµ-2 SReµ-1 SReµ-2
Lepton flavours ee ee µµ µµ eµ eµ
n
jet1 2 or 3 1 2 or 3 1 2 or 3
Leading lepton p
T[GeV] > 30 > 30 > 30 > 30 > 30 > 30 Subleading lepton p
T[GeV] > 20 > 20 > 20 > 30 > 30 > 30
|m``−
m
Z|[GeV] > 10 > 10 – – – –
∆
η
``– – < 1.5 < 1.5 < 1.5 < 1.5
E
miss,relT[GeV] > 55 > 30 – – – –
m
eff[GeV] > 200 – > 200 > 200 > 200 > 200 m
maxT[GeV] – > 110 > 110 – > 110 > 110 m
`jor m
`j j[GeV] < 90 < 120 < 90 < 120 < 90 < 120 on E
missTof any potential mis-measurement, either from jets or from leptons. The scalar sum m
effof the transverse energies of the leptons, jets and the missing transverse momentum is used to suppress the diboson background. Requiring m
maxT> 110 GeV, where m
maxTis the larger of the two m
WTvalues computed with one of the leptons and the missing transverse momentum, suppresses background events with one leptonically decaying W boson, whose transverse mass distribution has an end-point at m
W. 7.2 Background estimation
The irreducible background in the same-sign dilepton channel is dominated by WZ and ZZ diboson productions, in which both vector bosons decay leptonically and one or two leptons do not satisfy the selection requirements, mostly the kinematic ones. These contributions are estimated from the simulation.
Background contributions due to non-prompt leptons are estimated with the matrix method. It takes advantage of the di
fference between the e
fficiencies for prompt and non-prompt leptons, defined as the fractions of prompt and non-prompt preselected leptons, respectively, that pass the signal-lepton requirements. The number of events containing non-prompt leptons is obtained from these e
fficiencies and the observed number of events in each SR or VR using four categories of selection with preselected or signal leptons. The efficiencies for prompt and non-prompt leptons are derived, as a function of p
Tand η, for each process leading to either prompt or non-prompt leptons using the truth information from simulated events. They are then corrected with simulation-to-data scale factors measured in control regions, as described in Ref. [18]. The contributions from each process leading to either prompt or non-prompt leptons are then used to compute a weighted-average e
fficiency, where the weight for each process is determined as its relative contribution to the number of preselected leptons in the region of interest.
Same-sign background events where the lepton charge is mis-measured are usually due to a hard bremsstrahlung photon with subsequent asymmetric pair production. The charge mis-measurement probability, which is negligible for muons, is measured in data as a function of electron p
Tand
|η|using events from the Z
→e
+e
−sample where the two electrons are reconstructed with the same
sign. Such probability, which is below 1% for most of the p
Tand η values, is then applied to the
simulated opposite-sign ee and eµ pairs to estimate this background [80]. Although any process with
the e
±e
∓or e
±µ
∓final state can mimic the same-sign signature with charge mis-measurement, most of
this background contribution is due to the production of Z
+jets events, amounting to less than 10% of
[GeV]
meff
Events / 50 GeV
0 10 20 30 40 50 60 70
Data Total SM WW
) = (130,0) GeV 0
χ1 ,∼ 0 χ2
∼
± χ1 m(∼
WZ ZZ Other Non-prompt Preliminary ATLAS
= 8 TeV, 20.3 fb-1
s
[GeV]
meff
0 100 200 300 400 500 600 700 800 900 1000
Data / SM 00.5
1 1.5 2