ATLAS-CONF-2019-023 21June2019
ATLAS CONF Note
ATLAS-CONF-2019-023
June 21, 2019
Measurement of azimuthal anisotropy of muons from charm and bottom hadrons in √ pp collisions at
s = 13 TeV with the ATLAS detector
The ATLAS Collaboration
The elliptic flow of charm and bottom decay muons is measured in high-multiplicity pp collisions at √
s = 13 TeV with an integrated luminosity of 150 pb
−1using the ATLAS detector at the LHC. The muons from heavy flavor decay are separated from light hadron decay muons using momentum imbalance between the tracking and muon spectrometers.
The heavy flavor muons are further separated into those from charm and bottom decay by incorporating the distance-of-closest-approach to the collision vertex. The measurement is performed for muons over the transverse momentum range 4–7 GeV and pseudorapidity range
|η| < 2.4. A significant non-zero elliptic anisotropy coefficient v
2is observed for muons from charm decays, while the v
2for muons from bottom decays is consistent with zero within uncertainties.
c
2019 CERN for the benefit of the ATLAS Collaboration.
Reproduction of this article or parts of it is allowed as specified in the CC-BY-4.0 license.
In high-energy collisions between large nuclei at the Relativistic Heavy Ion Collider (RHIC) and the Large Hadron Collider (LHC), a quark-gluon plasma is formed that rapidly expands as described by nearly inviscid hydrodynamics [1, 2]. Heavy quarks, which have a large mass and dead cone radiation region [3], are expected to interact with the medium through a di ff erent interplay of radiative and collisional processes [4]. However, it was hypothesized that even these massive heavy quarks may scatter within the medium and be redirected in a way that results in collective flow patterns [5]. Measurements of decay electrons from charm and bottom hadrons by the PHENIX experiment in Au + Au collisions at
√ s
NN= 200 GeV revealed these heavy quarks undergo significant scattering in the medium and thus lose energy and align with the geometry of the expanding medium [6]. More recent measurements utilizing decay leptons and full charm and bottom hadron reconstruction indicate substantial modifications to the momentum distributions of heavy quarks in heavy-ion collisions relative to that in pp collisions at both RHIC and the LHC (see Ref. [7] for a recent review).
Smaller collision systems including p +Pb and even pp have particle emission patterns with large azimuthal anisotropies, again described by nearly inviscid hydrodynamics [1, 8]. A common hydrodynamic descrip- tion of pp, p + Pb, and Pb + Pb azimuthal anisotropies as resulting from initial geometry anisotropies is compelling [9]. New measurements of similar anisotropies for reconstructed D mesons and heavy-flavor electrons in p +Pb collisions [10, 11] highlight that charm quarks are scattered in medium in smaller colli- sion systems as well. These measurements of anisotropies with almost no modification to the transverse momentum distribution [12] are somewhat surprising, because such scattering in the A + A case leads simultaneously to azimuthal anisotropies and a softening of the transverse momentum distributions [13]. It is of interest to measure heavy flavor anisotropies in pp collisions in order to obtain information about the interaction of heavy quarks in the smallest hadronic collision system at the LHC. In this note, measurements of azimuthal momentum anisotropies for heavy-flavor decay muons are presented in pp collisions at 13 TeV. Additionally, the heavy flavor muons are separated to provide information on the anisotropies of muons from charm and bottom decay separately.
The ATLAS experiment [14] is a multi-purpose particle detector with a forward-backward symmetric cylindrical geometry and a near 4π coverage in solid angle
1. It consists of an inner tracking detector surrounded by a thin superconducting solenoid providing a 2 T axial magnetic field, electromagnetic and hadron calorimeters, and a muon spectrometer. The inner tracking detector (ID) covers the pseudorapidity range |η| < 2.5. It consists of silicon pixel, silicon microstrip (SCT), and transition radiation tracking detectors. The muon spectrometer (MS) surrounds the calorimeters and is based on three large air-core toroidal superconducting magnets with eight coils each. The muon spectrometer includes a system of precision tracking chambers and fast detectors for triggering. The trigger system in Run-2 consists of a hardware-based first level trigger (Level-1) and a software-based high level trigger (HLT) [15], which reconstructs the event in a manner similar to that performed offline.
Data for this analysis were recorded during a special running period in which the mean number of pp interactions per beam crossing was two. Events were recorded using a trigger that requires a muon at the HLT stage with transverse momentum (p
T) larger than 4 GeV, in coincidence with triggers designed to select high multiplicity events [16]. The latter included requirements on the transverse energy in the calorimeter, the number of space points in the SCT, and the number of HLT-reconstructed charged particle tracks. The trigger with the highest threshold on the number of tracks sampled the full luminosity of
1ATLAS uses a right-handed coordinate system with its origin at the nominal interaction point (IP) in the center of the detector and thez-axis along the beam pipe. Thex-axis points from the IP to the center of the LHC ring, and they-axis points upwards.
Cylindrical coordinates (r, φ) are used in the transverse plane,φbeing the azimuthal angle around thez-axis. The pseudorapidity is defined in terms of the polar angleθasη=−ln tan(θ/2). Angular distance is measured in units of∆R≡p
(∆η)2+(∆φ)2.
150 pb
−1. For each charged-hadron multiplicity range reported here, analyzed events are taken exclusively from the trigger which sampled the largest luminosity.
Charged-particle tracks and collision vertices are reconstructed in the ID using algorithms described in Ref. [17]. Tracks with p
T> 0.4 GeV and |η| < 2.5 satisfying a set of quality cuts [16] are used in this analysis. Muons with 4 < p
T< 7 GeV and |η| < 2.4 reconstructed using both the ID and MS are selected and required to pass “medium” selection cuts described in Ref. [18]. Events used in this analysis are required to have at least one but not more than four reconstructed vertices to reduce the contribution from in-time pileup events. N
chrecis defined as the number of reconstructed tracks with p
T> 0.4 GeV associated to the vertex containing the muon.
Simulated events were generated using Pythia8 [19] configured with the NNPDF23LO parton distribution function set [20] and A14 [21] tune. QCD hard scattering events filtered on the presence of a generator-level muon were passed through a G eant 4 simulation [22, 23] of the detector and reconstructed under the same conditions as the data.
This analysis follows two-particle correlation methods used in previous ATLAS measurements [16, 24] and summarized here. Two-particle correlations are measured as a function of ∆ φ ≡ φ
µ− φ
hand ∆ η ≡ η
µ− η
h, where particle µ and h are muons and charged hadrons, respectively. Correlation functions S (∆ η, ∆ φ) and B( ∆ η, ∆ φ) represent pair distributions from the same event and from “mixed events”, respectively [25].
The mixed-event distribution is constructed by selecting charged hadrons from di ff erent events of similar N
chrec(| ∆ N
chrec| < 10) and vertex position z
vtx(| ∆ z
vtx| < 10 mm). Detector acceptance effects largely cancel in the S /B ratio. Each muon-hadron pair, from either the same or mixed event, is weighted by the inverse product of the trigger and reconstruction e ffi ciencies for the muon and the reconstruction e ffi ciency for the charged hadron.
One-dimensional correlation functions C( ∆ φ) are obtained by integrating S ( ∆ η, ∆ φ) and B( ∆ η, ∆ φ) over the pseudorapidity interval (1.5 < | ∆ η| < 5):
C(∆ φ) = R
51.5
d| ∆ η|S ( | ∆ η|, ∆ φ) R
51.5
d| ∆ η|B(| ∆ η|, ∆ φ) ≡ S (∆ φ)
B( ∆ φ) , (1)
and S ( ∆ φ) and B( ∆ φ) are normalized to one such that the average value of C( ∆ φ) is unity. The ∆ η gap requirement reduces the contribution to the correlations from jet fragmentation. Previous hadron-hadron correlation results utilize a larger gap (2 < | ∆ η| < 5) [16, 24]; however, studies with the P ythia 8 sample described above indicate that the jet fragmentation correlation is narrower for heavy-flavor quarks.
In order to separate the flow contribution from that due to back-to-back dijets and resonance decays, together referred to as non-flow, a template fitting method developed for previous ATLAS analyses [16, 24] is utilized. This method assumes that the shape of non-flow correlations is independent of the event multiplicity, an assumption which has resulted in a good description of the correlation functions in these measurements and can be tested in simulation [26]. Hence the correlation function in low multiplicity (LM) events dominated by non-flow can be used to estimate the non-flow contribution in high multiplicity (HM) events. The resulting template fit function:
C
templ( ∆ φ) = FC
LM( ∆ φ) + C
ridge( ∆ φ), (2)
where
C
ridge( ∆ φ) = G
1 +
4
X
n=2
2v
n,ncos(n ∆ φ)
, (3)
has free parameters F and n-th order flow coe ffi cient v
n,n, and the coe ffi cient G is fixed by requiring that the integrals of C
templ( ∆ φ) and C( ∆ φ) are equal. The template fits include harmonics 2–4 due to a negligible contribution from higher order. Based on the assumption of flow factorization [27], the v
nof muons can be obtained as: v
µn(p
µT) = v
n,n(p
µT, p
hT)/v
hn(p
hT), where v
hn(p
hT) are the flow coe ffi cients of charged hadrons previously measured by ATLAS using the same template fit method [16, 24].
The selected muon sample includes background muons from particles produced in hadronic showers and punch-through hadrons. Previous studies [28, 29] have shown that the signal (heavy flavor) and background muons can be statistically discriminated with the fractional momentum imbalance, ∆ p/p
ID= ( p
ID− p
MS) /p
ID, where p
IDis the measured muon momentum from the ID, and p
MSis that measured in the MS and corrected via simulation for the energy loss inside the calorimeter. The signal fraction f
sigis obtained by fitting the measured ∆ p/p
IDdistribution with signal and background template distributions obtained from simulation. The signal muon sample includes remaining contributions from non-heavy- flavor components such as quarkonia, low mass resonances, and τ leptons, but these are ∼ 2.5% based on Pythia8 simulation.
−1 0 1 2 3 4
φ
∆ 0.96
0.98 1 1.02 1.04 1.06 1.08
)φ∆C( 1.1 ATLAS Preliminary
=13 TeV, 150 pb-1
s pp
<120
rec
Nch
≤ 110
<5 GeV
h
0.5<pT
<6 GeV
µ
4<pT
|<5 η
∆ 1.5<|
=0.0016
=0.85, v2,2
fsig
Data φ)+G
∆
LM( FC
φ)
∆
templ( C
LM(0) φ)+FC
∆
ridge( C
−1 0 1 2 3 4
φ
∆ 0.96
0.98 1 1.02 1.04 1.06 1.08
)φ∆C( 1.1 ATLAS Preliminary
=13 TeV, 150 pb-1
s pp
<120
rec
Nch
≤ 110
<5 GeV
h
0.5<pT
<6 GeV
µ
4<pT
|<5 η
∆ 1.5<|
=0.0030
=0.23, v2,2
fsig
Data φ)+G
∆
LM( FC
φ)
∆
templ( C
LM(0) φ)+FC
∆
ridge( C
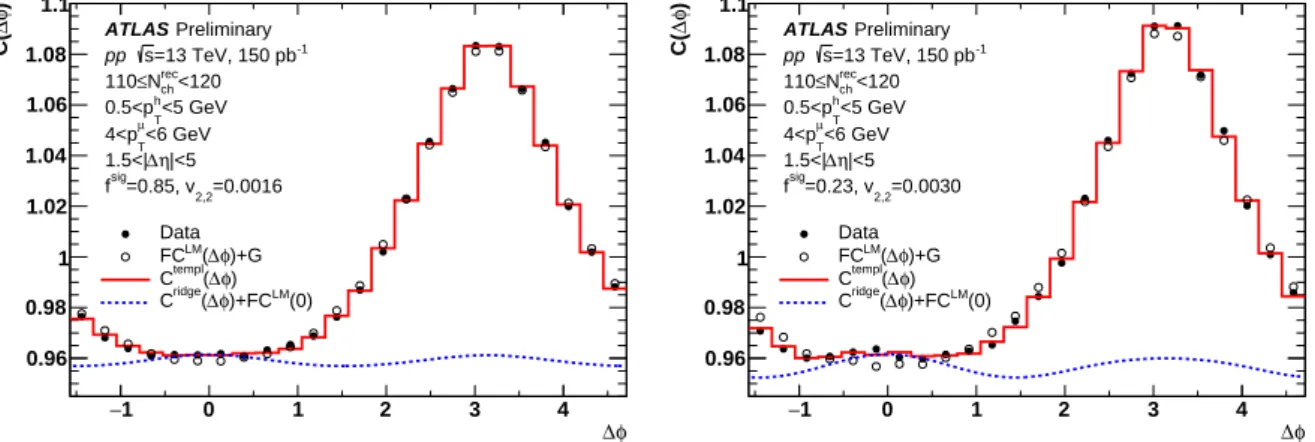
Figure 1: Template fit to the muon-hadron correlation function,C(∆φ), with 1.5<|∆η|<5 and 110≤Nrecch <120.
Muons in 4 < pT < 6 GeV and charged particles in 0.5 < pT < 5 GeV are used. Each panel represents the muon-hadron correlation function with muons of different signal fractions (fsig). The solid red lines show the final functionCtempl(∆φ), while the open points and dashed blue lines show the scaledCLM(∆φ) andvn,ncomponents, each atop a vertical pedestal for visibility.
Figure 1 shows muon-hadron correlation functions and template fits for muons with 4 < p
T< 6 GeV and charged hadrons with 0.5 < p
T< 5 GeV from 13 TeV pp events with 110 ≤ N
chrec< 120, and the N
chrec< 40 bin is used for LM events. The two panels represent di ff erent ∆ p/p
IDregions, characterized by di ff erent f
sigvalues, as indicated in the plots. The amplitude of the v
2,2modulation changes with the signal fraction.
v
2,2is determined from muon-hadron correlation functions generated using muons from three di ff erent
selections of ∆ p/ p
ID, and v
2,2as a function of f
sigis extracted from a linear fit to the points. Then v
2,2from heavy-flavor muon-hadron correlations v
sig2,2(p
µT, p
hT) is calculated by extrapolating to f
sig= 1 based
−0.5−0.4−0.3−0.2−0.1 0 0.1 0.2 0.3 0.4 0.5 [mm]
d0
103
104
105
106
Events / 0.02 mm
Preliminary ATLAS
13 TeV pp
<90
rec
Nch
≤ 80
<5 GeV 4.5<pT
|<2.4 η
| Data
Fit Charm Bottom Other signal Background
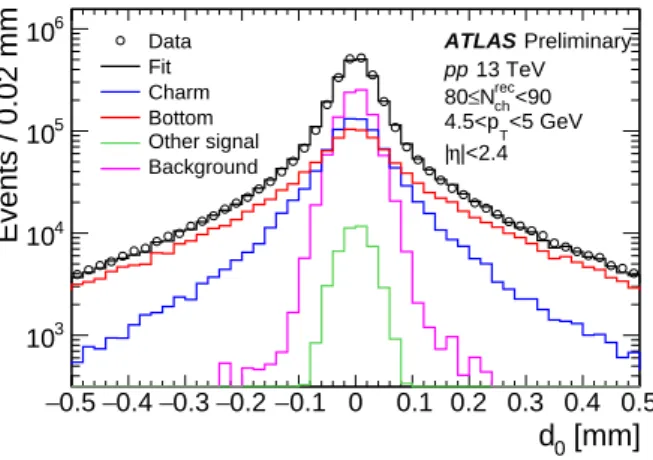
Figure 2: Fit (gray histogram) to thed0distribution of muons with 4.5<pT<5 GeV and|η|<2.4 with templated0
distributions of different components obtained from Pythia8 simulations.
on
v
2,2( p
µT, p
hT) = f
sigv
sig2,2(p
µT, p
hT) + (1 − f
sig)v
bkg2,2( p
µT, p
hT), (4) where v
bkg2,2( p
µT, p
hT) is v
2,2from background muon-hadron correlations.
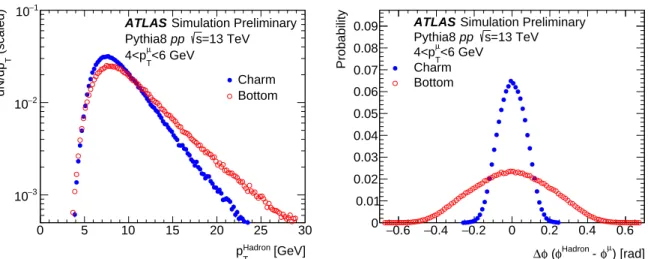
Muons from heavy-flavor decays can be further separated into muons from charm and bottom decays based on the di ff erent decay lengths between charm and bottom hadrons. Template distributions of the impact parameter of the muon relative to the associated vertex in the transverse direction (d
0) for charm, bottom, non-heavy-flavor signal, and background muons obtained from the full detector simulation are used to fit the data distributions di ff erentially in p
Tand η. The d
0resolution of charged hadrons with 4 < p
T< 7 GeV is 20–40 µm, depending on p
Tand η, and independent of N
chrec. Figure 2 shows the fit to the d
0distribution for muons with 4.5 < p
T< 5 GeV in events with 80 ≤ N
chrec< 90. The background fraction is fixed based on the fit results in ∆ p/ p
ID. The contribution from non-heavy-flavor signal muons is also fixed with the fraction obtained from Pythia8 simulation. The |d
0| < 0.02 mm region dominated by non-heavy-flavor signal and background muons is excluded in the fit procedure. The obtained fraction of muons from bottom decays to the total heavy-flavor muons, f
b→µ= (b → µ)/(c → µ + b → µ), is ∼ 0.4 at p
T= 4 GeV and increases to ∼ 0.6 at p
T= 7 GeV. These values are compatible with those determined via fixed-order plus next-to-leading logarithm calculation [30] and in the Pythia8 simulation.
In order to measure v
2,2from charm muon-hadron correlations and bottom muon-hadron correlations separately, muons are divided into two d
0regions, |d
0| < 0.12 mm and |d
0| > 0.12 mm. In the |d
0| <
0.12 mm region where f
c→µ> f
b→µ, there is a significant background contribution and thus v
sig2,2( p
µT, p
hT) has been obtained by extrapolating to f
sig= 1 with three di ff erent ∆ p/p
IDbins. In contrast, in the region
|d
0| > 0.12 mm where f
c→µ< f
b→µ, there is negligible background and thus v
sig2,2(p
µT, p
hT) is obtained directly. Given two v
sig2,2( p
µT, p
hT) values with di ff erent f
b→µ, v
c2,2(p
µT, p
hT) and v
b2,2( p
µT, p
hT) can be separately determined.
The sources of systematic uncertainty on v
sig2,2( p
µT, p
hT) originate from the LM selection, the ∆ η-gap selection,
event pileup, trigger and reconstruction e ffi ciency, and signal fraction extraction. The impact on the
v
sig2,2(p
µT, p
hT) measurement is evaluated by repeating the analysis with variations intended to test the
sensitivity to these e ff ects. In many cases, the evaluated variation in v
sig2,2( p
µT, p
hT) is driven by statistical
fluctuations. The sensitivity due to the choice of the LM range may arise due to a change in the dijet shape from the LM to HM events. The uncertainty is studied using two alternative N
chrecranges, 0–30 and 20–40, for C
LM(∆ φ), and the resulting variation in v
sig2,2( p
µT, p
hT) is 15–35% depending on N
chrecwhich is the largest systematic uncertainty. The sensitivity to the ∆ η-gap is tested by using a wider excluded range (2 < | ∆ η| < 5), and the resulting change in v
sig2,2( p
µT, p
hT) is smaller than the statistical uncertainty. The results may be sensitive to a residual in-time pileup contribution when two nearby pp events are reconstructed with a single merged vertex. This e ff ect is studied using a tighter event selection to reject events containing more than two reconstructed vertices per event. The obtained v
sig2,2( p
µT, p
hT) is consistent with the v
sig2,2( p
µT, p
hT) from the nominal event selection within the statistical uncertainties. The uncertainty associated with the signal fraction extraction is evaluated by modifying the momentum imbalance templates from simulation, and considering the systematic uncertainties on the muon momentum resolution and scale. For signal muons, the impact of using a data-driven template with muons from J/ψ → µµ candidates is also considered.
Finally, it was checked that the v
sig2,2(p
µT, p
hT) correlation is not present in the reconstructed-level P ythia 8 events.
The uncertainty in v
c2,2(p
µT, p
hT) and v
b2,2( p
µT, p
hT) additionally includes the uncertainty on f
b→µ. The extracted f
b→µvalues are sensitive to the p
Tshape of initial charm and bottom hadrons, the background muon fraction, the non-heavy-flavor muon contribution, fit range, and template d
0shapes. The non-heavy-flavor muon contribution, which is estimated to be 2.5% of the signal muon yield using simulation, is varied to 0–5% and included in the d
0fit procedure to evaluate the impact on f
b→µ. The sensitivity to the fit range is evaluated by repeating the d
0fit with di ff erent exclusion regions, either 0 or 0.04 mm. The resulting systematic uncertainty on f
b→µis 8–10%, and this uncertainty is propagated into the uncertainty on v
c2,2( p
µT, p
hT) and v
b2,2(p
µT, p
hT) by combining it in quadrature with those on v
sig2,2(p
µT, p
hT).
0 20 40 60 80 100 120
rec
Nch
−0.02 0 0.02 0.04 0.06 0.08
2v
Preliminary ATLAS
=13 TeV, 150 pb-1
s pp Template fit
|<5 η
∆ 1.5<|
Heavy-flavor muon
<6 GeV 4<pT
0 1 2 3 4 5 6 7 8
[GeV]
pT
−0.02 0 0.02 0.04 0.06 0.08
2v
Preliminary ATLAS
=13 TeV, 150 pb-1
s pp Template fit
|<5 η
∆ 1.5<|
<120
rec
Nch
≤ 60
Heavy-flavor muon
Figure 3: v2of inclusive heavy-flavor muons as a function of multiplicity for muons in 4<pT <6 GeV (left) and as a function ofpTfor the 60≤Nchrec <120 multiplicity range in the 13 TeVppdata. The vertical bars and shaded bands represent statistical and systematic uncertainties, respectively.
Figure 3 shows the v
2of inclusive heavy-flavor muons, determined from the measured v
sig2,2( p
µT, p
hT) and the v
2for charged hadrons in 0.5 < p
T< 5 GeV taken from Ref. [16]. The systematic uncertainty of the charged hadron v
2is included in the total uncertainty, but is negligible compared to the other uncertainties introduced in this measurement. It is presented as a function of N
chrecfor 4 < p
T< 6 GeV (left) and as a function of p
Tfor 60 ≤ N
chrec< 120 (right). Within the uncertainties there is no clear N
chrecdependence, but have a decreasing dependence on heavy-flavor muon p
Tfrom 4 to 7 GeV.
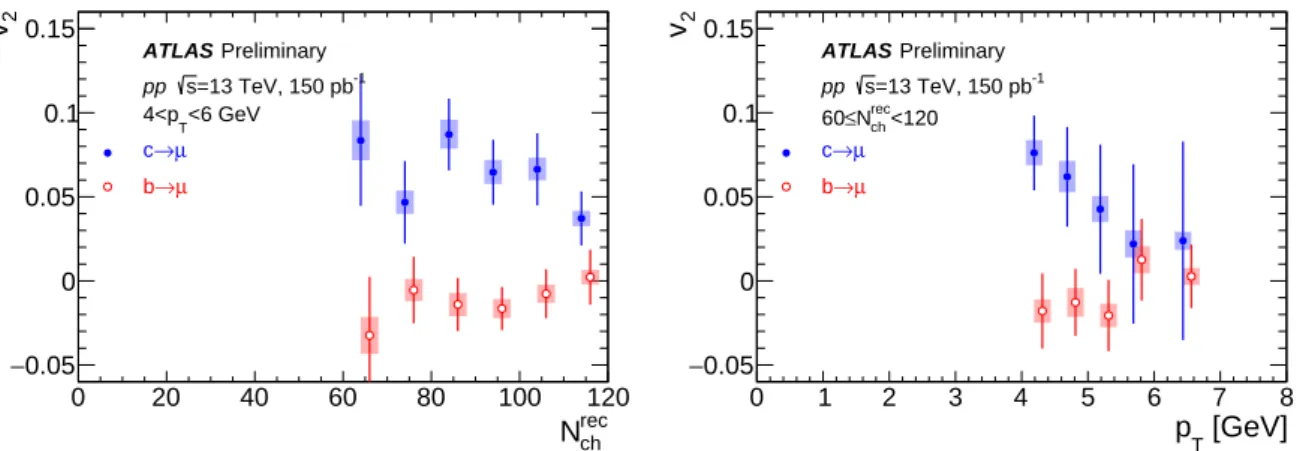
Figure 4 shows the v
2for muons from charm and bottom decays separately, as a function of N
chrecfor
0 20 40 60 80 100 120 rec
Nch
−0.05 0 0.05 0.1 v20.15
Preliminary ATLAS
=13 TeV, 150 pb-1
s pp
<6 GeV 4<pT
µ
→ c
µ
→ b
0 1 2 3 4 5 6 7 8
[GeV]
pT
−0.05 0 0.05 0.1 v20.15
Preliminary ATLAS
=13 TeV, 150 pb-1
s pp
<120
rec
Nch
≤ 60
µ
→ c
µ
→ b
Figure 4: v2of muons from charm and bottom decays as a function of multiplicity for muons in 4<pT <6 GeV (left) and as a function ofpTfor the 60≤Nchrec<120 multiplicity range in the 13 TeVppdata. Data points are shifted by±1 inNchrecand±0.125 GeV inpTfor better visibility. The vertical bars and shaded bands represent statistical and systematic uncertainties, respectively.
4 < p
T< 6 GeV (left) and as a function of p
Tfor 60 ≤ N
chrec< 120 (right). The v
2of muons from bottom decays is consistent with zero in the entire N
chrecrange of the measurement and with no discernible p
Tdependence. In contrast, the v
2of muons from charm decays is non-zero at lower p
Tbut consistent with zero at higher p
T. It also shows no significant N
chrecdependence within the uncertainties.
In summary, a measurement of elliptic flow coefficients for heavy-flavor decay muons in pp collisions
at 13 TeV is presented, including a separation between charm and bottom contributions. The inclusive
heavy-flavor muon v
2values turn out to be not dependent on N
chrecin the range 60–120 and show a clear
decrease in p
Tfrom 4 to 7 GeV. The bottom decay muons have v
2values consistent with zero within
statistical and systematic uncertainties, while the charm decay muons have significant non-zero v
2. These
results indicate that bottom quarks, unlike light and charm quarks, do not participate in the collective
behavior in high multiplicity pp collisions. These results will provide fundamental new input to the
theoretical models in development which attempt to describe heavy quark transport and energy loss in
these smallest collision systems.
References
[1] P. Romatschke and U. Romatschke, Relativistic Fluid Dynamics In and Out of Equilibrium – Ten Years of Progress in Theory and Numerical Simulations of Nuclear Collisions, (2017), arXiv:
1712.05815 [nucl-th] (cit. on p. 2).
[2] U. Heinz and R. Snellings, Collective flow and viscosity in relativistic heavy-ion collisions, Ann.
Rev. Nucl. Part. Sci. 63 (2013) 123, arXiv: 1301.2826 [nucl-th] (cit. on p. 2).
[3] Y. L. Dokshitzer and D. E. Kharzeev, Heavy quark colorimetry of QCD matter, Phys. Lett. B519 (2001) 199, arXiv: hep-ph/0106202 [hep-ph] (cit. on p. 2).
[4] R. Sharma, I. Vitev, and B.-W. Zhang, Light-cone wave function approach to open heavy flavor dynamics in QCD matter, Phys. Rev. C80 (2009) 054902, arXiv: 0904.0032 [hep-ph] (cit. on p. 2).
[5] S. Batsouli, S. Kelly, M. Gyulassy, and J. L. Nagle, Does the charm flow at RHIC? Phys. Lett. B557 (2003) 26, arXiv: nucl-th/0212068 [nucl-th] (cit. on p. 2).
[6] PHENIX Collaboration, Energy Loss and Flow of Heavy Quarks in Au + Au Collisions at √ s
NN= 200 GeV, Phys. Rev. Lett. 98 (2007) 172301, arXiv: nucl-ex/0611018 [nucl-ex] (cit. on p. 2).
[7] X. Dong, Y.-J. Lee, and R. Rapp, Open Heavy-Flavor Production in Heavy-Ion Collisions, (2019), arXiv: 1903.07709 [nucl-ex] (cit. on p. 2).
[8] J. L. Nagle and W. A. Zajc, Small System Collectivity in Relativistic Hadronic and Nuclear Collisions, Ann. Rev. Nucl. Part. Sci. 68 (2018) 211, arXiv: 1801.03477 [nucl-ex] (cit. on p. 2).
[9] R. D. Weller and P. Romatschke, One fluid to rule them all: viscous hydrodynamic description of event-by-event central p + p, p + Pb and Pb + Pb collisions at √
s = 5.02 TeV, Phys. Lett. B774 (2017) 351, arXiv: 1701.07145 [nucl-th] (cit. on p. 2).
[10] CMS Collaboration, Elliptic flow of charm and strange hadrons in high-multiplicity pPb collisions at √
s
NN= 8.16 TeV, Phys. Rev. Lett. 121 (2018) 082301, arXiv: 1804.09767 [hep-ex] (cit. on p. 2).
[11] ALICE Collaboration, Azimuthal Anisotropy of Heavy-Flavor Decay Electrons in p-Pb Collisions at √
s
NN= 5.02 TeV, Phys. Rev. Lett. 122 (2019) 072301, arXiv: 1805.04367 [nucl-ex] (cit. on p. 2).
[12] ALICE Collaboration, D-meson production in p-Pb collisions at √
s
NN= 5.02 TeV and in pp collisions at √
s = 7 TeV, Phys. Rev. C94 (2016) 054908, arXiv: 1605.07569 [nucl-ex] (cit. on p. 2).
[13] G. D. Moore and D. Teaney, How much do heavy quarks thermalize in a heavy ion collision? Phys.
Rev. C71 (2005) 064904, arXiv: hep-ph/0412346 [hep-ph] (cit. on p. 2).
[14] ATLAS Collaboration, The ATLAS Experiment at the CERN Large Hadron Collider, JINST 3 (2008) S08003 (cit. on p. 2).
[15] ATLAS Collaboration, Performance of the ATLAS trigger system in 2015, Eur. Phys. J. C 77 (2017) 317, arXiv: 1611.09661 [hep-ex] (cit. on p. 2).
[16] ATLAS Collaboration, Measurements of long-range azimuthal anisotropies and associated Fourier coe ffi cients for pp collisions at √
s = 5.02 and 13 TeV and p + Pb collisions at √
s
NN= 5.02 TeV
with the ATLAS detector, Phys. Rev. C 96 (2017) 024908, arXiv: 1609.06213 [hep-ex] (cit. on
pp. 2–4, 6).
[17] ATLAS Collaboration, Track Reconstruction Performance of the ATLAS Inner Detector at √ s = 13 TeV, ATL-PHYS-PUB-2015-018, 2015, url: https : / / cds . cern . ch / record / 2037683 (cit. on p. 3).
[18] ATLAS Collaboration, Muon reconstruction performance of the ATLAS detector in proton–proton collision data at √
s = 13 TeV, Eur. Phys. J. C 76 (2016) 292, arXiv: 1603.05598 [hep-ex]
(cit. on p. 3).
[19] T. Sjostrand, S. Mrenna, and P. Z. Skands, A brief introduction to PYTHIA 8.1, Comput. Phys.
Commun. 178 (2008) 852, arXiv: 0710.3820 [hep-ph] (cit. on p. 3).
[20] R. D. Ball et al., Parton distributions with LHC data, Nucl. Phys. B 867 (2013) 244, arXiv:
1207.1303 [hep-ph] (cit. on p. 3).
[21] ATLAS Collaboration, ATLAS Pythia 8 tunes to 7 TeV data, ATL-PHYS-PUB-2014-021, 2014, url:
https://cds.cern.ch/record/1966419 (cit. on p. 3).
[22] S. Agostinelli et al., GEANT4: a simulation toolkit, Nucl. Instrum. Meth. A 506 (2003) 250 (cit. on p. 3).
[23] ATLAS Collaboration, The ATLAS Simulation Infrastructure, Eur. Phys. J. C 70 (2010) 823, arXiv:
1005.4568 [physics.ins-det] (cit. on p. 3).
[24] ATLAS Collaboration, Observation of Long-Range Elliptic Azimuthal Anisotropies in √ s = 13 and 2.76 TeV pp Collisions with the ATLAS Detector, Phys. Rev. Lett. 116 (2016) 172301, arXiv:
1509.04776 [hep-ex] (cit. on pp. 3, 4).
[25] PHENIX Collaboration, Dihadron azimuthal correlations in Au + Au collisions at √
s
NN= 200 GeV, Phys. Rev. C78 (2008) 014901, arXiv: 0801.4545 [nucl-ex] (cit. on p. 3).
[26] S. H. Lim et al., Examination of Flow and Non-Flow Factorization Methods in Small Collision Systems, (2019), arXiv: 1902.11290 [nucl-th] (cit. on p. 3).
[27] ATLAS Collaboration, Measurement of the azimuthal anisotropy for charged particle production in
√ s
NN= 2.76 TeV lead–lead collisions with the ATLAS detector, Phys. Rev. C 86 (2012) 014907, arXiv: 1203.3087 [hep-ex] (cit. on p. 4).
[28] ATLAS Collaboration, Measurements of the electron and muon inclusive cross-sections in proton–
proton collisions at √
s = 7 TeV with the ATLAS detector, Phys. Lett. B 707 (2012) 438, arXiv:
1109.0525 [hep-ex] (cit. on p. 4).
[29] ATLAS Collaboration, Measurement of the suppression and azimuthal anisotropy of muons from heavy-flavor decays in Pb + Pb collisions at √
s
NN= 2.76 TeV with the ATLAS detector, Phys. Rev.
C98 (2018) 044905, arXiv: 1805.05220 [nucl-ex] (cit. on p. 4).
[30] M. Cacciari et al., Theoretical predictions for charm and bottom production at the LHC, JHEP 10
(2012) 137, arXiv: 1205.6344 [hep-ph] (cit. on p. 5).
A Appendix
−1 0 1 2 3 4
φ
∆ 0.96
0.98 1 1.02 1.04 1.06 1.08
)φ∆C( 1.1 ATLAS Preliminary
=13 TeV, 150 pb-1
s pp
<120
rec
Nch
≤ 110
<5 GeV
h
0.5<pT
<6 GeV
µ
4<pT
|<5 η
∆ 1.5<|
=0.0033
=0.38, v2,2 µ
→
=0.18, fb
fsig
Data φ)+G
∆
LM( FC
φ)
∆
templ( C
LM(0) φ)+FC
∆
ridge( C
−1 0 1 2 3 4
φ
∆ 0.96
0.98 1 1.02 1.04 1.06 1.08
)φ∆C( 1.1 ATLAS Preliminary
=13 TeV, 150 pb-1
s pp
<120
rec
Nch
≤ 110
<5 GeV
h
0.5<pT
<6 GeV
µ
4<pT
|<5 η
∆ 1.5<|
=0.0021
=0.38, v2,2 µ
→
=0.67, fb
fsig
Data φ)+G
∆
LM( FC
φ)
∆
templ( C
LM(0) φ)+FC
∆
ridge( C
−1 0 1 2 3 4
φ
∆ 0.96
0.98 1 1.02 1.04 1.06 1.08
)φ∆C( 1.1 ATLAS Preliminary
=13 TeV, 150 pb-1
s pp
<120
rec
Nch
≤ 110
<5 GeV
h
0.5<pT
<6 GeV
µ
4<pT
|<5 η
∆ 1.5<|
=0.0020
=0.38, v2,2 µ
→
=0.81, fb
fsig
Data φ)+G
∆
LM( FC
φ)
∆
templ( C
LM(0) φ)+FC
∆
ridge( C
−1 0 1 2 3 4
φ
∆ 0.96
0.98 1 1.02 1.04 1.06 1.08
)φ∆C( 1.1 ATLAS Preliminary
=13 TeV, 150 pb-1
s pp
<120
rec
Nch
≤ 110
<5 GeV
h
0.5<pT
<6 GeV
µ
4<pT
|<5 η
∆ 1.5<|
=0.0009
=0.64, v2,2 µ
→
=0.97, fb
fsig
Data φ)+G
∆
LM( FC
φ)
∆
templ( C
LM(0) φ)+FC
∆
ridge( C
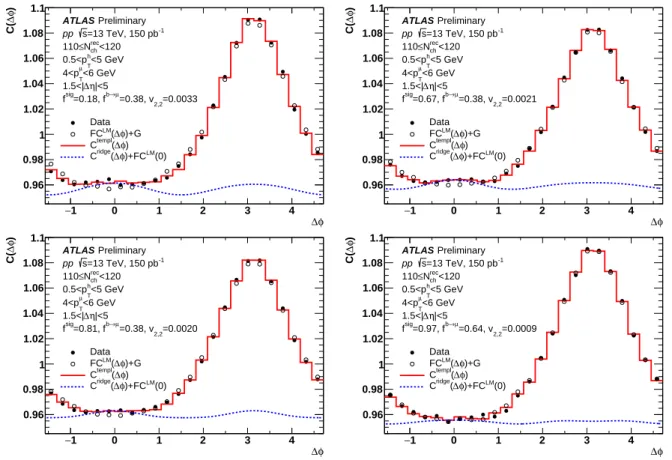
Figure 5: Template fit to the muon-hadron correlation function,C(∆φ), with 1.5<|∆η|<5 in 13 TeVppevents of 110<Nchrec≤120. Muons in 4<pT <6 GeV and charged particles in 0.5<pT<5 GeV are used. Each panel represents the muon-hadron correlation function with muons of different signal fractions (fsig) andb-fraction (fb→µ).
The open points and curves show different components of the template as specified in the legend.
4 4.5 5 5.5 6 6.5 7 [GeV]
pT
0 0.1 0.2 0.3 0.4 0.5 0.6 0.7 0.8 0.9 / c,bµ→c)→b(µ→ 1
Preliminary ATLAS
=13 TeV, 150 pb-1
s pp
|<2.4 η
|
Data PYTHIA8 FONLL
Figure 6: Fraction of muons from bottom decay as a function ofpTfor muons in minimum-bias and high-multiplicity triggered events used in the muon-hadron correlation. The shaded bands represent the systematic uncertainty.
The solid magenta line shows theb-fraction in Pythia8, and the solid gray line represents theb-fraction from the fixed-order plus next-to-leading-logarithm (FONLL) calculation, with the two gray dotted lines showing systematic uncertainties of this calculation.
0 0.1 0.2 0.3 0.4 0.5 0.6 0.7 0.8 0.9 1 Signal fraction 0
0.001 0.002 0.003 0.004 0.005 0.006 0.007 0.008
2,2v <120rec
Nch
≤ 110
|<5 η
∆ 1.5<|
<6 GeV
µ
4<pT
<5 GeV
h
0.5<pT
=0.38
µ
→
fb
Preliminary ATLAS
=13 TeV, 150 pb-1
s pp
Template Fit
0 0.1 0.2 0.3 0.4 0.5 0.6 0.7 0.8 0.9 1 b-fraction 0.002
− 0.001
− 0 0.001 0.002 0.003 0.004 0.005 0.006 0.007 0.008
sig 2,2v <120
Ntrk
≤ 110
|<5 η
∆ 1.5<|
<6 GeV
µ
4<pT
<5 GeV
h
0.5<pT
Preliminary ATLAS
=13 TeV, 150 pb-1
s pp
Template Fit
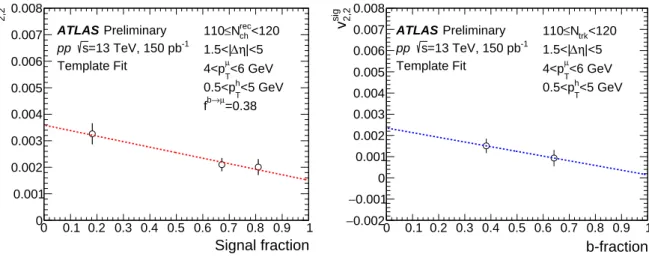
Figure 7: Template fit to the muon-hadron correlation function,C(∆φ), with 1.5<|∆η|<5 in 13 TeVppevents of 110≤Nchrec<120. Muons in 4<pT <6 GeV and charged particles in 0.5<pT<5 GeV are used. Each panel represents the muon-hadron correlation function with muons of different signal fractions (fsig) andb-fraction (fb→µ).
The open points and curves show different components of the template as specified in the legend. The vertical bars represent the statistical uncertainty.
0.005
− 0 0.005 0.01 0.015
µ,h)
2,2( vc
−0.01 0.005
− 0 0.005 b,h)µ(v2,2 0.01
Preliminary ATLAS
=13 TeV, 150 pb-1
s pp
<70 Ntrk
≤ 60
|<5 η
∆ 1.5<|
<6 GeV
µ
4<pT
<5 GeV
h
0.5<pT
C.I.
σ 1
C.I.
σ 2
0.005
− 0 0.005 0.01 0.015
µ,h)
2,2( vc
−0.01 0.005
− 0 0.005 b,h)µ(v2,2 0.01
Preliminary ATLAS
=13 TeV, 150 pb-1
s pp
<80 Ntrk
≤ 70
|<5 η
∆ 1.5<|
<6 GeV
µ
4<pT
<5 GeV
h
0.5<pT
C.I.
σ 1
C.I.
σ 2
0.005
− 0 0.005 0.01 0.015
µ,h)
2,2( vc
−0.01 0.005
− 0 0.005 b,h)µ(v2,2 0.01
Preliminary ATLAS
=13 TeV, 150 pb-1
s pp
<90 Ntrk
≤ 80
|<5 η
∆ 1.5<|
<6 GeV
µ
4<pT
<5 GeV
h
0.5<pT
C.I.
σ 1
C.I.
σ 2
0.005
− 0 0.005 0.01 0.015
µ,h)
2,2( vc
−0.01 0.005
− 0 0.005 b,h)µ(v2,2 0.01
Preliminary ATLAS
=13 TeV, 150 pb-1
s pp
<100 Ntrk
≤ 90
|<5 η
∆ 1.5<|
<6 GeV
µ
4<pT
<5 GeV
h
0.5<pT
C.I.
σ 1
C.I.
σ 2
0.005
− 0 0.005 0.01 0.015
µ,h)
2,2( vc
−0.01 0.005
− 0 0.005 b,h)µ(v2,2 0.01
Preliminary ATLAS
=13 TeV, 150 pb-1
s pp
<110 Ntrk
≤ 100
|<5 η
∆ 1.5<|
<6 GeV
µ
4<pT
<5 GeV
h
0.5<pT
C.I.
σ 1
C.I.
σ 2
0.005
− 0 0.005 0.01 0.015
µ,h)
2,2( vc
−0.01 0.005
− 0 0.005 b,h)µ(v2,2 0.01
Preliminary ATLAS
=13 TeV, 150 pb-1
s pp
<120 Ntrk
≤ 110
|<5 η
∆ 1.5<|
<6 GeV
µ
4<pT
<5 GeV
h
0.5<pT
C.I.
σ 1
C.I.
σ 2
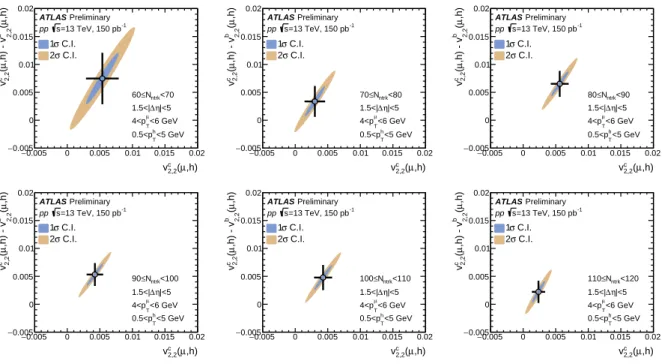
Figure 8: Correlation ofvc2,2(pµT,phT) andvb2,2(pµT,phT) from muon-hadron correlation for muons in 4<pT<6 GeV and charged hadrons in 0.5<pT<5 GeV, and blue (yellow) bands correspond to a 1σ(2σ) confidence intervals.
Each panel represents a differentNchrecrange.
0.005
− 0 0.005 0.01 0.015 0.02
µ,h)
2,2( vc 0.005
− 0 0.005 0.01 0.015 ,h)µ(2,2 0.02
b,h) - vµ(2,2cv
Preliminary ATLAS
=13 TeV, 150 pb-1
s pp
<70 Nntrk
≤ 60
|<5 η
∆ 1.5<|
<6 GeV
µ
4<pT
<5 GeV
h
0.5<pT
C.I.
σ 1
C.I.
σ 2
0.005
− 0 0.005 0.01 0.015 0.02
µ,h)
2,2( vc 0.005
− 0 0.005 0.01 0.015 ,h)µ(2,2 0.02
b,h) - vµ(2,2cv
Preliminary ATLAS
=13 TeV, 150 pb-1
s pp
<80 Nntrk
≤ 70
|<5 η
∆ 1.5<|
<6 GeV
µ
4<pT
<5 GeV
h
0.5<pT
C.I.
σ 1
C.I.
σ 2
0.005
− 0 0.005 0.01 0.015 0.02
µ,h)
2,2( vc 0.005
− 0 0.005 0.01 0.015 ,h)µ(2,2 0.02
b,h) - vµ(2,2cv
Preliminary ATLAS
=13 TeV, 150 pb-1
s pp
<90 Nntrk
≤ 80
|<5 η
∆ 1.5<|
<6 GeV
µ
4<pT
<5 GeV
h
0.5<pT
C.I.
σ 1
C.I.
σ 2
0.005
− 0 0.005 0.01 0.015 0.02
µ,h)
2,2( vc 0.005
− 0 0.005 0.01 0.015 ,h)µ(2,2 0.02 b,h) - vµ(2,2cv
Preliminary ATLAS
=13 TeV, 150 pb-1
s pp
<100 Nntrk
≤ 90
|<5 η
∆ 1.5<|
<6 GeV
µ
4<pT
<5 GeV
h
0.5<pT
C.I.
σ 1
C.I.
σ 2
0.005
− 0 0.005 0.01 0.015 0.02
µ,h)
2,2( vc 0.005
− 0 0.005 0.01 0.015 ,h)µ(2,2 0.02 b,h) - vµ(2,2cv
Preliminary ATLAS
=13 TeV, 150 pb-1
s pp
<110 Nntrk
≤ 100
|<5 η
∆ 1.5<|
<6 GeV
µ
4<pT
<5 GeV
h
0.5<pT
C.I.
σ 1
C.I.
σ 2
0.005
− 0 0.005 0.01 0.015 0.02
µ,h)
2,2( vc 0.005
− 0 0.005 0.01 0.015 ,h)µ(2,2 0.02 b,h) - vµ(2,2cv
Preliminary ATLAS
=13 TeV, 150 pb-1
s pp
<120 Nntrk
≤ 110
|<5 η
∆ 1.5<|
<6 GeV
µ
4<pT
<5 GeV
h
0.5<pT
C.I.
σ 1
C.I.
σ 2
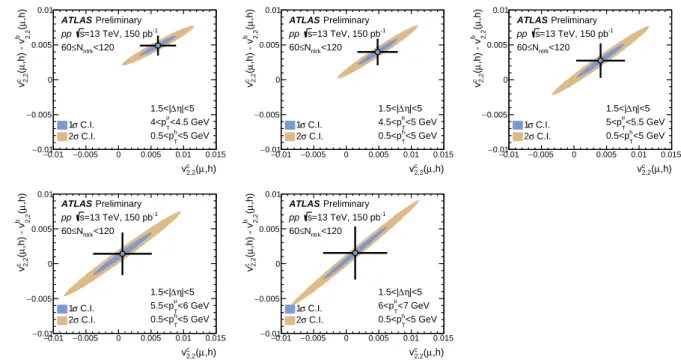
Figure 9: Correlation ofvc2,2(pµT,phT) andvc2,2(pµT,phT)−vb2,2(pµT,phT) from muon-hadron correlation for muons in 4< pT <6 GeV and charged hadrons in 0.5 < pT <5 GeV, and blue (yellow) bands correspond to a 1σ(2σ) confidence intervals. Each panel represents a differentNrecch range.