ATLAS-CONF-2012-116 14August2012
ATLAS NOTE
ATLAS-CONF-2012-116
August 12, 2012
Measurement of the azimuthal dependence of inclusive jet suppression in Pb + Pb collisions at √
s
NN= 2.76 TeV with the ATLAS detector
The ATLAS Collaboration
Abstract
Measurements of the variation of inclusive jet suppression as a function of azimuthal angle,
∆φ, with respect to the elliptic flow event plane can provide insight on the path lengthdependence of jet quenching in the the hot medium created in ultra-relativistic heavy ion collisions. ATLAS has measured the
∆φdependence of jet yields in
√sNN =
2.76 TeV Pb+Pb collisions for different bins in collision centrality over the centrality range 5%-60%.
The jets were reconstructed using the anti-k
talgorithm with distance parameter
R =0.2, and the jet kinematics were evaluated using a subtraction procedure which accounts for both the average energy density and the elliptic flow modulation of the underlying event.
The variation of the jet yield with
∆φwas characterized by the elliptic flow parameter,
vjet2, which has a characteristic centrality dependence seen in previous measurements and which decreases with increasing jet transverse momentum (p
T). Ratios are presented of
pTspectra between di
fferent
∆φbins to illustrate the variation in the single jet suppression with
∆φ.c
Copyright 2012 CERN for the benefit of the ATLAS Collaboration.
Reproduction of this article or parts of it is allowed as specified in the CC-BY-3.0 license.
1 Introduction
Collisions between lead (Pb) nuclei at the LHC at a centre of mass energy,
√s
NN, of 2.76 TeVare thought to produce quark-gluon plasma (QGP), a form of strongly interacting matter in which quarks and gluons become locally deconfined. Measurements of jets produced in hard scattering processes provide a valu- able experimental probe of the medium created in the Pb
+Pb collisions that may help determine whether the QGP is created. Theoretically, the constituents of a parton shower may scatter and lose energy in the medium thereby modifying the properties of the final state jet (see [1] and references therein). The full set of possible modifications is frequently referred to as “jet quenching”. E
ffects consistent with jet quenching have been observed in several di
fferent measurements in Pb
+Pb collisions at the LHC [2, 3].
In particular, the inclusive jet yield was observed to be suppressed by a factor of approximately two in central Pb
+Pb collisions relative to peripheral collisions [4]. Such a suppression could result from the reduction in the energy of the jets in propagating through the hot medium created in Pb
+Pb collisions.
An experimental test of whether the observed jet suppression is due to final-state jet quenching, and not initial-state e
ffects, is to measure the magnitude of jet suppression as a function of the path length of the parton shower in the medium. This test may be performed in non-central Pb
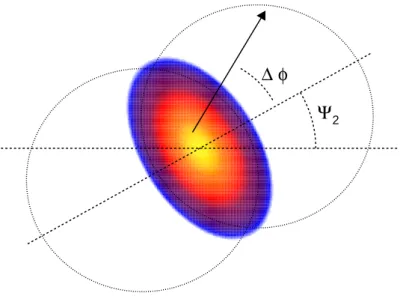
+Pb collisions where the finite impact parameter results in incomplete overlap in the transverse plane. That incomplete overlap creates a medium which has an approximately elliptic profile in the transverse plane illustrated in Fig. 1.
That profile generates so-called “elliptic flow,” a modulation in the yield of soft particles in the final state that results from collective expansion of the medium that causes more particles to be emitted parallel to the minor axis of the ellipse and fewer particles to be emitted parallel to the major axis of the ellipse.
That modulation can be parameterized by the functional form dN
dφ
=A 1
+2v
2cos 2(φ
−Ψ2) . (1)
The “event plane” angle,
Ψ2, represents both the orientation of the initial-state ellipse and the phase of the modulation of the final-state particle yield. It can be measured experimentally by determining the phase event-by-event.
The elliptic profile of the initial state also provides a way to select jets associated with parton showers that have traversed different path lengths in the medium [5]. Jets produced at small
∆φ
≡φ
− Ψ2will traverse, on average, shorter path lengths in the medium than jets produced at
∆φ
∼ ±π/2. Suchdifferences in path lengths are expected to produce noticeable variations in observables sensitive to jet quenching. Such a variation was observed at RHIC in measurements of neutral pion production as a function of
∆φ [6, 7] in Au
+Au collisions at
√s
NN =200 GeV, where the suppression in the pion yield was observed to vary with
∆φ. Measurements of charged particle v
2at high p
Tin Pb+Pb collisions at the LHC [8, 9] also show significant variation of the yield as a function of
∆φ. That variation was found to be consistent with results from a jet quenching calculation [10].
To date, no measurement of the azimuthal variation of jet quenching in non-central events has been performed using the jets themselves. A measurement of the azimuthal variation in the jet yield would demonstrate not only that the inclusive jet suppression results from final-state jet modifications but would also probe the path length dependence of the jet energy loss, and, thereby, provide insights on the mech- anisms responsible for that energy loss. This note presents results of such a measurement by ATLAS.
The azimuthal variation of the jet yield was measured in
√s
NN =2.76 TeV Pb
+Pb collisions at the
LHC using R
=0.2 anti-k
tjets. The jet kinematics were evaluated after applying a subtraction procedure
which accounts for both the average energy density and the elliptic flow modulation of the underlying
event (UE) [4]. The UE v
2was measured event-by-event over
|η|< 3.2 in the calorimeter. The use of a
narrow jet definition reduces the sensitivity of the measurement to fluctuations in the UE that contribute
to the jet energy resolution, and to the elliptic flow in the UE that could potentially induce an artificial
∆φ
Ψ
2φ
∆
Figure 1: Illustration of the initial state elliptic anisotropy in non-central Pb+Pb collisions and the effect of that anisotropy on the path lengths traversed by parton showers in the medium.
Ψ2describes the orientation of the minor axis of the ellipse with respect to the horizontal. The arrow represents the path in the transverse plane of a hypothetical jet. The average length of that path will depend on
∆φ, the angle of the jet relative to
Ψ2.
variation in the measured jet yields. Results are reported for a) the variation of jet v
2with the centrality and transverse momentum and b) the ratios of inclusive jet spectra measured over di
fferent
∆φ ranges.
2 Experimental setup
The measurements presented in this paper were performed using the ATLAS calorimeter, inner detec- tor, trigger, and data acquisition systems [11]. The ATLAS calorimeter system consists of a liquid argon (LAr) electromagnetic (EM) calorimeter covering
|η|< 3.2, a steel-scintillator sampling hadronic calorimeter covering
|η|< 1.7, a LAr hadronic calorimeter covering 1.5 <
|η|< 3.2, and a forward calorimeter (FCal) covering 3.2 <
|η|< 4.9
1. Charged particles associated with the calorimeter jets were measured over
|η|< 2.5 using the inner detector [12], which is composed of silicon pixel detectors in the innermost layers, followed by silicon microstrip detectors and a straw-tube tracker, all immersed in a 2 T axial magnetic field provided by a solenoid.
Minimum bias Pb+Pb collisions were identified using measurements from the zero-degree calorime- ters (ZDCs) and the minimum-bias trigger scintillator (MBTS) counters. The ZDCs are located symmet- rically at z
= ±140 m and cover|η|> 8.3. In Pb
+Pb collisions the ZDCs primarily measure “spectator”
neutrons, that is neutrons from the incident nuclei that do not interact hadronically. The MBTS measures charged particles over 2.1 <
|η|< 3.9 using two counters placed at z
=±3.6 m.Events used in this analysis were selected for recording using a combination of Level-1 minimum-
1ATLAS uses a right-handed coordinate system with its origin at the nominal interaction point (IP) in the centre of the detector and thez-axis along the beam pipe. Thex-axis points from the IP to the centre of the LHC ring, and theyaxis points upward. Cylindrical coordinates (r, φ) are used in the transverse plane,φbeing the azimuthal angle around the beam pipe. The pseudorapidity is defined in terms of the polar angleθasη=−ln tan(θ/2).
bias and high-level trigger (HLT) jet triggers. The minimum-bias trigger was formed from an “OR” of Level-1 ZDC coincidence and total transverse energy triggers. The transverse energy trigger required
ΣE
T> 10 GeV in the calorimeter. Level-1 minimum-bias triggers seeded an HLT [13] jet trigger which ran the offline Pb+Pb jet reconstruction algorithm described below, except that the HLT jet algorithm did not correct for the elliptic flow modulation of the UE and it did not apply the final hadronic energy scale correction. Thus, the HLT jet energies were defined at the electromagnetic energy scale. The HLT jet trigger used in this analysis required a jet reconstructed using the anti-k
talgorithm with R
=0.2 to have a transverse energy, E
T, of at least 20 GeV. Such jets found by the HLT were recorded in the event for use in the offline analysis. A separate minimum-bias triggered sample was used to provide measurements of jets at lower p
Tvalues where the jet trigger was not fully efficient. This minimum-bias sample was selected by requiring a total transverse energy trigger of
ΣE
T> 50 GeV or the ZDC coincidence trigger.
3 Event selection and data sets
A total integrated luminosity of 0.14 nb
−1of Pb
+Pb collisions were recorded by ATLAS in 2011. Events were required to have a reconstructed primary vertex, and a time di
fference between hits in the two sides of the MBTS detector of less than 3 ns. The primary vertices were reconstructed from charged particle tracks with p
T> 500 MeV. The tracks were reconstructed from hits in the inner detector using the standard track reconstruction algorithm [14] with settings optimized for the high hit density in heavy ion collisions [8]. The efficiency for a minimum-bias Pb+Pb collision to pass the applied selections was estimated to be 98
±2%.
The centrality of Pb
+Pb collisions was characterized by
ΣE
FCalT, the total transverse energy measured in the forward calorimeters (FCal) [8]. The results reported here were obtained using the following cen- trality bins defined according to successive percentiles of the
ΣE
TFCaldistribution ordered from the most central to the most peripheral collisions: 5–10%, 10–20%, 20–30%, 30–40%, 40–50%, and 50–60%.
The percentiles were defined after correcting the
ΣE
FCalTdistribution for the 2% minimum-bias trigger ine
fficiency which is concentrated in the most peripheral bins not included in this analysis. A Glauber Monte Carlo analysis [15, 16] was used to estimate the average number of interacting or “participating”
nucleons,
hNparti, for Pb+Pb collisions within each centrality bin. The quantity, N
part, directly character- izes the degree of overlap between the nuclei in the transverse plane and provides a physically meaningful way of quantifying centrality.
The performance of the ATLAS detector and offline analysis in measuring jets and charged particles in the environment of Pb+Pb collisions was evaluated using a Monte Carlo (MC) sample consisting of overlaid
√s
=2.76 TeV pp hard scattering events and
√s
NN =2.76 TeV minimum-bias Pb
+Pb col- lisions. A total of 1 million simulated [17] Pb+Pb events were produced using version 1.38b of the HIJING event generator [18] run with default parameters except for the disabling of jet quenching. To simulate the e
ffects of elliptic flow in Pb
+Pb collisions, a parameterized centrality-, η- and p
T-dependent cos 2φ modulation based on previous ATLAS measurements [8] was imposed on the particles after gen- eration [19]. The detector response to the resulting HIJING events was evaluated using GEANT4 [20]
configured with geometry and digitization parameters matching those of the 2010 Pb
+Pb run. Sepa-
rately, one million PYTHIA [21] hard-scattering events were fully simulated for each of five intervals
of ˆ p
T, the transverse momentum of outgoing partons in the 2
→2 hard-scattering, with boundaries
17, 35, 70, 140, 280, and 560 GeV. The events for each ˆ p
Trange were overlaid onto the same set of
HIJING events prior to “digitization”. In the analysis of the MC samplethe different ˆ p
Tsamples were
combined using a weighting based on the PYTHIA cross-sections for each ˆ p
Trange.
4 Reconstruction
For each event, the elliptic event plane angle,
Ψ2, was computed from the azimuthal variation of the trans- verse energy density measured by the forward calorimeters using standard techniques [8, 22]. Specifi- cally,
Ψ2was calculated from:
Ψ2=
1 2 tan
−1
X
w
iE
Tisin 2φ
iX
w
iE
Ticos 2φ
i
(2) where the index i runs over the FCal cells and E
Tiand φ
irepresent the E
Tmeasured in cell i and its azimuthal position. Azimuthal variations of the FCal response were corrected by applying per-cell weights w
i.
Jets were reconstructed using the techniques described in [4], which are briefly summarized here.
The anti-k
talgorithm was first run in four-vector recombination mode on
∆η
×∆φ
=0.1
×0.1 logical towers with the value of the anti-k
tdistance parameter, R, set to 0.2. The tower kinematics were obtained by summing electromagnetic scale energies of calorimeter cells within the tower boundaries. Then, a two-step iterative procedure was used to estimate a layer- and η-dependent UE energy density while excluding actual jets from that estimate. The final jet kinematics were obtained by subtracting the UE energy from each calorimeter cell within the towers included in the reconstructed jet. The subtraction accounts for “elliptic flow” in the UE using per-layer calorimeter η-averaged v
2values measured over
|η|
< 3.2. Following reconstruction, the jet energies were corrected to the hadronic scale using an η- and jet E
T-dependent multiplicative factor.
Separate from the reconstruction of jets using calorimeter data, “track jets” were reconstructed by applying the anti-k
talgorithm with R
=0.4 to reconstructed charged particles having p
trkT> 4 GeV. The p
Tthreshold on the charged particles suppresses contributions of the UE to the track jet measurement, such that a typical track jet has less than 4% likelihood of including a charged particle from the UE in central (0–10%) collisions. In more peripheral collisions the UE contribution to the track jets is even smaller.
To reject “UE jets” generated by fluctuations in the underlying event, jets were required to match within
∆R < 0.2 either a track jet having p
T> 10 GeV, or a reconstructed electromagnetic cluster having p
T> 7 GeV. This rejection reduces the rate of UE jets to less than 1% while introduces a small additional source of jet reconstruction ine
fficiency which is corrected as described in Sec. 5.1.
5 Analysis
The physical quantity of interest for this note is the double di
fferential jet yield d
2N
jet/dp
Td
∆φ. The uncorrected d
2N
jet/dp
Td
∆φ was measured over the pseudorapidity interval
|η|< 2.1 in five p
Tbins: 45–
60 GeV, 60–80 GeV, 80–110 GeV, 110–160 GeV, and 160–210 GeV, and eight equal size bins in
∆φ spanning the range 0 <
∆φ < π/2. For many of the results shown below, those
∆φ bins were combined into four. To avoid potential trigger bias, resulting from the fact that the HLT was run without elliptic flow correction, the measurement in the 45–60 GeV p
Tbins was performed using minimum-bias events, while the measurement for all other p
Tbins was performed using HLT-selected events. For results obtained using the HLT jet trigger, only jets within
∆R < 0.4 of a recorded E
T> 20 GeV HLT jet were included in the analysis.
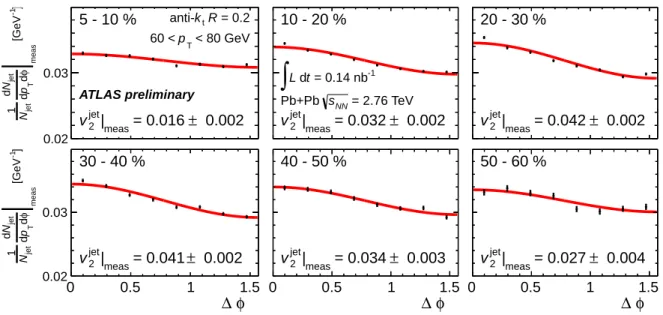
Examples of the measured d
2N
jet/dp
Td∆ φ distribution plotted as a function of
∆φ for the 60–80 GeV
p
Tbin are shown in Fig. 2 for the centrality bins included in this analysis. A significant modulation of
the jet yield is seen in all centrality bins. The modulation observed in Fig. 2 is well described by the
elliptic modulation expressed by Eq. (1), which is not surprising, though is in no way required. Results
]-1 [GeV measφd Tpd
jetNd jetN1
0.02 0.03
5 - 10 %
0.002
± = 0.016
|meas jet
v2
ATLAS preliminary
= 0.2
tR k anti-
< 80 GeV pT
60 <
φ
0 0.5 1 ∆ 1.5
]-1 [GeV measφd Tpd
jetNd jetN1
0.02 0.03
30 - 40 %
0.002
± = 0.041
|meas jet
v2
]-1 [GeV measφd Tpd
jetNd jetN1
10 - 20 %
0.002
± = 0.032
|meas jet
v2
= 2.76 TeV sNN
Pb+Pb = 0.14 nb-1
t d
∫
Lφ
0 0.5 1 ∆ 1.5
]-1 [GeV measφd Tpd
jetNd jetN1
40 - 50 %
0.003
± = 0.034
|meas jet
v2
]-1 [GeV measφd Tpd
jetNd jetN1
20 - 30 %
0.002
± = 0.042
|meas jet
v2
φ
0 0.5 1 ∆ 1.5
]-1 [GeV measφd Tpd
jetNd jetN1
50 - 60 %
0.004
± = 0.027
|meas jet
v2
Figure 2:
∆φ dependence of measured d
2N
jet/dp
Td∆ φ in the 60–80 GeV p
Tbin for six bins in collision centrality. The solid lines indicate fits to the points of the functional form in Eq. (1). The resulting measured v
2values, v
jet2 |meas, are listed in each panel. The error bars represent statistical uncertainties on the yields in each bin. For the most central collisions in the top row, the statistical uncertainties are comparable to the size of the points. For the 5-10% bin the statistical uncertainties are
±2x10⁻⁴on all eight points.
of fits of the measured d
2N
jet/d p
Td
∆φ distributions to the functional form of Eq. (1) are shown by the solid curves. The corresponding measured v
2values, v
jet2 |meas, are indicated on each panel of the figure.
The v
jet2 |measvalues for all p
Tbins are shown in Table 1.
The measured distribution d
2N
jet/dp
Td∆ φ is distorted by the finite resolution of both the
Ψ2and the p
Tmeasurement. The fluctuations in
Ψ2and p
Tare assumed to be uncorrelated because the measure- ments are performed using di
fferent parts of the calorimeter. The finite resolution of the
Ψ2measurement will reduce the measured v
2. In addition, the modulation of the UE could, in principle, induce a
∆φ de- pendence of the jet performance that would, in turn, lead to a
∆φ dependence in the p
Tbin migration.
Corrections for both sources of measurement resolution are required to transform the v
jet2 |measvalues shown in Fig. 2 to true jet v
2values, v
jet2.
The
Ψ2measurement resolution was evaluated using the “sub-event” technique [22] in which the
Ψ2Centrality hNparti vjet2
meas±stat
45 – 60 GeV 60 – 80 GeV 80 – 110 GeV 110 – 160 GeV 160 – 210 GeV 5 – 10% 330±3 0.022±0.004 0.016±0.002 0.017±0.003 0.018±0.007 0.028±0.02 10 – 20% 261±4 0.037±0.004 0.032±0.002 0.029±0.003 0.029±0.006 0.01±0.02 20 – 30% 186±4 0.051±0.004 0.042±0.002 0.028±0.003 0.024±0.007 0.019±0.02 30 – 40% 129±4 0.042±0.005 0.041±0.002 0.033±0.004 0.022±0.008 0.036±0.02 40 – 50% 86±4 0.039±0.007 0.034±0.003 0.029±0.005 0.027±0.01 0.022±0.03 50 – 60% 53±3 0.048±0.009 0.027±0.004 0.017±0.007 0.034±0.01 -0.03±0.04
Table 1: The measured v
2values and their statistical uncertainties in each centrality bin for jets in each
of the measured p
Tranges.
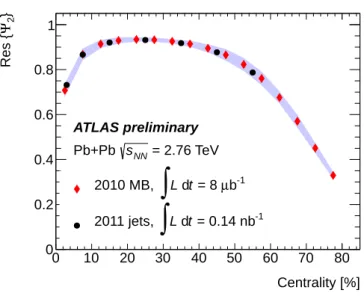
Centrality [%]
0 10 20 30 40 50 60 70 80
}2ΨRes {
0 0.2 0.4 0.6 0.8 1
b-1
µ = 8 t d
∫
L 2010 MB,= 0.14 nb-1
t d
∫
L 2011 jets, ATLAS preliminary= 2.76 TeV sNN
Pb+Pb
Figure 3: The event plane resolution, Res{
Ψ2}, as a function of centrality determined from minimum biasevents in the 2010 data in Ref. [8] (red) and the current analysis using jet-triggered events from 2011.
The shaded band represents the systematic uncertainty on the correction (see Sec. 6.1).
measurement is performed in separate η regions and the results compared for the same event. For this analysis the event plane angle was measured separately in the positive and negative η halves of the FCal using Eq. (2), with the sums restricted to positive and negative η values, respectively. This calculation yields
Ψ±2. The width of the distribution of
Ψ+2 −Ψ−2was then used to estimate the resolution of the combined
Ψ2measurement using standard techniques [22]. Specifically, the event-averaged
hcos[2(Ψ+2− Ψ−2)]i was determined for each centrality bin and was used to obtain the
Ψ2“resolution” factor, Res{
Ψ2},which is the multiplicative factor required to correct any measured v
2value for the finite
Ψ2resolution, i.e.
v
2=v
2|measRes{
Ψ2}. (3)
The distribution of collision centralities within a given centrality bin is di
fferent for minimum-bias events and events containing high- p
Tjets. To obtain the proper Res{
Ψ2}for this analysis, the resolution was evaluated using events selected by the HLT jet trigger. The centrality dependence of the
Ψ2resolution obtained from this analysis is shown in Fig. 3 and compared to results obtained for a previous ATLAS minimum-bias flow measurement [8] that used finer centrality bins. The agreement between the different results is good.
While the hard scattering processes could potentially bias the measurement of
Ψ2by producing jets within the pseudorapidity range of the FCal, the typical jet energy is much smaller than the
ΣE
TFCalover the range of centralities included in this measurement, and thus any such bias is expected to be small.
This conclusion was reinforced by a direct evaluation of the
Ψ2bias in the MC sample which showed negligible impact of the overlaid hard-scattering processes on the
Ψ2determination for collisions with centrality less than 60%.
5.1 Jet performance
The jet performance was evaluated from the MC sample by reconstructing MC “truth” jets from the final-state PYTHIA particles using the anti-k
talgorithm with R
=0.2. Each truth jet was matched to the nearest reconstructed jet within
∆R
= p(∆ η)
2+(∆ φ)
2< 0.2; truth jets without such a match were
considered to have been lost due to inefficiency. For the p
Trange included in this analysis, the R
=0.2
jet reconstruction efficiency was found to be > 98% for all centrality bins. The matched truth and reconstructed jet pairs were used to evaluate the jet energy resolution (JER) and jet energy scale (JES) closure, which is a measure of the extent to which input truth jets are reconstructed with the correct p
T, on average. Results of the R
=0.2 jet performance averaged over
∆φ are discussed in detail in Ref. [4]. Figure 4 shows representative results of the
∆φ dependence of the JES closure,
h∆p
Ti/ptruthT, and fractional JER, σ[∆ p
T]/p
truthT, for the 10–20% centrality bin and for the three lowest p
Tbins used in the analysis.
Because the azimuthal modulation of the UE has been accounted for in the jet reconstruction, there is no reason to expect a dependence of
h∆p
Ti/ptruthTon
∆φ. To the extent that the resolution on the
Ψ2measurement or the calorimeter v
2determination introduce errors in the elliptic flow corrections, those errors fluctuate and contribute to the JER, but should not influence the JES closure. Nonetheless, the results in Fig. 4 place constraints on the
∆φ variation of
h∆p
Ti/ptruthT. The statistical accuracy of the
h∆p
Ti/ptruthTdetermination in a given p
T,
∆φ bin is typically within 0.005
−0.02. No systematic variations of the JES closure with
∆φ are observed in the MC data. Comparisons of fits using di
fferent functional forms to the p
Tdependence of
h∆p
Ti/ptruthTin each of the four
∆φ bins shown in Fig. 4 limit the variation of
h∆p
Ti/ptruthTover 0 <
∆φ < π/2 to 0.005 for the lowest p
Tbin, where effects of the UE modulation on the JES are expected to be greatest.
The fractional JER may depend on
∆φ because the energy density in the UE is greater for jets with
∆
φ
∼0 than it is for jets with
∆φ
∼π/2. However, the effects of such a
∆φ dependence on the UE contribution to the JER are found to be at the level of, or below, the statistical precision of the JER determination in a given
∆φ bin (typically
∼1%). For the lowest p
Tbin, 45 < p
T< 60 GeV, where the UE modulation is expected to have greatest impact and where the fractional jet energy resolution is the largest, the results in Fig. 4 could accommodate up to a 0.01 change in the fractional JER over 0 <
∆φ < π/2. For all other p
Tbins the variation is less than 0.005.
The JER-induced bin migration effects are sufficiently small for the jet definition used in this analysis that a simple bin-by-bin unfolding is appropriate to unfold the jet spectra. The bin-by-bin correction factors were evaluated according to
C
i j =T
i jR
i j, (4)
where i and j denote p
Tand
∆φ bins, respectively, and T
i jand R
i jrepresent the number of MC truth and truth-matched reconstructed jets, respectively, with truth or reconstructed p
Tand
∆φ values in the chosen bins.
The correction factors are determined with a typical statistical precision of
±0.01−0.02, which is comparable to the variations in C
i jexpected to result from the
∆φ evolution of UE contributions to the JER (see Sec. 6.1 below). No systematic variation of the correction factors with
∆φ beyond expected statistical fluctuations are observed. Thus, for the purposes of the measurements presented here, the C
i jare taken to be
∆φ independent, C
i j →C
i. The C
ivalues were obtained by constructing the full response matrix A
klwhich describes the distribution in reconstructed jet p
Tvalues (k) for a given truth p
T(l).
Then, C
i = Xm
C
im/
Xm
C
mi. The results presented in this note depend only on ratios of yields, so the C
ivalues do not a
ffect any of the final physics quantities. However, the C
iare used in the evaluation of systematic uncertainties.
6 Measurements
Two variables that characterize the azimuthal dependence of jet energy loss were derived from the
d
2N
jet/d p
Td∆ φ distribution and constitute the main physics result of this analysis. The first variable
is the jet v
2, v
jet2, which characterizes the fractional variation of the jet yield with
∆φ in a given p
Tbin.
φ
0 0.5 1 ∆ 1.5
〉 Tp/ Tp∆〈
-0.02 -0.01 0 0.01
0.02
< 60 GeV
p
T45 <
ATLAS preliminary simulation
φ
0 0.5 1 ∆ 1.5
〉 Tp/ Tp∆〈
-0.02 -0.01 0 0.01
0.02
< 80 GeV
p
T60 <
= 0.2
tR k anti- 10 - 20 %
φ
0 0.5 1 ∆ 1.5
〉 Tp/ Tp∆〈
-0.02 -0.01 0 0.01
0.02
< 110 GeV
p
T80 <
φ
0 0.5 1 ∆ 1.5
] Tp/ Tp∆[ σ
0.05 0.1 0.15 0.2
0.25
< 60 GeV
p
T45 <
ATLAS preliminary simulation
φ
0 0.5 1 ∆ 1.5
] Tp/ Tp∆[ σ
0.05 0.1 0.15 0.2
0.25
< 80 GeV
p
T60 <
= 0.2
tR k anti- 10 - 20 %
φ
0 0.5 1 ∆ 1.5
] Tp/ Tp∆[ σ
0.05 0.1 0.15 0.2
0.25
< 110 GeV
p
T80 <
Figure 4: Jet energy scale closure,
h∆p
Ti/p
truthT, (left) and fractional jet energy resolution σ[∆ p
T]/p
truthT(right) from MC (see text) as a function of
∆φ in the 10–20% centrality bin for the three lowest p
Tbins
included in this analysis. Error bars indicate statistical uncertainties only.
jet 2v
0 0.02 0.04
0.06 5 - 10 %
= 2.76 TeV sNN
Pb+Pb = 0.14 nb-1
t d
∫
L[GeV]
pT
50 100 150 200
jet 2v
0 0.02 0.04
0.06 30 - 40 %
10 - 20 % ATLAS preliminary
= 0.2
tR k anti-
[GeV]
pT
50 100 150 200
40 - 50 %
20 - 30 %
[GeV]
pT
50 100 150 200
50 - 60 %
Figure 5: v
jet2as a function of p
Tfor the centrality bins included in this analysis. The error bars on the points indicate statistical uncertainties while the shaded bands represent systematic uncertainties (see text).
Because the p
Tbin migration effects were found to be independent of
∆φ within the p
Trange of the measurement for the centrality bins included in this analysis, those corrections have no e
ffect on v
jet2, so the v
jet2 |measvalues can be corrected to v
jet2using Eq. (3) with the Res{
Ψ2}correction factors shown in Fig. 3. Figure 5 shows v
jet2values as a function of p
Tfor the six centrality bins included in this analy- sis. Statistically significant non-zero values are observed over the p
Trange 45 < p
T< 160 GeV for all centrality bins. Systematic uncertainties on the v
jet2values will be discussed below.
The second variable used to characterize the azimuthal dependence of jet suppression is the ratio of the jet yield in one
∆φ bin i to another j, R
∆φ, defined by
R
∆φ=d
2N
jetcorrd p
Td
∆φ
∆
φ
=∆φ
id
2N
jetcorrdp
Td∆ φ
∆φ
=∆φ
j. (5)
As the bin-by-bin unfolding correction factors are independent of
∆φ, they divide out in the ratio making R
∆φalso independent of the unfolding correction. The systematic uncertainties on R
∆φcan be derived from the uncertainties on v
jet2. For the results presented in this note, R
∆φis determined for
∆φ
jcorre- sponding to the interval closest to the minor axis of the ellipse in Fig. 1.
6.1 Systematic uncertainties
Systematic uncertainties in the results presented in Fig. 5 can arise from the
Ψ2resolution correction, from real
∆φ variations of the p
Tbin migration not accounted for by the assumed
∆φ-independent bin- by-bin correction factors, and from a
∆φ dependence of the true jet spectra not accounted for in the MC.
Each of these potential sources of systematic uncertainties will be discussed in the following paragraphs, and estimates of corresponding systematic uncertainties on v
jet2and ratios of d
2N
jet/d p
Td∆ φ in different
∆
φ bins will be provided.
Systematics on the
Ψ2resolution determination have been previously estimated [8] using multiple sub-event combinations that provide di
fferent estimates of Res{
Ψ2}. Since the Res{Ψ2}results here di
ffer from the previously determined values due to the different distribution of collision centralities obtained for Pb+Pb collisions producing jets, the results from that analysis are adapted for the measurements presented here. Specifically, the centrality dependence of the relative Res{
Ψ2}systematic uncertainty in [8], which varies between 1% and 5% over the range of centralities used in this note, was parameterized and taken to be the relative systematic uncertainty on the Res{
Ψ2}from this analysis.
The e
ffects of the expected
∆φ dependence of the JER on the p
Tbin migration not accounted for by assumed
∆φ independence of bin-by-bin correction factors were evaluated using data-driven studies of Pb+Pb UE fluctuations measured in the ATLAS calorimeters [4, 23]. The distribution of
ΣE
Tin regions corresponding to the size of an R
=0.2 jet were evaluated for di
fferent bins in
ΣE
FCalT. The standard de- viation of the
ΣE
Tat each centrality was found to accurately describe [4] the UE contribution to the JER measured using HIJING+PYTHIA MC for the same centrality. For this analysis, the variation of σ[Σ E
T] with the mean UE energy
hΣE
Tiwas parameterized. Then, the variation of the UE fluctuations with
∆φ for a given centrality was determined by evaluating σ[
ΣE
T] for the average UE energy density for that centrality,
hΣE
Ti|cent, plus a
∆φ-dependent modulation with amplitude given by the typical calorimeter v
2for that collision centrality, v
calo2 |cent:
σ[
ΣE
T](
∆φ)|
cent=σ[
ΣE
T]
hΣ
E
Ti+2v
calo2cos (2
∆φ)
cent
. (6) Using results from Ref. [4], the
∆φ dependence of σ[Σ E
T] was translated to a
∆φ dependence of the JER that was found to be compatible within statistical uncertainties with the results shown in Fig. 4. The impact of the
∆φ-dependent JER obtained using the method described here was evaluated by constructing a new response matrix A
i j(∆ φ) using
∆p
Tvalues scaled up by the ratio
∆
p
T0= ∆p
T×
σ[
∆p
T]/
∆p
T|∆φ σ[∆ p
T]/
∆p
T|∆φ
=0
, (7)
and setting p
recT 0 =p
truthT + ∆p
T0. Bin-by-bin corrections were extracted from the resulting response matrices for each,
∆φ and p
Tbin for each centrality. The resulting variation with
∆φ was parameterized using Eq. (1) to obtain a systematic uncertainty on v
jet2, δv
JER2( p
T)|
cent.
The potential impact of changes in the shape of the jet spectrum with
∆φ on the p
Tbin migration were evaluated using the results of the v
jet2measurements presented in this note. From Eq. (1) and (5) the ratio of in-plane and out-of-plane jet yields in a given p
Tbin for a purely cos (2
∆φ) modulation is given by R
∆φ (π/2)
=(1
+2v
jet2)/(1
−2v
jet2). The results in Fig. 5 were found to be well-described by a functional form c
1+c
2/
√p
Tthat produces values compatible with charged particle v
2measurements at low p
T. For each centrality, R
∆φ (π/2) was evaluated as a function of p
Tusing the parameterization of v
jet2. Then, the true spectrum entering the calculation of the response matrix and bin-by-bin correction factors was re-weighted to R
∆φ (π/2) to produce a new set of bin-by-bin corrections C
0ii. The ratio between the new and the default corrections, C
ii0/C
ii, at a given p
Trepresents the maximum di
fference in the effects of bin migration due to the
∆φ dependence of the shape of the jet spectrum due to the results in Fig. 5. That difference was translated to an uncertainty on v
jet2, δv
shape2( p
T)|
cent, by inverting C
ii0/C
ii=(1
+2δv
shape2)/(1
−2δv
shape2).
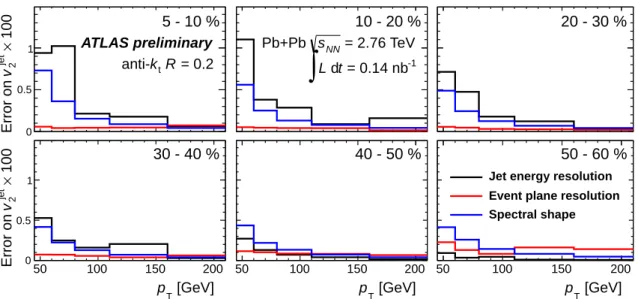
The separate components of the systematic uncertainty on v
jet2are shown in Fig. 6 as a function of
p
Tfor the different centrality bins included in the measurement. These components were combined in
quadrature to obtain the systematic uncertainty on each v
jet2measurement. All three sources of systematic
are highly correlated between p
Tand centrality bins. The systematic uncertainty on Res
{Ψ2}affects all
v
jet2measurements in the same centrality bin by the same fraction. The uncertainties due to JER and
100 × jet 2vError on 0
0.5 1
5 - 10 % ATLAS preliminary
= 0.2
tR k anti-
[GeV]
pT
50 100 150 200
100 × jet 2vError on 0
0.5 1
30 - 40 %
10 - 20 % = 2.76 TeV sNN
Pb+Pb
= 0.14 nb-1
t d
∫
L[GeV]
pT
50 100 150 200
40 - 50 %
20 - 30 %
[GeV]
pT
50 100 150 200
50 - 60 %
Jet energy resolution Event plane resolution Spectral shape
Figure 6: Contributions to the absolute systematic uncertainties on v
jet2as a function of p
Tfor the di
fferent centrality bins used in the analysis. The systematic uncertainties have been multiplied by 100 for ease of presentation.
spectrum shape cause all points in a given centrality bin to vary in the same direction but by di
fferent amounts. Similarly, the JER and shape uncertainties between different centrality bins are expected to vary in the same direction, but possibly by di
fferent amounts. The combined systematic uncertainties are shown in Fig. 5 with shaded bands. The systematic uncertainties are largest at low p
Twhere the impact of the UE fluctuations is the largest and where the growth of v
jet2with decreasing p
Twill have the largest impact on the spectrum shape.
6.2 Results
The inclusion of the systematic uncertainties does not change the conclusions drawn from the data in Fig. 5, namely that there is a significant non-zero v
jet2in all measured centrality bins and for p
Tvalues as large as 160 GeV. The central values for the highest p
Tbin indicate non-zero v
jet2values, but the statistical uncertainties do not preclude the v
jet2from decreasing. Generally, the jet v
jet2is observed to increase with decreasing p
T, but the systematic uncertainties at low p
Tfor the two most central bins, 5–10% and 10–20% are su
fficiently large that the growth at low p
Tis not significant.
Figure 7 shows the variation of v
jet2with the number of participants, N
part, for the four lowest p
Tbins included in the analysis. A clear variation of v
jet2with N
partis seen in the 60–80 GeV bin which
has the best statistical precision and the smallest systematic uncertainties. The results in the 45-60 GeV
and 80–110 GeV bin show similar variations, but those variations are not as significant due to the larger
uncertainties. The reduction in v
jet2in very central and peripheral collisions is not surprising. For very
central collisions, the eccentricity of the initial state is small and the possible
∆φ variation of path lengths
in the medium is limited. For peripheral collisions, there is little suppression in the jet yields [4] so there
cannot be large variations in jet yield as a function of
∆φ. The v
jet2values reported here are compatible
with high-p
Tcharged particle v
2measurements from the LHC [8, 9]. For example, the v
jet2values in
the 45–60 GeV and 60–80 GeV bins have values between 0.03 and 0.05 for 100 < N
part< 250. The
charged particle v
2values measured over 28 < p
T< 48 are between 0.02 and 0.05 for the same centrality
range [9]. Although a direct comparison of charged particle and jet v
2measurements is not possible due
to the lack of a unique relationship between jet and charged particle p
T, the high-p
Tv
2values obtained
jet 2v
0 0.02 0.04 0.06
< 60 GeV p
T45 <
= 2.76 TeV s
NNPb+Pb
= 0.14 nb
-1t d
∫ L
〉 Npart
0 100 200 300
〈jet 2v
0 0.02 0.04 0.06
< 110 GeV p
T80 <
< 80 GeV p
T60 <
ATLAS preliminary = 0.2
t
R k anti-
〉 Npart
0 100 200 300
〈< 160 GeV p
T110 <
Figure 7: Variation of v
jet2with number of participants, N
part, in four bins of jet p
T. The error bars indicate statistical uncertainties and the shaded bands indicate systematic uncertainties.
from the charged particle and jet measurements are in good agreement.
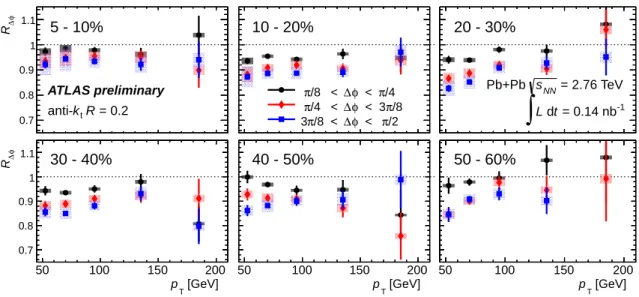
R
∆φwas evaluated for
∆φ bins π/8 <
∆φ < π/4, π/4 <
∆φ < 3π/8, and 3π/8 <
∆φ < π/2, relative to the 0 <
∆φ < π/8 bin. Results are shown in Fig. 8 as a function of p
Tfor six centrality bins. A clear reduction of the jet yield with increasing
∆φ is observed, consistent with results presented above. For example, in the 20–30% and 30–40% centrality bin, the jet yield in the 3π/8 <
∆φ < π/2 bin is 15–18%
lower than the jet yield the 0 <
∆φ < π/8 bin for the lowest two p
Tbins included in this analysis.
7 Conclusions
This note has presented results of ATLAS measurements of the variation of jet yields in
√s
NN =2.76 TeV Pb
+Pb collisions as a function of
∆φ the azimuthal angle of the jet with respect to the elliptic event plane.
The data were obtained from a total Pb+Pb integrated luminosity of 0.14 nb
−1recorded by ATLAS in
2011. The measurements were obtained for anti-k
t-reconstructed jets with distance parameter R
=0.2 in
six centrality bins spanning the range 5–60%. Results were presented for jet v
2and for ratios of jet yields
between different
∆φ bins for five bins in jet p
Tspanning the range 45 < p
T< 210 GeV. A significant
∆φ
variation in the jet yield is observed for all centrality bins and all p
Tbins except for the 160–210 GeV p
Tbin where the statistical uncertainties are large. The v
jet2values vary at most weakly with p
Tat high p
Tbut
tend to rise at low p
Texcept in the two most peripheral bins where the systematic uncertainties are too
large to allow a conclusion. For intermediate centrality bins with the largest initial-state eccentricities,
v
2varies from
∼0.045 in the 45–60 GeV p
Tbin to
∼0.025 in the 110–160 GeV bin. The observed
azimuthal variation of jet yields amounts to as much as a 15% reduction of jet yields between in-plane
(0 <
∆φ < π/8) and out-of-plane (3π/8 <
∆φ < π/2)
∆φ bins. Such large variations are seen only at
lower p
T. For p
T> 100 GeV, the relative di
fference between in-plane and out-of-plane yields is
.10%.
φ∆R
0.7 0.8 0.9 1
1.1 5 - 10%
ATLAS preliminary = 0.2
tR k anti-
[GeV]
pT
50 100 150 200
φ∆R
0.7 0.8 0.9 1
1.1 30 - 40%
10 - 20%
π/4 <
φ
∆ /8 <
π
π/8 < 3 φ
∆ /4 <
π
π/2 <
φ
∆ /8 <
π 3
[GeV]
pT
50 100 150 200
40 - 50%
20 - 30%
= 2.76 TeV sNN
Pb+Pb
= 0.14 nb-1
t d
∫
L[GeV]
pT
50 100 150 200
50 - 60%
Figure 8: R
∆φas a function of p
Tfor three bins of
∆φ evaluated relative to the 0 <
∆φ < π/8 bin for the di
fferent centrality bins included in this analysis. Error bars show statistical uncertainties, shaded boxes indicate systematic uncertainties.
References
[1] A. Majumder and M. Van Leeuwen, The Theory and Phenomenology of Perturbative QCD Based Jet Quenching, Prog. Part. Nucl. Phys.
A66(2011) 41–92,
arXiv:1002.2206.[2] ATLAS Collaboration, Observation of a Centrality-Dependent Dijet Asymmetry in Lead-Lead Collisions at
√s
NN =2.76 TeV with the ATLAS Detector at the LHC, Phys. Rev. Lett.
105(2010) 252303,
arXiv:1011.6182.[3] CMS Collaboration, Observation and studies of jet quenching in PbPb collisions at
√s
NN=2.76 TeV., Phys. Rev. C
84(2011) 024906,
1102.1957.[4] ATLAS Collaboration, Measurement of the jet radius and transverse momentum dependence of inclusive jet suppression in lead-lead collisions at
√s
NN=2.76 TeV with the ATLAS detector,
arXiv:1208.1967.[5] M. Gyulassy, I. Vitev, and X. Wang, High p
Tazimuthal asymmetry in non-central A
+A at RHIC, Phys. Rev. Lett.
86(2001) 2537–2540,
arXiv:nucl-th/0012092 [nucl-th].[6] PHENIX Collaboration, S. Adler et al., A Detailed Study of High-p
TNeutral Pion Suppression and Azimuthal Anisotropy in Au
+Au Collisions at
√s
NN =200-GeV, Phys. Rev.
C76(2007) 034904,
nucl-ex/0611007.[7] PHENIX Collaboration, A. Adare et al., Azimuthal anisotropy of neutral pion production in Au
+Au collisions at
√s
NN =200 GeV: Path-length dependence of jet quenching and the role of initial geometry, Phys. Rev. Lett.
105(2010) 142301,
arXiv:1006.3740.[8] ATLAS Collaboration, Measurement of the pseudorapidity and transverse momentum dependence of the elliptic flow of charged particles in lead-lead collisions at
√s
NN=2.76 TeV with the ATLAS
detector, Phys. Lett.
B707(2012) 330–348,
arXiv:1108.6018.[9] CMS Collaboration, Azimuthal anisotropy of charged particles at high transverse momenta in PbPb collisions at
√s
NN =2.76 TeV,
arXiv:1204.1850.[10] W. Horowitz and M. Gyulassy, Quenching and Tomography from RHIC to LHC, J. Phys. G
G38(2011) 124114,
arXiv:1107.2136 [hep-ph].[11] ATLAS Collaboration, The ATLAS Experiment at the CERN Large Hadron Collider, JINST
3(2008) S08003.
[12] ATLAS Collaboration, The ATLAS Inner Detector commissioning and calibration, Eur. Phys. J.
C70
![Figure 4: Jet energy scale closure, h ∆ p T i/ p truth T , (left) and fractional jet energy resolution σ[∆ p T ]/p truth T (right) from MC (see text) as a function of ∆ φ in the 10–20% centrality bin for the three lowest p T bins included in this analysis](https://thumb-eu.123doks.com/thumbv2/1library_info/4027850.1542228/9.892.160.734.309.821/figure-closure-fractional-resolution-function-centrality-included-analysis.webp)