ATLAS-CONF-2013-106 04November2013
ATLAS NOTE
ATLAS-CONF-2013-106
November 4, 2013
Measurement of the W → µν charge asymmetry and its centrality dependence in Pb + Pb collisions at √
s
NN= 2.76 TeV with the ATLAS detector
The ATLAS Collaboration
Abstract
A study of
Wboson production via the semi-leptonic decay channel in lead-lead colli- sions at
√sNN =
2.76 TeV is presented using data corresponding to an integrated luminosity of 0.14 nb
−1collected with the ATLAS detector at the Large Hadron Collider in 2011. The production rates and muon charge asymmetry are measured in a fiducial kinematic range as a function of the average number of participating nucleons
hNpartiand absolute pseudorapid- ity of the decay muon. The results are compared to predictions based on modified leading- order and next-to-leading-order calculations with the MRSTLO* and MSTW2008NLO par- ton distribution functions. This measurement provides information on the binary scaling of
Wboson production in multi-nucleon systems as well as possible modifications to the parton distribution functions.
c
Copyright 2013 CERN for the benefit of the ATLAS Collaboration.
Reproduction of this article or parts of it is allowed as specified in the CC-BY-3.0 license.
1 Introduction
Extensive studies of particle production in the high-density medium created in ultrarelativistic heavy ion collisions have previously been carried out at the Relativistic Heavy-Ion Collider (RHIC) at Brookhaven National Laboratory [1–4] and have been extended to higher beam energies at the Large Hadron Collider (LHC) at CERN [5, 6]. These collisions provide direct access to a phase of nuclear matter at extremely high temperature and baryochemical potential where the relevant degrees of freedom are quarks and glu- ons [7–11]. Under these conditions, the path lengths of colour-charge carriers are substantially modified due to interactions with the strongly-coupled medium. This has been observed in measurements of high transverse momentum (
pT) charged-hadron yields [12, 13], as well as in measurements of dijets with asymmetric transverse energies (E
T) [14, 15].
In order to obtain a better understanding of the underlying mechanisms driving partonic energy loss, it is useful to exploit the properties of electroweak probes which are not expected to be modified by the medium. At sub-TeV energies, photons have served as viable candidates [16]. However at higher energies, heavy gauge bosons (W
±and
Z) are also produced in relatively high abundance. These particlesserve as exceptional standard-candles that may be used to gauge the extent of partonic energy-loss in the medium. This potential has already been realized in previous publications by the ATLAS [17] and CMS [18–20] Collaborations, which have shown that electroweak boson production rates scale with the number of binary collisions.
However, electroweak bosons may be utilized for more than just benchmarking colour-charge inter- actions to complement medium property measurements. The leading-order process for
Wboson produc- tion is via the
ud(du) → W+(−)channel. This implies the rapidity of the
Wboson is a function of the momentum fraction
xof the incoming partons and hence provides direct sensitivity to parton distribution functions (PDFs) [21].
The simplest method to obtain information on PDFs is by measuring the charge asymmetry in the pseudorapidity distribution of charged leptons produced from
Wbosons. This has been demonstrated in measurements at the Tevatron in
pp¯ collisions [22] as well as at the LHC in
ppcollisions [19, 24, 25]. It is defined in terms of the di
fferential cross-sections for
W →µν production
dσW±→µ±/dη
µ:
Aµ = dσW+→µ+
/dη
µ−dσW−→µ−/dη
µdσW+→µ+
/dη
µ+dσW−→µ−/dη
µ(1) where η
µis the pseudorapidity
1of the muon and the cross-sections include the event kinematical cuts used to select for
W →µν events. This observable has been utilzed in global analyses of free proton PDFs [26, 27]. Such measurements in multi-nucleon systems would be useful to study nuclear PDFs but currently suffer from large uncertainties due to limited experimental data [28–32].
The charge asymmetry in lead-lead
2(Pb
+Pb) collisions is expected to be di
fferent from the asym- metry obtained from
ppcollisions. In
ppcollisions, the overall production rate of
W+bosons is larger than for
W−bosons as a result of a higher average momentum fraction carried by the
uquark relative to the
dquark [33, 34]. In Pb
+Pb collisions,
ppinteractions make up only
≈15% of the total number of nucleon-nucleon interactions, whereas additional interactions from
nnand
np+ pncontribute 37% and 48% to the total
Wboson cross-section, respectively. Consequently, a marked difference is expected in the muon charge asymmetry between Pb
+Pb and
ppcollisions due to the di
fference in the number of
udand
duinteractions.
1The ATLAS detector uses a right-handed coordinate system with the nominal Pb+Pb interaction point at its centre. The positive z-axis is along the beam pipe. The x-axis points from the interaction point toward the centre of the ring and the y-axis points upward. Cylindrical coordinates (r,φ) are used in the transverse plane withφbeing the azimuthal angle around the beam pipe. The pseudorapidity is defined in terms of the polar angleθasη=−ln(tanθ/2).
2In the heavy ion data-taking periods at the LHC, the lead-208 isotope was used.
Muon asymmetry measurements in heavy ion collisions at
√sNN =
2.76 TeV have been previously reported by the CMS Collaboration [19]. The measurement presented here uses a dataset approximately 20 times larger than the CMS result, corresponding to an integrated luminosity of 0.14 nb
−1. A brief overview of the ATLAS detector and trigger is given in Sect. 2. A description of the simulated event samples used in the analysis is provided in Sect. 3. The criteria for selecting Pb
+Pb events is presented in Sect. 4. This is followed by a description of muon reconstruction and signal candidate selection in Sect. 5. The signal and background estimation is presented in Sect. 6, with a discussion of the efficiency corrections in Sect. 7. The systematic uncertainties are described in Sect. 8, and the
Wboson production rates measured as a function of event centrality and muon absolute pseudorapidity are discussed in Sect.
9. These are compared to theoretical predictions at leading-order (LO) and next-to-leading-order (NLO).
A di
fferential measurement of the muon charge asymmetry as a function of the muon pseudorapidity is also presented in this section. The conclusion provides a brief summary of the results.
2 ATLAS detector
The ATLAS detector [35] is one of four large detectors located around the LHC ring. The Inner Detector (ID) is comprised of a precision tracking system that covers a pseudorapidity range
|η|< 2.5. It consists of silicon pixels, silicon strips, and straw-tube chambers (Transition Radiation Tracker or TRT) operating within an approximately 2 T axial magnetic field supplied by a superconducting solenoid. However, due to the high occupancy in heavy ion events, the TRT was not active during the Pb+Pb data-taking period and is not used in this analysis.
Highly-segmented electromagnetic and hadronic calorimeters covering
|η|< 4.9 are located outside the solenoid. The electromagnetic calorimetery is provided by liquid-argon (LAr) technology and is divided into one barrel (|η| < 1.475) and two end-cap (1.375 <
|η|< 3.2, EMEC) components. The hadronic calorimeter is based on two di
fferent detector technologies: scintillator tiles covering the barrel
|η|
< 1.0 and extended barrels 0.8 <
|η|< 1.7 and LAr hadronic end-cap calorimeters (HEC) located behind the EMEC in the region 1.5 <
|η|< 3.2. A forward calorimeter (FCal) using LAr as the active material is located in the region 3.1 <
|η|< 4.9. In addition, the Minimum Bias Trigger Scintillator (MBTS) is installed on the inner face of the end-cap calorimeter cryostats and is organized into two disks on each side of the ATLAS detector, covering the pseudorapidity regions 2.09 <
|η|< 2.82 and 2.82 <
|η|< 3.84 [48].
The outermost subsystem of the detector is composed of a muon spectrometer (MS) that includes a barrel region (|η| < 1.05) and an end-cap region (1.05 <
|η|< 2.7). Poorly segmented areas are located at η
≈0.0 and in the barrel-end-cap transition region at 1.0 <
|η|< 1.3. Muon track momenta and reconstruction in the MS are determined by the use of monitored drift tubes (MDTs), cathode strip chambers (CSCs), and three sets of air-core superconducting toroids with coils arranged in an eightfold symmetry that provide on average 0.5 T in the azimuthal plane.
The ATLAS detector also includes a trigger system that selects events based on rapid identification
of muons, electrons, photons, tau leptons, jets,
Bmesons, and global event signatures such as missing
and summed transverse energy [36]. The trigger selection for muons is performed in three steps. Signals
from the fast-response resistive plate chambers (RPCs) and thin gap chambers (TGCs) in the MS are
processed at level one (L1) up to
|η|< 2.4. The detector position information from L1 is then passed
to the software-based High Level Trigger (HLT), which is subdivided into the Level 2 (L2) trigger and
Event Filter (EF). The HLT reconstructs muon tracks in the viscinity of the detector region reported
by the L1 trigger. The L2 trigger performs a fast reconstruction of muons using a simple algorithm,
which is then further refined at the EF by utilising the full detector information from the o
ffline muon
reconstruction software [37].
3 Simulated Event Samples
Simulated event samples were used for correcting the signal yield for detector e
ffects, making compar- isons of the results to theoretical expectations, and for estimating most of the background contamination.
The simulated event samples for both the signal and background processes are summarised in Table 1.
The detector was simulated using GEANT4 [38]. The signal sample used to correct the signal yield and most of the background samples were embedded into minimum bias events from the data. The heavy ion environment in the
Z →µ
+µ
−sample was emulated using a MC program (HIJING [39]) specif- ically tuned for modeling the soft interactions, nuclear shadowing of PDFs, and jet interactions with high-density matter.
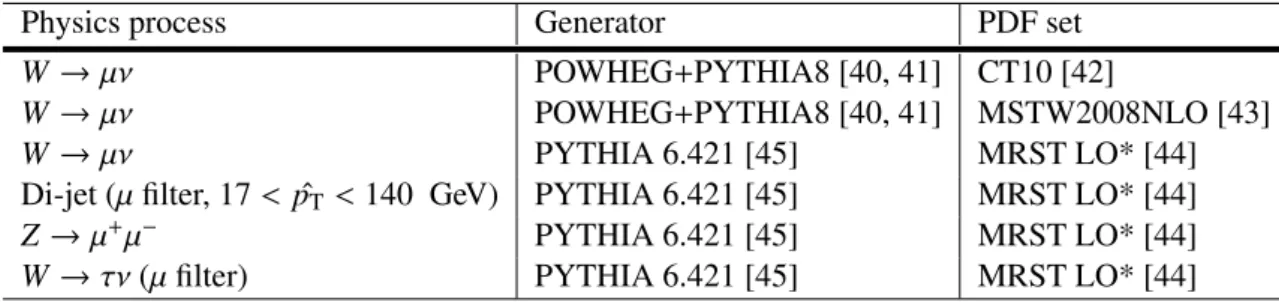
Table 1: Signal and background simulated event samples used in this analysis. The variable ˆ
pTis the average
pTof the two-outgoing partons involved in the hard-scattering process evaluated before modifi- cations from initial- and final-state radiation. Details for each sample are given in the text.
Physics process Generator PDF set
W→
µν POWHEG
+PYTHIA8 [40, 41] CT10 [42]
W→
µν POWHEG+PYTHIA8 [40, 41] MSTW2008NLO [43]
W→
µν PYTHIA 6.421 [45] MRST LO* [44]
Di-jet (µ filter, 17 <
pˆ
T< 140 GeV) PYTHIA 6.421 [45] MRST LO* [44]
Z→
µ
+µ
−PYTHIA 6.421 [45] MRST LO* [44]
W→
τν (µ filter) PYTHIA 6.421 [45] MRST LO* [44]
The POWHEG [40] samples were interfaced to PYTHIA8 [41] for modelling parton showering and fragmentation processes. These include the signal sample used to correct the signal yields and an addi- tional sample used for making theoretical comparisons with the data. The former employed the CT10 [42] PDF set whereas the latter used MSTW2008NLO [43]. In addition, a signal sample generated with PYTHIA6 with the MRST LO* [44] PDF set was also included in this analysis to provide another theo- retical comparison. In order to best model a Pb+Pb collision, the signal process in each of the samples was generated separately for
pp,nn, andnp(pn) beams In each inclusive signal sample, the signal pro-cess produced from each beam-type was combined and weighted according to the bi-nucleon interaction frequency in a Pb+Pb collision (see Sect. 1).
The background samples were generated with PYTHIA6 [45] and also used the MRST LO* PDF set.
Background from heavy flavour decays was modelled using muon-filtered simulated di-jet samples with initial energies of the two partons involved in the hard-scattering process ranging from 17
−140 GeV.
The
W→τν sample also used a muon filter and tau decays were treated using TAUOLA [46].
4 Collision event selection
Lead-lead events were selected by imposing basic requirements on the beam conditions and perfor- mance of each sub-detector. A hit in both sides of the MBTS system with a timing coincidence < 3 ns was required for each collision. In addition, each collision was required to have a reconstructed vertex compatible with the beam-spot position and with at least three associated tracks greater than 0.5 GeV.
This resulted in a sample size of 1.03
×10
9Pb
+Pb events [47] (designated by
Neventshereafter).
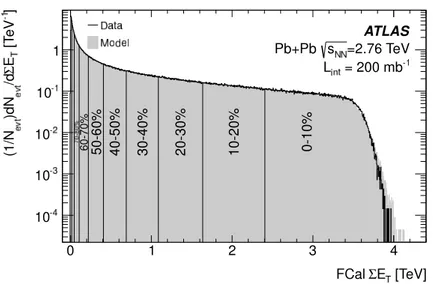
Each event was categorized into a specific centrality class. The event centrality is expressed as a
percentile determined by the fraction of the total inelastic non-Coulomb Pb
+Pb cross-section sampled in
Figure 1: Measured FCal
PET
from 2011 Pb+Pb data (black) compared with a Glauber-derived model calculation [50].
a collision. This reflects the overlap volume between the colliding nuclei and allows for systematically selecting various collision geometries in the initial state.
Experimentally, the event centrality in ATLAS is measured using the scalar sum of the event-by-event total energy deposition in the FCal (
PET
), calibrated to the electromagnetic energy scale [54]. This is shown in Fig. 1 for the 2011 minimum bias data compared to a Glauber-derived model calculation [50].
The FCal
PET
is closely related to the mean number of inelastically-interacting nucleons
hNpartiand mean number of binary collisions
hNcolliusing the Glauber formalism (see Ref. [51]).
hNpartiand
hNcolliare monotonic functions of the impact parameter and can be mapped to experimental quantities following the procedure from Ref. [50].
hNcollican also be expressed as the product of the average nuclear thickness function
hTAAiand the total inelastic
ppcross-section of 64
±5 mb at
√sNN =
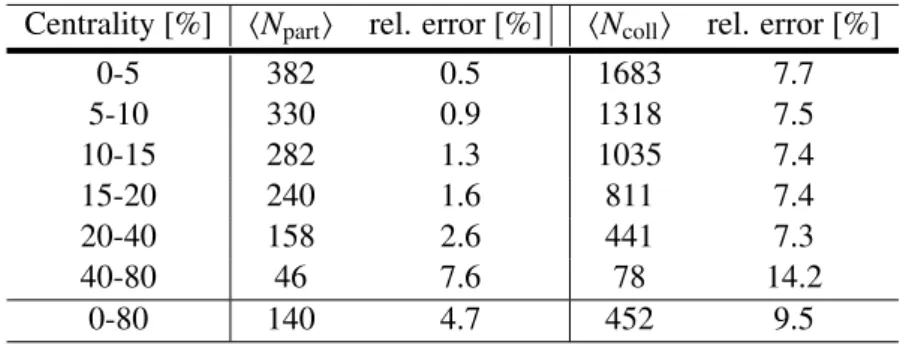
2.76 TeV [49]. For this analysis, events were separated into six centrality classes: 0-5% (most central), 5-10%, 10-15%, 15-20%, 20-40%, and 40-80%. The 80-100% class su
ffers from high experimental uncertainties in
hNcolliand low statistics. Therefore, it was not considered in this analysis. Table 2 presents the
hNpartiand
hNcollifor each centrality class along with the relative systematic uncertainties (see Sect. 8). For the same centrality class, the uncertainty in
hNpartiis less than
hNcolli, and this is because a single participant can interactinelastically with several nucleons in a collision.
Events containing the signature of a
Wboson were selected using single muon triggers with a require- ment on the minimum transverse momentum of 10 GeV. Two types of single muon triggers were used in this analysis: one that required a muon in coincidence with a total event transverse energy > 10 GeV and another which required a muon in coincidence with a neutral particle at
|η|> 8.3 [23]. This provided good e
fficiency for events from all centrality classes. E
fficiencies for these triggers ranged from 89.3 to 99.6%, depending on the pseudorapidity of the muon and centrality class of the event from which the muon originated.
Since neutrinos from
Wboson decays cannot be detected directly, previous
Wboson analyses in
ATLAS [24] have used the event momentum imbalance in the plane transverse to the beam axis
EmissTas a proxy for the true neutrino
pT. Traditionally, these analyses have reconstructed the
EmissTusing
contributions from energy deposits in the calorimeters and muons reconstructed in the MS [53]. However,
in heavy ion collisions, poor performance in the
EmissTresolution has been observed in the most central
events. Therefore, this analysis employs a track-based calculation that shows significant improvement
Table 2: Average number of participating nucleons
hNpartiand binary collisions
hNcollifor the centrality classes used in this analysis alongside the relative uncertainties.
Centrality [%]
hNpartirel. error [%]
hNcollirel. error [%]
0-5 382 0.5 1683 7.7
5-10 330 0.9 1318 7.5
10-15 282 1.3 1035 7.4
15-20 240 1.6 811 7.4
20-40 158 2.6 441 7.3
40-80 46 7.6 78 14.2
0-80 140 4.7 452 9.5
over the calorimeter-based method. The event momentum imbalance using this approach is defined as the negative vector sum of all charged ID tracks in the event with
pT> 3 GeV :
pmiss=
ntrks
X
i=1
pmissi =−(p1+p2+
...p
ntrks) (2)
where the magnitude of the transverse component of this vector is given by
pmissT = q(
pmissx)
2+(p
missy)
2.
5 Muon reconstruction and signal candidate selection
Muon reconstruction in ATLAS consists of separate tracking in the ID and MS. In this analysis, the tracks reconstructed in each subsystem are combined using a χ
2-minimisation procedure [55]. These combined muons were required to satisfy selection criteria that closely follow those used in the heavy ion
Zboson analysis reported in Ref. [17]. Additional selection criteria specific to
Wbosons are discussed below.
Decays-in-flight from pions and kaons contribute a small background fraction in this analysis. These decays usually take place within the ID and were reduced by requiring the di
fference between the ID and MS muon
pTmeasurements (corrected for the mean energy loss due to interactions with the material between the ID and MS) to be less than 50% of the
pTmeasured in the ID. Moreover, muons from pions and kaons usually exhibit sharp changes in the muon track trajectory at the point of the decay. Therefore, a selection on the ID scattering angle that helps to identify changes in the trajectory of the muon that are much greater than the average change due to multiple scattering was also applied. This follows the method from Ref. [56].
A track-based isolation of the muon was imposed by requiring the sum of the transverse momenta of ID tracks
PpIDT
with
pT> 3 GeV within a cone of radius
∆R< 0.2 around the direction of the muon to be less than 10% of the muon
pT(excluding the muon
pTitself). An evaluation of the background rejection and signal efficiency for this isolation requirement was performed as a function of centrality.
Based on Monte Carlo (MC) simulation, the isolation requirement was estimated to reject 50
−71% of muons originating from heavy flavour decays, depending on the centrality class, while retaining 95-99%
of signal candidates.
The transverse momentum of signal muon candidates was required to be at least 25 GeV and the event missing momentum
pmissT> 25 GeV. A lower limit on the transverse mass
mT = q2p
µTpmissT(1
−cos
∆φ
µ,pmissT
)
was also imposed by requiring
mT> 40 GeV to guard against background events with high muon
pTor
large
pmissT.
The background contribution from
Zboson decays was rejected by locating events containing high mass di-muon pairs. Di-muon pairs were considered to be consistent with the mass of the
Zboson if they were of opposite-charge and addition of their four-vectors resulted in an invariant mass > 66 GeV. In this case, both muons were rejected. Only one event was found in the data with two muons passing all signal selection requirements. The rejection power of this procedure was studied in the MC and found to veto 86% of single muons produced from a
Zboson while retaining over 99% of
Wboson candidates.
The remaining 14% of single muons that survive this cut is attributed to instances where the second muon from the
Zboson decay is produced outside of the ATLAS acceptance undetected (see Sect. 6).
After applying all selection criteria, 3348
W+bosons and 3185
W−bosons candidates were observed before background-subtraction and efficiency correction.
6 W
±signal yield and background estimation
The main background contributions to the
W →µν channel arise from heavy flavour decays in multijet events (“QCD processes”) and from electroweak processes. The latter includes
W →τν events where the tau decays into a muon and a neutrino and
Z →µ
+µ
−events where one muon from the
Zboson is emitted outside of the geometrical acceptance, thereby producing spurious
pmissT. Other sources of background that were considered but found to be negligible include the
Z →ττ channel, where one tau decays into a muon, and the
t¯tchannel where one top quark decays semi-leptonically into a muon.
The total number of background events from QCD processes was estimated by scaling the QCD muon
pTspectra from the MC to the number of binary collisions observed in the data for a given centrality class. This technique is illustrated in Fig. 2. The disagreement with the data is attributed to jet energy- loss in the medium, and to take this into consideration the MC distribution was re-scaled to the data in a background-enriched control region selected in the range 10 <
pT< 20 GeV. As a cross-check, the QCD background distribution was compared to an anti-isolated control muon sample from the data, and the shapes were found to agree well. Using this procedure, the number of expected background events was determined by extrapolating the MC from the control region to a signal region at
pT> 25 GeV. The background fraction was found to be on average 3.7% of the total number of
W±boson candidates over all η
µ, charge, and centrality classes. It was consistent between different charges, whereas variations as a function of η
µand centrality were at most 50%. This is included in the systematic uncertainty (see Sect.
8).
The number of residual
Z →µ
+µ
−events was determined by calculating the fraction of single muons from
Zboson decays surviving final selection in the MC and subsequently applying this fraction to the actual number of
Z →µ
+µ
−events observed in the data [17] for each centrality and η
µinterval.
This resulted in a background estimation of 2.4% relative to the total number of
Wboson candidates, ranging from 1.0% at mid-rapidity to 3.2% in the forward region. Background events originating from tau decays were estimated by first using the MC to calculate the fraction of tauonic muons in the geometrical acceptance that pass final selection criteria. This fraction was then multiplied by the branching ratio for
W →τν and the ratio between the probability for a
Wboson to decay via the tau channel and a
Wboson to decay via the muon channel. Finally, the product with the inverse of the fraction of
W →µν events passing final selection criteria was calculated, resulting in the fraction of
W →τν events surviving final selection relative to the number of signal candidates. This was estimated to be at the level of 1.5% in each pseudorapidity and centrality interval. Fluctuations between bins were at the level of 1.3-1.8%. The expected background from all sources amounts to 7.6% of the total number of
Wboson candidates.
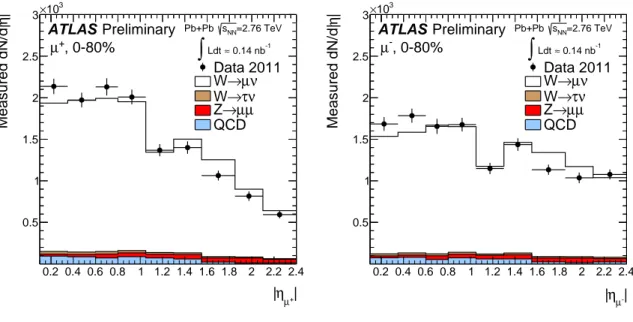
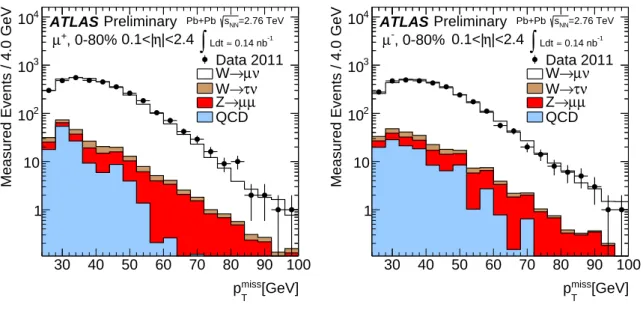
Figures 3-6 show the absolute pseudorapidity, transverse momentum, missing transverse momentum,
and transverse mass distributions for positive and negative muons at reconstruction level after full event
selection. Data distributions are compared to the background and signal templates obtained from MC
simulation. The background distributions are normalized to the expected number of events, while the
[GeV]
µ
pT
20 40 60 80 100 120
Muons/[GeV]
10-1
1 10 102
103
104
105
Data 2011
〉) Ncoll
〈 QCD MC (Scaled to QCD MC (Re-scaled to ctrl region) 0.14 nb-1
≈ Ldt
∫
= 2.76 TeV sNN
Pb+Pb
ATLAS Preliminary
Figure 2: Muon transverse momentum distribution before applying final selection criteria (black points) along with their
pTdistribution from QCD muons in the MC scaled to
hNcolli(grey histogram) and re-scaled to match the data in a control region 10 <
pT< 20 GeV (light blue histogram).
signal MC is normalized to the number of background-subtracted events in the data. This was performed di
fferentially for each charge, absolute pseudorapidity, and centrality class, which were added together to obtain the integrated yields. Tables 3 and 4 present a summary of the number of observed (i.e. measured) and background events in each centrality and absolute pseudorapidity class for both
W+and
W−bosons.
Table 3: Summary of observed number of events and expected background counts for positive and negative muons for each
hNparti. The kinematic requirements are 0.1<
|ηµ|< 2.4,
pµT> 25 GeV,
pmissT
> 25 GeV, and
mT> 40 GeV.
µ
+µ
−Centrality[%]
hNpartiObserved Exp. background Observed Exp. background
0-5 382 675 65 645 62
5-10 330 493 38 534 38
10-15 282 472 41 453 39
15-20 240 401 24 355 22
20-40 158 945 62 869 58
40-80 46 362 26 329 23
+| ηµ
|
0.2 0.4 0.6 0.8 1 1.2 1.4 1.6 1.8 2 2.2 2.4
|ηMeasured dN/d|
0.5 1 1.5 2 2.5 3
103
×
ATLAS Preliminary
Data 2011 ν µ
→ W→τν W→µµ Z QCD , 0-80%
µ+
=2.76 TeV sNN
Pb+Pb 0.14 nb-1
≈ Ldt
∫
|
µ-
η
|
0.2 0.4 0.6 0.8 1 1.2 1.4 1.6 1.8 2 2.2 2.4
|ηMeasured dN/d|
0.5 1 1.5 2 2.5 3
103
×
ATLAS Preliminary
Data 2011 ν µ
→ W→τν W→µµ Z QCD , 0-80%
µ-
=2.76 TeV sNN
Pb+Pb 0.14 nb-1
≈ Ldt
∫
Figure 3: Measured absolute pseudorapidity distributions for
W+ →µ
+ν (left) and
W− →µ
−ν ¯ (right) candidates after final selection. The number of QCD and electroweak background events are normal- ized according to their expected number of events. The
W →µν MC is normalized to the number of background-subtracted events in the data. All distributions are at reconstruction level.
[GeV]
T µ+
p
30 40 50 60 70 80 90 100
Measured Muons / 2.0 GeV
1 10 102
103
104 ATLAS Preliminary
Data 2011 ν µ
→ W→τν W→µµ Z QCD , 0-80%,
µ+ 0.1<|η|<2.4
=2.76 TeV sNN
Pb+Pb 0.14 nb-1
≈ Ldt
∫
[GeV]
T µ-
p
30 40 50 60 70 80 90 100
Measured Muons / 2.0 GeV
1 10 102
103
104 ATLAS Preliminary
Data 2011 ν µ
→ W→τν W→µµ Z QCD , 0-80%
µ- 0.1<|η|<2.4
=2.76 TeV sNN
Pb+Pb 0.14 nb-1
≈ Ldt
∫
Figure 4: Measured transverse momentum distributions for
W+ →µ
+ν (left) and
W− →µ
−ν ¯ (right)
candidates after final selection. The number of QCD and electroweak background events are normal-
ized according to their expected number of events. The
W →µν MC is normalized to the number of
background-subtracted events in the data. All distributions are at reconstruction level.
[GeV]
miss
pT
30 40 50 60 70 80 90 100
Measured Events / 4.0 GeV
1 10 102
103
104 ATLAS Preliminary
Data 2011 ν µ
→ W→τν W→µµ Z QCD , 0-80%
µ+ 0.1<|η|<2.4
=2.76 TeV sNN
Pb+Pb 0.14 nb-1
≈ Ldt
∫
[GeV]
miss
pT
30 40 50 60 70 80 90 100
Measured Events / 4.0 GeV
1 10 102
103
104 ATLAS Preliminary
Data 2011 ν µ
→ W→τν W→µµ Z QCD , 0-80%
µ- 0.1<|η|<2.4
=2.76 TeV sNN
Pb+Pb 0.14 nb-1
≈ Ldt
∫
Figure 5: Measured transverse missing momentum distributions for
W+ →µ
+ν (left) and
W− →µ
−ν ¯ (right) candidates after final selection. The number of QCD and electroweak background events are normalized according to their expected number of events. The
W→µν MC is normalized to the number of background-subtracted events in the data. All distributions are at reconstruction level.
[GeV]
mT
40 60 80 100 120 140 160 180 200
Measured Muons / 4.0 GeV
1 10 102
103
104 ATLAS Preliminary
Data 2011 ν µ
→ W→τν W→µµ Z QCD , 0-80%
µ+ 0.1<|η|<2.4
=2.76 TeV sNN
Pb+Pb 0.14 nb-1
≈ Ldt
∫
[GeV]
mT
40 60 80 100 120 140 160 180 200
Measured Muons / 4.0 GeV
1 10 102
103
104 ATLAS Preliminary
Data 2011 ν µ
→ W→τν W→µµ Z QCD , 0-80%
µ- 0.1<|η|<2.4
=2.76 TeV sNN
Pb+Pb 0.14 nb-1
≈ Ldt
∫
Figure 6: Measured transverse mass distributions for
W+→µ
+ν (left) and
W−→µ
−ν ¯ (right) candidates
after final selection. The number of QCD and electroweak background events are normalized according
to their expected number of events. The
W →µν MC is normalized to the number of background-
subtracted events in the data. All distributions are at reconstruction level.
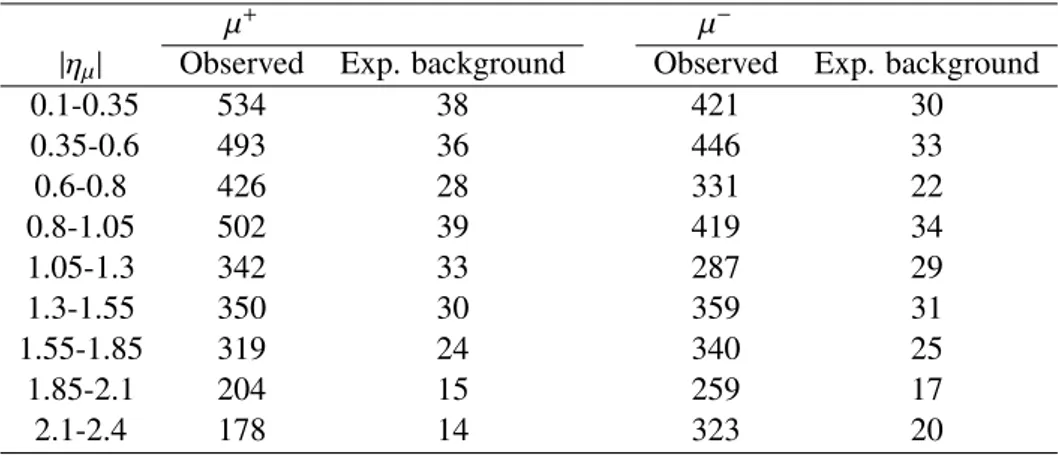
Table 4: Summary of observed number of events and expected background counts for positive and neg- ative muons in bins of
|ηµ|. The kinematic requirements are pµT> 25 GeV,
pmissT> 25 GeV, and
mT> 40 GeV.
µ
+µ
−|ηµ|
Observed Exp. background Observed Exp. background
0.1-0.35 534 38 421 30
0.35-0.6 493 36 446 33
0.6-0.8 426 28 331 22
0.8-1.05 502 39 419 34
1.05-1.3 342 33 287 29
1.3-1.55 350 30 359 31
1.55-1.85 319 24 340 25
1.85-2.1 204 15 259 17
2.1-2.4 178 14 323 20
7 E ffi ciency corrections
The
Wboson production yields were measured in a fiducial volume defined by:
pµT
> 25 GeV, 0.1 <
|ηµ|< 2.4,
pνT> 25 GeV,
mT> 40 GeV.
No attempt was made to extrapolate the yields to the full acceptance region in order to avoid introducing model-dependent uncertainties in the production rate. The crack-region of the detector
|ηµ|< 0.1 was excluded and the most forward bin boundary determined based on the acceptance of the muon trigger chambers.
The efficiency correction factor
CW±is defined by the following ratio:
CW± = NWrec NWgen,f id
(3) where
NWrecrepresents the number of
W →µν events reconstructed in the fiducial region and passing final selection cuts, and
NWgen,f idsignifies the number of
W →µν events in the same phase space at generator level. This was calculated separately for each charge,
|ηµ|, and centrality class and corrects thedata for losses attributable to the trigger, reconstruction, and selection criteria employed. In Equation 3, the muon kinematics measured at reconstruction level were not required to be matched to the same bin at generator level. This accounted for bin migration e
ffects in the e
fficiency, which were estimated at the level of 0.3%. Reconstruction and cut e
fficiencies were derived solely from the MC, whereas the trigger efficiencies were obtained from the data in each
|ηµ|and centrality interval. The
CW±ranged from 32% in the most central events at forward
|ηµ|to 85% in the most peripheral bin at mid-rapidity. This large variation is attributable to the high occupancy in the most central events, which strongly a
ffects the performance of the muon isolation and
pmissT.
Using this definition for the correction factor, the differential
Wboson production yields in the fidu- cial region were calculated using the equation:
N|η|,centrality
W± = N|η|,centrality
obs,± −N|η|,centrality bkg,±
C|η|,centrality W±
(4) where
Nobssignifies the number of candidate events observed in the data and
Nbkgthe number of back- ground events for a given
|ηµ|and centrality class.
8 Systematic uncertainties
All systematic uncertainties were determined separately for both charges in each
|ηµ|and centrality class.
Correlations between bins were determined by re-performing the analysis with each definition of sys- temetic uncertainty. The variations in the corrected yields were then evaluated as a function of absolute pseudorapidity and centrality. If the yields varied in the same direction relative to the nominal yields, the systematic uncertainty was considered to be bin-correlated. In the asymmetry and charge ratio mea- surements, cancellations in the ratio result from identical o
ff-diagonal elements in the covariance matrix between µ
+and µ
−, and these were accounted for.
The dominant systematic uncertainty originates from the missing transverse momentum resolution.
The extent to which each event is smeared introduces a bias that fluctuates as a function of the number
of tracks included in the
pmissTcalculation. The magnitude of this bias was evaluated by varying the
pTthreshold of tracks included in the vector sum by
±1 GeV relative to the nominal value. All backgroundTable 5: Upper limits on the relative systematic uncertainties [%] from each source.
Source in percent
pmissT
resolution 4.0
QCD background 2.0
electroweak
+t¯tbackgrounds 0.2
muon isolation 2.0
muon reconstruction 1.0 muon
pTresolution 1.0 muon trigger efficiency 0.4 tracking e
fficiency 0.9 total correlated 5.2
hNcolli
11.6
total uncorrelated 3.0
sources and correction factors were recalculated during this process, resulting in an uncertainty of 2.0- 4.0%.
The uncertainty in the QCD background estimation arises primarily from the extrapolation procedure.
There are two contributing factors: how well the MC actually represents the shape of muons produced from QCD processes and the extent to which jet energy-loss in the medium alters this distribution. Pre- vious ATLAS measurements in heavy ion collisions have shown little disparity between the modification of heavy flavour muon yields and inclusive charged-hadron yields [50, 57]. Therefore, if one considers the modification of charged-hadrons as the maximum amount by which heavy flavour muons are modi- fied, an upper limit on the uncertainty in the extrapolation can be determined. Such an upper limit was estimated by scaling the MC QCD muon
pTdistribution by a
pT-dependent nuclear modification factor calculated according to the procedure in Ref. [58]. This is defined as the ratio between the inclusive charged-hadron yield per binary collision in a heavy ion event and the charged-hadron yield in a
ppcollision, calculated for each centrality class. After applying this factor to the QCD muon distributions, the background fractions were re-evaluated and the variation in the final yields found to be in the range of 0.4-2.0%.
The uncertainty in the
Zboson background estimation was determined by re-calculating the back- ground fractions using yields predicted by the MC rather than those observed in the data. This resulted in an uncertainty < 0.1%. The systematic error in the tau background estimation was evaluated by assum- ing the cut e
fficiencies in
W →µν and
W →τν
τ→µν
µν
τevents are identical. This was performed by re-calculating the background fraction using efficiencies obtained from the signal MC simulation in lieu of efficiencies calculated with the
W→τν MC. This resulted in a variation in the signal yields of < 0.1%.
Other sources of background from
Z →ττ and
t¯tevents were included as a systematic uncertainty and resulted in a yield variation of < 0.2%.
The systematic uncertainty attributed to the isolation efficiency was estimated by repeating the anal- ysis after increasing the cone size around the muon momentum direction from 0.2 to 0.3 and increasing the
PpIDT
from 10% to 20% of the muon
pT. This resulted in a variation of
≈1.0
−2.0% in the number of signal candidates for a given centrality,
|ηµ|, and charge class.The systematic uncertainty due to the muon
pTresolution was estimated by introducing additional
smearing to the
Z →µ
+µ
−simulation until the di-muon mass distribution agreed with that observed in the data. This led to an estimated systematic uncertainty < 1.0%.
Uncertainties in the muon reconstruction efficiency were estimated from comparisons between the efficiencies obtained from the data and the MC. This resulted in an additional 1.0% uncertainty. Un- certainties in the muon trigger e
fficiency were determined by comparing the e
fficiency obtained from a minimum bias sample of single muons and the efficiency calculated from a tag-and-probe method using
Z →µ
+µ
−decays. This resulted in yield variations of 0.4%.
The tracking also introduces a source of systematic error since it plays a major role in the muon reconstruction, isolation, and event
pmissT. This was estimated by fitting the track
pTresolution to both the data and MC. Their difference was used as the systematic uncertainty and resulted in a variation of the yields at the level of 0.9%.
Additional scaling uncertainties in
hNcolliare also applied when reporting the yields per binary col- lision. These were shown in Table 2 and arise from possible contamination due to photo-nuclear events and di
ffractive processes. The procedure for calculating these uncertainties is described in detail in Ref.
[51]. The uncertainty is at most 11.6% and is observed in the most peripheral events. Integrated over all events this uncertainty is around 9.5%.
In total, the bin-correlated systematic uncertainty (i.e. scaling uncertainty) is estimated to be within the range 3
−5% in any centrality and pseudorapidity interval. The uncorrelated systematic uncertainty, calculated from the statistical uncertainty of the MC and single muon data sample used to calculate the trigger e
fficiencies, ranged from 1-3%. Table 5 presents a summary of the upper limits for all systematic uncertainties included in this analysis.
9 Results
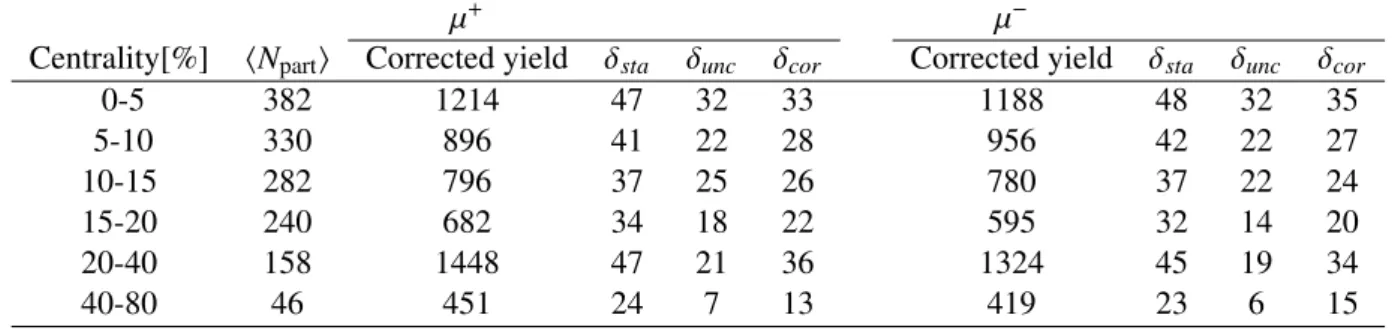
Tables 6-7 report the corrected number of
Wboson candidates for each
hNpartiand absolute pseudora- pidity bin alongside the corresponding statistical, uncorrelated, and correlated uncertainties. The total numbers of signal events in the fiducial region after background subtraction and e
fficiency correction are 5487
±96 (stat.)±86 (syst.)W+bosons and 5262
±95 (stat.)±83 (syst.)W−bosons, resulting in a
W+/W
−ratio of 1.043
±0.028 (stat.)
±0.020 (syst.). The contributions from
nnand
npcollisions are evident, as
ppcollisions alone favour
W+boson production over
W−boson production due to the larger number of
uvalence quarks.
Table 6: Summary of corrected
W+and
W−production yields for each
hNpartialong with their absolute statistical, uncorrelated, and correlated uncertainties. The kinematic requirements are
pµT> 25 GeV,
pmissT
> 25 GeV, and
mT> 40 GeV.
µ
+µ
−Centrality[%]
hNpartiCorrected yield δ
staδ
uncδ
corCorrected yield δ
staδ
uncδ
cor0-5 382 1214 47 32 33 1188 48 32 35
5-10 330 896 41 22 28 956 42 22 27
10-15 282 796 37 25 26 780 37 22 24
15-20 240 682 34 18 22 595 32 14 20
20-40 158 1448 47 21 36 1324 45 19 34
40-80 46 451 24 7 13 419 23 6 15
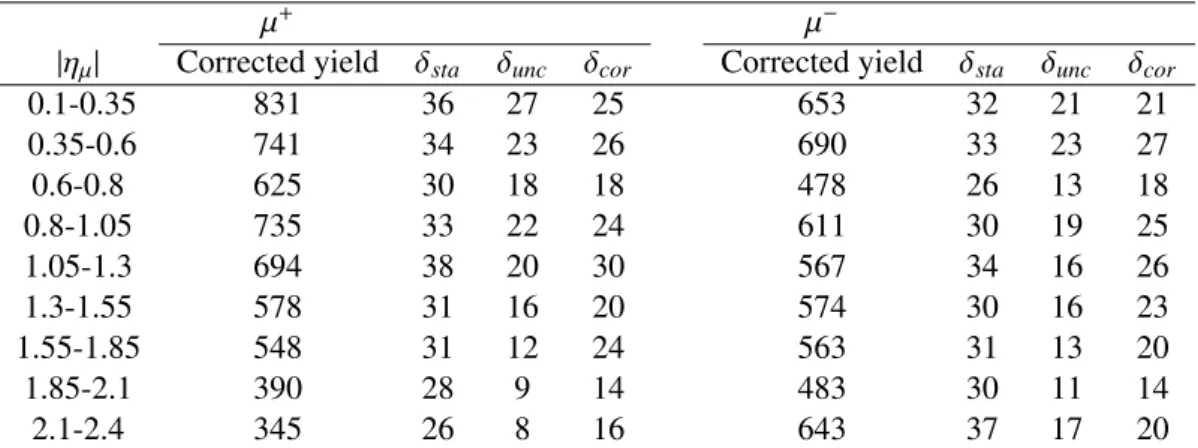
Table 7: Summary of corrected
W+and
W−production yields in bins of
|ηµ|along with their absolute statistical, uncorrelated, and correlated uncertainties. The kinematic requirements are
pµT> 25 GeV,
pmissT
> 25 GeV, and
mT> 40 GeV.
µ
+µ
−|ηµ|
Corrected yield δ
staδ
uncδ
corCorrected yield δ
staδ
uncδ
cor0.1-0.35 831 36 27 25 653 32 21 21
0.35-0.6 741 34 23 26 690 33 23 27
0.6-0.8 625 30 18 18 478 26 13 18
0.8-1.05 735 33 22 24 611 30 19 25
1.05-1.3 694 38 20 30 567 34 16 26
1.3-1.55 578 31 16 20 574 30 16 23
1.55-1.85 548 31 12 24 563 31 13 20
1.85-2.1 390 28 9 14 483 30 11 14
2.1-2.4 345 26 8 16 643 37 17 20
Figure 7 presents the fiducial charge ratio as a function of
hNparti. The data is consistent with anequal production of
W+ →µ
+ν and
W− →µ
−ν ¯ events over all centrality classes. Also shown on the same figure are comparisons to theoretical predictions from PYTHIA using an LO* calculation and POWHEG
+PYTHIA at NLO. Both LO* and NLO predictions are consistent with the data. Moreover, both calculations use an NLO strong coupling constant α
sto calculate the
Wboson cross-section. Uti- lizing an NLO definition of α
sin the cross-section calculation helps at low-x where processes involving gluons become increasingly important (e.g.
Wboson
+1 jet production) and K-factors deviate from unity [44].
Whereas Fig. 7 shows that while the
Wboson charge ratios are insensitive to the differences in LO*
and NLO predictions, disparities arise when comparing the predictions for the absolute
W±boson yields.
This is evident from Fig. 8, which presents the
Wboson production yield per binary collision for both charges separately as well as for the inclusive case as a function of
hNparti. Here it is illustrated thatalthough the charge ratios predicted by NLO and LO* agree, the overall level of the cross-sections are different. The LO* calculation tends to underestimate the data, whereas the NLO prediction is in better agreement. This can also be observed in Fig. 9, which shows the
W+and
W−boson production yields separately as a function of absolute pseudorapidity. The shape di
fferences between the two charges are expected and can be attributed to isospin effects inherent to
W →µν decays. This observation is revisited in the discussion of the charge asymmetry below. Figure 8 also shows there is no centrality dependence for
Wboson production, which is in agreement with previous heavy ion vector boson measurements from Refs. [17] and [19] and further consolidates the potential for electroweak bosons to act as standard candles in heavy ion collisions.
In the past, LO* PDFs have been shown to produce results very close to NLO, but cannot fully reproduce all the features provided by NLO corrections (e.g. events where a hard parton is emitted from one of the incoming partons before undergoing annihilation to produce a
Wboson) [44]. The results shown in Figs. 7-9 are therefore mostly likely attributable to the NLO K-factor, which is common to both
W+and
W−bosons and therefore cancels in the ratio.
The muon charge asymmetry as a function of absolute pseudorapidity is presented in Fig. 10. Theo-
retical predictions from LO* and NLO PDF sets are shown in the same figure. The asymmetry along with
the corresponding statistical and systematic uncertainties are also reported in Table 8 for each pseudora-
part〉
〈 N
0 50 100 150 200 250 300 350 400
- W /N
+W Fiducial Charge Ratio N
0 0.2 0.4 0.6 0.8 1 1.2
Data 2011 PYTHIA LO*
POWHEG NLO
0.14 nb-1
≈ Ldt
∫
= 2.76 TeV sNN
Pb+Pb
ATLAS Preliminary
Figure 7: Ratio of
W+and
W−candidates as a function of
hNparti. Also shown are predictions fromPYTHIA LO* and POWHEG at NLO. The filled grey boxes represent statistical and uncorrelated sys- tematic uncertainties added in quadrature, whereas the grey-hatched bands represent scaling uncertainties and are o
ffset for clarity.
part〉
〈 N
0 50 100 150 200 250 300 350 400
eventsN
,fiducialµ→W N 〉 coll N〈
9 10
0 5 10 15 20 25 30 35
(Data) W±
(PYTHIA LO*) W±
(POWHEG NLO) W±
(Data)
W+ W-(Data)
0.14 nb-1
≈ Ldt
∫
= 2.76 TeV sNN
Pb+Pb
ATLAS Preliminary
Figure 8:
Wboson production yield per binary collision as a function of the mean number of participants
hNpartifor
W+,W
−, and
W±bosons. The kinematic requirements are 0.1 <
|ηµ|< 2.4,
pµT> 25 GeV,
pmissT> 25 GeV, and
mT> 40 GeV. Statistical errors are shown as black bars, whereas uncorrelated
systematic and statistical uncertainties added in quadrature are shown as the filled error band. Scaling
uncertainties are shown as the hatched bands and are o
ffset for clarity. These include uncertainties from
hNcolli. Also shown are LO* and NLO predictions.η|
| 0.2 0.4 0.6 0.8 1 1.2 1.4 1.6 1.8 2 2.2 2.4
〉coll N〈
910
eventsN1 ηddN
1 2 3 4 5 6 7 8 9 10
Data MSTW NLO MRST LO*
Uncorr. uncertainty Corr. uncertainty
ν µ+
→ W++→µ+ν W
0.14 nb-1
≈ Ldt
∫
= 2.76 TeV sNN Pb+Pb
ATLAS Preliminary
0-80%
+| ηµ
| 0.2 0.4 0.6 0.8 1 1.2 1.4 1.6 1.8 2 2.2 2.4
Data/NLO
0.8 0.9 1 1.1 1.2
η|
| 0.2 0.4 0.6 0.8 1 1.2 1.4 1.6 1.8 2 2.2 2.4
〉coll N〈
910
eventsN1 ηddN
1 2 3 4 5 6 7 8 9 10
Data MSTW NLO MRST LO*
Uncorr. uncertainty Corr. uncertainty
ν µ- -→ W-→µ-ν W
0.14 nb-1
≈ Ldt
∫
= 2.76 TeV sNN Pb+Pb
ATLAS Preliminary
0-80%
-| ηµ
| 0.2 0.4 0.6 0.8 1 1.2 1.4 1.6 1.8 2 2.2 2.4
Data/NLO
0.8 0.9 1 1.1 1.2
Figure 9: Differential production yield per binary collision for
W+(left) and
W−(right) events compared to LO* and NLO theoretical predictions. The kinematic requirements are
pµT> 25 GeV,
pmissT> 25 GeV, and
mT> 40 GeV. The bottom panel shows the ratio between the data and NLO prediction.
pidity interval. The sign-change of the asymmetry is not observed in
ppcollisions [24] and as mentioned previously is a consequence of a greater fraction of
dvalence quarks in the colliding system. This results in an excess of
W−boson production at forward rapidity that subsequently decay according to constraints imposed by isospin conservation. Both theoretical predictions appear to describe the data well, and this is consistent with Fig. 7.
Additionally, within the current uncertainties of the measurement, the existence of any nuclear mod- ifications to the PDF remain unclear. However, it should be mentioned that predictions using nuclear corrections from EPS09 [28] do predict a greater fraction of
Wbosons at mid-rapidity and a smaller fraction at forward rapidity relative to distributions without these corrections applied. Nonetheless, the appropriate conclusion from the measurement presented here is that applying the correct weighting to each nucleon combination su
fficiently describes the data. This result is in accordance with the asymme- try presented in Ref. [19], in which it is purported that nuclear modifications to the PDF are small in comparison to the influence of the nucleon content and ensuing isospin effects in the final state.
10 Conclusion
The measurement of
W±boson production in Pb+Pb collisions at
√sNN =
2.76 TeV has been presented using data corresponding to an integrated luminosity of 0.14 nb
−1collected with the ATLAS detector at the LHC. The
W±boson candidates were selected using muons in the final state in the fiducial region 0.1 <
|ηµ|< 2.4,
pµT> 25 GeV,
pmissT> 25 GeV, and
mT> 40 GeV. After correction and background- subtraction, 5487
±96 (stat.)±86 (syst.) W+bosons and 5262
±95 (stat.)±83 (syst.) W−bosons were reported. The production rates were presented as a function of
hNpartiand absolute pseudorapidity. No centrality dependence was observed and the production yields were found to agree with NLO predictions.
The charge ratios, on the other hand, were found to be insensitive to di
fferences in the
Wboson cross-
section predicted by NLO and LO* calculations. The charge asymmetry of muons from
W±boson
decays was also presented. The shape of the distribution was dissimilar to the result from
ppcollisions,
µ| η
|
0.2 0.4 0.6 0.8 1 1.2 1.4 1.6 1.8 2 2.2 2.4
µMuon Charge Asymmetry A
-0.4 -0.3 -0.2 -0.1 0 0.1 0.2
Data 2011 MRST LO*
MSTW NLO
Stat. uncertainty Total uncertainty 0.14 nb-1
≈ Ldt
∫
= 2.76 TeV sNN
Pb+Pb
ATLAS Preliminary
0-80%
Figure 10: The muon charge asymmetry
Aµfrom
W±bosons as a function of absolute pseudorapidity compared to theoretical predictions from the MRST LO* and MSTW2008NLO PDF sets. The total uncertainty respresents the quadrant sum of the statistical and systematic uncertainties. The kinematic requirements are
pµT> 25 GeV,
pmissT> 25 GeV, and
mT> 40 GeV.
Table 8: Muon charge asymmetry from
W±→µ
±ν events in bins of absolute pseudorapidity measured for
pµT> 25 GeV,
pmissT> 25 GeV, and
mT> 40 GeV. Also shown are the absolute statistical, uncorrelated, and correlated uncertainties for each bin.
Muon Charge Asymmetry
|ηµ| Aµ
δ
staδ
corδ
unc0.1-0.35 0.120 0.033 0.022 0.020 0.35-0.6 0.035 0.033 0.023 0.020 0.6-0.8 0.130 0.037 0.020 0.013 0.8-1.05 0.091 0.033 0.021 0.016 1.05-1.3 0.100 0.040 0.020 0.017 1.3-1.55 0.004 0.038 0.020 0.013 1.55-1.85 -0.013 0.039 0.016 0.030 1.85-2.1 -0.110 0.047 0.016 0.009 2.1-2.4 -0.300 0.048 0.016 0.019
which is expected due to the additional neutron component in Pb
+Pb collisions that serve to enhance the
overall
W−boson production yield. The asymmetry was found to agree well with theoretical predictions
from LO* and NLO PDF sets within uncertainties, making it ambiguous at the moment whether nuclear
e
ffects are non-existent or the precision of the measurement needs to be improved in order to disentangle
e
ffects due to di
fferent bi-nucleon collisions and nuclear modifications. The results presented here may
serve as a complementary measurement to the
ppand
pp¯ asymmetry reported in Refs. [22] and [24] in
addition to a compelling observable for the study of PDFs in multi-nucleon systems.
References
[1] PHENIX Collaboration, Nucl. Phys.,
A757, 184 (2005).[2] BRAHMS Collaboration Nucl. Phys.,
A757, 1 (2005).[3] B.B. Back
et al., Nucl. Phys.,A757, 28 (2005).[4] STAR Collaboration, Nucl. Phys.,
A757, 102 (2005).
[5] ATLAS Collaboration, Phys. Rev. Lett.,
105, 252303 (2010).[6] CMS Collaboration, Phys. Rev. C,
84, 024906 (2011).[7] B. Mohanty, New J. Phys.,
13, 065031 (2011).[8] B. Mohanty, Nucl. Phys. A,
830, 899C (2009).[9] K. Fukushima and T. Hatsuda, Rept. Prog. Phys.,
74, 014001 (2011).[10] M.J. Tannenbaum, Rep. Prog. Phys.,
69, 2005 (2006).[11] B. Muller, J. Schukraft, and B. Wyslouch, Annu. Rev. Nucl. Part. Sci.,
62, 361 (2012)[12] S.S. Adler
et al., Phys. Rev. Lett.,91, 072301 (2003).[13] J. Adams
et al., Phys. Rev. Lett.,91, 172302 (2003).[14] I. Arsene
et al., Phys. Rev. Lett. ,91, l072305 (2003).[15] B.B. Back
et al., Phys. Rev. Lett. ,94, 082304 (2005).[16] PHENIX Collaboration, Phys. Rev. Lett. ,
109, 152302 (2012).[17] ATLAS Collaboration, Phys. Rev. Lett. ,
110, 022301 (2013)[18] CMS Collaboration, Phys. Lett. B ,
710, 256 (2012).[19] CMS Collaboration, Phys. Lett. B ,
715, 66 (2012).[20] CMS Collaboration, Phys. Rev. Lett. ,
106, 212301 (2011).[21] E. L. Berger, F. Halzen, C. S. Kim, and S. Willenbrock, Phys. Rev. ,
D40, 83 (1989).[22] CDF Collaboration, Phys. Rev. Lett. ,
102, 181801 (2009).[23] ATLAS Collaboration, ATLAS Note No. CERN-LHCC-2007-001,
https://cds.cern.ch/record/1009649/files/lhcc-2007-001.pdf, (2007)
[24] ATLAS Collaboration, Phys. Rev. D ,
85, 072004 (2012)[25] CMS Collaboration, JHEP ,
050, 04 (2011).[26] R. D. Ball,
et al., Nucl. Phys. B ,838, (2010) 136.[27] S. Alekhin
et al., arXiv:hep-ph/0601012 (2005).[28] H. Paukkunen and C.A. Salgado, JHEP 1103 ,
071, (2011).[29] K. J. Eskola, H. Paukkunen and C. A. Salgado, JHEP ,
065, 0904 (2009).[30] I. Schienbein
et al., Phys. Rev. D ,80, 094004 (2009).[31] M. Hirai, S. Kumano and T. H. Nagai, Phys. Rev. C ,
76, 065207 (2007).[32] D. de Florian and R. Sassot, Phys. Rev. D ,
69, 074028 (2004).[33] A.D. Martin, W.J. Stirling, and R.G. Roberts, Phys. Rev. D ,
50, 6734 (1994) [34] H.L. Lai
et al., Phys. Rev. D ,51, 4763 (1995).[35] ATLAS Collaboration, J. Instrum. ,
3, S08003 (2008)[36] ATLAS Collaboration, Eur. Phys. J. C ,
72, 1849 (2012).[37] ATLAS Collaboration, ATLAS Note No. ATLAS-CONF-2012-099
https://cds.cern.ch/record/1462601?ln=en, (2012)
[38] GEANT4 Collaboration, Nucl. Instrum. Meth. A ,
506, 250 (2003).[39] X. -N. Wang and M. Gyulassy, Phys. Rev. ,
D44, 3501 (1991).
[40] S. Alioli, P. Nason, C. Oleari and E. Re, JHEP,
0807, 060 (2008).[41] T. Sj¨ostrand, S. Mrenna and P. Z. Skands, Comput. Phys. Comm. ,
178, 852 (2008).
[42] H. -L. Lai
et al., Phys. Rev. D82, 074024 (2010) [arXiv:1007.2241 [hep-ph]].[43] A.D. Martin
et al., Eur. Phys. J. C ,63, 189 (2009).[44] A. Sherstnev and R.S. Thorne, Eur. Phys. J. C.,
55, 553 (2008).[45] T. Sj¨ostrand, S. Mrenna and P. Z. Skands, JHEP,
0605, (2006) 026.
[46] S. Jadach, Z. Was, R. Decker, and J. Kuhn, Comput. Phys. Commun. ,
76, 361 (1993).[47] ATLAS Collaboration, ATLAS Note No. ATLAS-CONF-2012-122,
https://cds.cern.ch/record/1473425?ln=en
(2012).
[48] A. Artikov,
et al., AT-GE-ES-0001 (2004)[49] K. Nakamura
et al., J. Phys. G 37, 075021 (2010).[50] ATLAS Collaboration, Phys. Lett. B 710, 363 (2012).
[51] M.L. Miller, K. Reygers, S.J. Sanders, and P. Steinberg, Annu. Rev. Nucl. Part. Sci. ,
57, 205-243(2007)
[52] D0 Collaboration, Phys. Rev. Lett. ,
103, 141801 (2009)[53] ATLAS Collaboration, ATLAS Note No. ATLAS-COM-CONF-2012-101
https://cds.cern.ch/record/1463915?ln=en
(2012)
[54] ATLAS Collaboration, Phys. Lett. B ,
707, 330 (2012).[55] ATLAS Collaboration, ATLAS Note No. ATLAS-CONF-2010-036
https://cds.cern.ch/record/1277675?ln=en
(2010).
[56] ATLAS Collaboration, ATLAS Note No. ATLAS-CONF-2011-003
https://cds.cern.ch/record/1326960?ln=en
(2011).
[57] ATLAS Collaboration, ATLAS Note No. ATLAS-CONF-2012-050
https://cds.cern.ch/record/1451883?ln=en

![Table 5: Upper limits on the relative systematic uncertainties [%] from each source. Source in percent p miss T resolution 4.0 QCD background 2.0 electroweak + t¯t backgrounds 0.2 muon isolation 2.0 muon reconstruction 1.0 muon p T resolution 1.0 muon trig](https://thumb-eu.123doks.com/thumbv2/1library_info/4019227.1541655/13.892.303.597.202.471/systematic-uncertainties-resolution-background-electroweak-backgrounds-reconstruction-resolution.webp)