A TLAS-CONF-2015-063 15 December 2015
ATLAS NOTE
ATLAS-CONF-2015-063
15th December 2015
Search for new resonances in events with one lepton and missing transverse momentum in pp collisions at √
s = 13 TeV with the ATLAS detector
The ATLAS Collaboration
Abstract
This note presents a search for W
0bosons in events with one lepton (electron or muon) and missing transverse momentum. The search uses 3.3 fb
−1of pp collision data collected at √
s = 13 TeV by the ATLAS experiment at the LHC in 2015. The transverse mass distribution is examined and no significant excess of events above the expected level from Standard Model processes is observed. The results are translated into exclusion limits for W
0bosons with the same couplings to fermions as the Standard Model W boson. W
0masses below 4.07 TeV are excluded at the 95% confidence level, improving on the previous Run-1 limits by around 800 GeV.
c
2015 CERN for the benefit of the ATLAS Collaboration.
1 Introduction
Many models of physics beyond the Standard Model (SM) predict the existence of new spin-1 gauge bosons that could be discovered at the Large Hadron Collider (LHC). While the details of the models vary, conceptually these particles are heavier versions of the SM W and Z bosons and are generically called W
0and Z
0bosons. In the following, a search for a W
0boson is presented using 3.3 fb
−1of integrated luminosity of pp collision data collected with the ATLAS detector in 2015 at a centre-of-mass energy of 13 TeV. The results are interpreted in the context of the benchmark Sequential Standard Model (SSM) [1], in which the couplings of the W
SSM0to fermions are assumed to be identical to those of the SM W boson. A previous W
SSM0search by the ATLAS collaboration using 20.3 fb
−1of √
s = 8 TeV data collected in 2012 set a 95% confidence level (CL) lower limit on the W
SSM0mass of 3.24 TeV [2]. The CMS collaboration has published a search using 19.7 fb
−1of √
s = 8 TeV data from 2012 to exclude W
SSM0masses below 3.28 TeV at 95% CL [3].
The search is conducted in the W
0→ `ν channel, where ` is a charged lepton and can be either an electron or a muon. The signature is a lepton with high transverse momentum (p
T) and substantial missing transverse momentum (E
missT) due to the undetected neutrino. The signal discriminant is the transverse mass
m
T= q
2 p
TE
missT(1 − cos φ
`ν), (1)
where φ
`νis the azimuthal angle between the lepton and E
missTin the transverse plane
1. The dominant background for the W
0→ `ν search is the high-m
Ttail of the charged-current Drell–Yan (q q ¯
0→ W → `ν) process. The data are compared to the SM background expectations to search for deviations from the predictions.
2 ATLAS detector
The ATLAS experiment [4] at the LHC is a multi-purpose particle detector with a forward-backward sym- metric cylindrical geometry and a near 4π coverage in solid angle. It consists of an inner tracking detector (ID) surrounded by a thin superconducting solenoid providing a 2 T axial magnetic field, electromagnetic (EM) and hadronic calorimeters, and a muon spectrometer (MS). The inner tracking detector covers the pseudorapidity range |η| < 2.5. It consists of a silicon pixel detector including the newly-installed insert- able B-layer [5], followed by silicon micro-strip, and transition radiation tracking detectors. Lead/liquid- argon (LAr) sampling calorimeters provide EM energy measurements with high granularity. A hadronic (steel/scintillator-tile) calorimeter covers the central pseudorapidity range ( |η| < 1.7). The end-cap and forward regions are instrumented with LAr calorimeters for both EM and hadronic energy measurements up to |η| < 4.9. The muon spectrometer surrounds the calorimeters and is based on three large air-core toroid superconducting magnets with eight coils each. Its bending power ranges from 2.0 to 7.5 T m. It includes a system of precision tracking chambers, over |η| < 2.7, and fast detectors for triggering, over
|η| < 2.4. A two-level trigger system is used to select events. The first-level trigger is implemented in hardware and uses a subset of the detector information. This is followed by the software-based trigger system that reduces the accepted event rate to less than 1 kHz.
1
ATLAS uses a right-handed coordinate system with its origin at the nominal interaction point (IP) in the centre of the detector and the
z-axis along the beam pipe. The x-axis points from the IP to the centre of the LHC ring, and they-axis pointsupward. Cylindrical coordinates (r, φ) are used in the transverse plane,
φbeing the azimuthal angle around the beam pipe.
The pseudorapidity is defined in terms of the polar angle
θas
η=−ln tan(θ/2).3 Simulated samples
Monte Carlo (MC) simulation samples are used to model the expected signal and background yields, with the exception of data-driven background estimates for events in which at least one final state jet or photon passes the electron or muon selection criteria.
The main background is due to the charged-current Drell–Yan (DY) process, generated at next-to-leading order (NLO) using P owheg -B ox v2 [6] and the CT10 parton distribution functions (PDF) [7], with P y - thia 8.186 [8] to model parton showering and hadronisation. The same setup is used for the neutral- current DY (q q ¯ → Z/γ
∗→ ``) process. In both cases, samples for all three lepton flavours are generated, and the final-state photon radiation (QED FSR) is handled by P hotos [9]. The DY samples are normalised as a function of mass to a next-to-next-to leading order (NNLO) perturbative QCD (pQCD) calculation using VRAP [10] and the CT14NNLO PDF [11]. In addition, NLO electroweak (EW) corrections beyond QED FSR as calculated with M csanc [12, 13] are applied.
Backgrounds from t¯ t and single top production are estimated at NLO using Powheg-Box v2 and Powheg- B ox v1 respectively. These processes use the CT10 PDF set and are interfaced to P ythia 6.428 [14] for parton showering and hadronisation. The t¯ t MC samples are normalised to a cross section of σ
tt¯= 832
+−2920(scale) ±35 (PDF + α
s) pb as calculated with the Top++2.0 program, which is accurate to NNLO in pQCD, including soft-gluon resummation to next-to-next-to-leading-log order (see Ref. [15] and refer- ences therein), and assuming a top-quark mass of 172.5 GeV. The first uncertainty comes from the in- dependent variation of the factorisation and renormalisation scales, while the second one is associated to variations in the PDF and α
s, following the PDF4LHC prescription (see Ref. [16] and references therein) with the MSTW2008 68% CL NNLO [17], CT10 NNLO [18] and NNPDF2.3 [19] PDF sets.
Further potential backgrounds are due to diboson (WW, WZ and ZZ) production. The diboson processes are generated with S herpa 2.1.1 [20] using the CT10 PDF.
Signal samples for the W
0→ eν and W
0→ µν processes in the SSM are produced at leading order (LO) using P ythia 8.183 and the NNPDF23 LO PDF. The W
0has the same couplings to fermions as the Standard Model W boson. Interference between the W
0and the W is not included and the decay into a WZ pair is not allowed. The signal samples are normalised to the same NNLO pQCD calculation as a function of mass, as discussed above. The EW corrections beyond QED FSR are not applied to the signal samples because they depend on the couplings of the new particle, and are therefore model-dependent.
The resulting cross section times branching ratio for W
SSM0masses of 2, 3 and 4 TeV are 153, 15.3 and 2.25 fb, respectively.
For all samples used in this analysis, the e ff ects of multiple interactions per bunch crossing (“pile-up”) are accounted for by overlaying simulated minimum bias events. The interaction of particles with the detector and its response are modeled using a full ATLAS detector simulation [21] based on G eant 4 [22].
Finally, several corrections are applied to the simulated samples, accounting for di ff erences between data
and simulation in the lepton trigger, reconstruction, identification, and isolation efficiencies as well as the
lepton energy / momentum resolution and muon momentum scale.
4 Object reconstruction and event selection
Events in the muon channel are selected by a trigger requiring that at least one muon with p
T> 50 GeV is found in the event. These muons must be reconstructed in both the MS and the ID. The e ffi ciency is around 80–90%, inefficiencies being mainly due to regions with reduced first-level muon trigger coverage. In the electron channel, events are selected by a trigger requiring at least one electron with p
T> 24 GeV that satisfies the medium identification criteria, which are very similar to the ones used in the o ffl ine recon- struction and were optimised using a likelihood approach [23]. In addition, loose hadronic calorimeter- based isolation criteria are applied in the first-level trigger. To recover possible efficiency losses at high momenta, two additional electron triggers without isolation requirements are included, selecting elec- trons with p
T> 60 GeV satisfying the medium identification criteria, and electrons with p
T> 120 GeV satisfying the loose identification criteria.
The selected events must have a reconstructed primary vertex, which is the interaction vertex with the highest sum of p
2Tof tracks found in the event. Each vertex reconstructed in the event consists of at least two associated tracks with p
T> 0.4 GeV. Only data taken during periods when all detector components and the trigger readout were functioning well are considered.
Muons are reconstructed from MS tracks and matching ID tracks in |η| < 2.5, requiring that the MS track have at least three segments in each of three separate layers of MS chambers [24] to ensure optimal muon resolution at high p
T. To reduce sensitivity to relative barrel-endcap alignment in the MS, the region 1.01 < |η| < 1.10 is vetoed. These combined muons are required to pass a track quality selection based on the number of hits in the two sub-systems. Events are rejected if the significance of the di ff erence in the muon charge over momentum measurements in the two systems exceeds seven, or if the track crosses poorly-aligned MS chambers. To ensure that the muons come from the primary vertex, the transverse impact parameter significance, which is the ratio of the transverse impact parameter (d
0) to its uncertainty, has to be below three and the longitudinal impact parameter z
0must fulfil |z
0× sin θ| < 10 mm.
Furthermore, only isolated muons are considered. The sum over the track p
Tin an isolation cone around the muon (excluding the muon itself) divided by the muon p
Tis required to be below a p
Tdependent cut and is tuned for a 99% e ffi ciency. The isolation cone size is ∆ R = p
( ∆ η)
2+ ( ∆ φ)
2= 10 GeV/p
µTwith a maximum size of ∆ R = 0.3.
Electrons are formed from clusters of cells in the electromagnetic calorimeter associated with a track in the ID. The electron p
Tis obtained from the calorimeter energy measurement and the direction of the associated track. In data, the electron energy scale is applied on the calibrated cluster energy. The elec- tron must be within the range |η| < 2.47 and outside the transition region between the barrel and endcap calorimeters (1.37 < |η| < 1.52). In addition, tight identification criteria [23] need to be satisfied for elec- trons with p
T< 125 GeV while higher- p
Telectrons need to satisfy the medium identification selection.
The identification uses a likelihood discriminant based on measurements of calorimeter shower shapes
and measurements of track properties from the ID. To ensure that the electrons come from the primary
vertex, the transverse impact parameter significance must be below five. Furthermore, calorimeter and
track-based isolation criteria, tuned for an overall e ffi ciency of 98%, independent of p
T, are applied. The
sum of the calorimeter transverse energy deposits in the isolation cone of size ∆ R = 0.2 (excluding the
electron itself) divided by the electron p
Tis used as the discrimination criterion. The track-based isolation
is determined in a similar way as for muons. The scalar sum of the p
Tof all tracks, inside a cone with
size ∆ R = 10 GeV/p
eTand a maximum value of ∆ R = 0.2 around the electron, divided by the electron p
Thas a given value.
The calculation of the missing transverse momentum is based on the selected electrons, photons, taus, muons and jets found in the event. The value of E
missTis evaluated by summing over the p
Tof the physics objects selected in the analysis and the soft tracks not belonging to any of these physics objects [25].
Jets used in the E
missTcalculation are reconstructed from calorimeter clusters in |η| < 5 using the anti- k
talgorithm [26] with a distance parameter of 0.4. They are calibrated using the method described in Ref. [27] and are required to have p
T> 20 GeV. The impact of multiple overlapping pp interactions is accounted for using a technique that provides an event-by-event and jet-by-jet pile-up correction [28]. For jets with p
T< 50 GeV and |η| < 2.4 a jet-vertex-tagger is applied, which uses a multivariate combination of track-based variables to quantify the likelihood that a jet originates from the hard-scatter process.
The event selection requires exactly one muon with p
T> 55 GeV or one electron with p
T> 65 GeV.
The E
Tmissvalue found in the event is required to exceed 55 GeV in the muon channel and 65 GeV in the electron channel. The transverse mass is required to satisfy m
T> 110 (130) GeV in the muon (electron) channel.
5 Background estimate and comparison to data
The background from processes with at least one prompt final-state lepton is estimated from MC simu- lations. The processes with non-negligible contributions are charged current DY (W production), t¯ t and single top-quark production, denoted in the following as “Top” background, as well as neutral current DY (Z/γ
∗production) and diboson production.
Background contributions from events where at least one final-state jet or photon passes the lepton selec- tion criteria are determined using a data-driven “matrix” method. This includes contributions from mul- tijet, heavy-flavour quark and γ + jet production, referred to hereafter as the multijet background. The first step of the matrix method is to calculate a fake rate f that is defined as the fraction of lepton candidates that pass the nominal lepton identification and isolation requirements, with respect to a background- enriched sample containing “loose” lepton candidates. These loose candidates satisfy only a subset of the nominal criteria, which are stricter than the trigger requirements imposed. Potential contamination of prompt final-state leptons in the background-enriched sample are accounted for using MC simulation.
In addition to the fake rate, the probability r that a real lepton in the sample of loose objects satisfies the nominal requirements is used in evaluating this background. This probability is computed from MC simulation. Potential di ff erences between data and simulated samples in lepton identification and isol- ation efficiencies are accounted for by applying corrections to the simulation, as already mentioned in Section 3.
The contribution to the background from events with a fake lepton is determined in the following way.
The relation between the number of true events with (N
R) and without (N
F) a prompt lepton and the number of measured objects in the triggered sample (N
T, N
L) can be written as,
N
TN
L!
= r f
(1 − r) (1 − f )
! N
RN
F!
, (2)
where the subscript T refers to leptons that pass the nominal selection. The subscript L corresponds to
leptons that pass the loose requirements described above but fail the nominal requirements. The number
Entries
1
10−
1 10 102
103
104
105 s = 13 TeV, 3.3 fb-1
Data W Top Multijet
* Z/γ Diboson W’ (2 TeV)
W’ (3 TeV) W’ (4 TeV) Preliminary
ATLAS selection eν W’ →
Transverse mass [GeV]
200 300 1000 2000
Data / Bkg
0.6 0.8 1 1.2 1.4
Entries
1
10−
1 10 102
103
104
105
106 -1
= 13 TeV, 3.3 fb s
Data W Top
* Z/γ Diboson Multijet W’ (2 TeV)
W’ (3 TeV) W’ (4 TeV) Preliminary
ATLAS selection ν µ W’ →
Transverse mass [GeV]
200 300 1000 2000
Data / Bkg
0.6 0.8 1 1.2 1.4
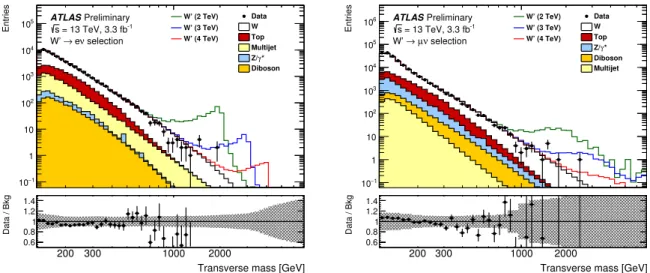
Figure 1: Transverse mass distributions for events satisfying all selection criteria in the electron (left) and muon (right) channels. The distributions are compared to the stacked sum of all expected backgrounds, with three selected W
SSM0signals overlaid. The bin width is constant in log m
T. The band in the ratio plot shows the quadratic sum of all systematic uncertainties that are estimated to change the number of expected background events in the respective channel by at least 3% in at least one bin in m
T(see Section 6 for details).
of jets and photons misidentified as leptons (N
TMultijet) in the total number of objects reconstructed as signal-like (N
T) is given as:
N
TMultijet= f N
F= f r − f
r (N
L+ N
T) − N
T. (3)
The right-hand side of Eq. (3) is obtained by inverting the matrix in Eq. (2).
The simulated top quark and diboson samples as well as the data-driven background estimate are stat- istically limited at large m
T. Therefore the expected number of events is extrapolated into the high m
Tregion using fits. Several fits are carried out, exploring various fit ranges as well as the two fit functions f (m
T) = e
−am
bTm
cTlogmTand f (m
T) = a/(m
T+ b)
c. The fit with the best χ
2/d.o. f. is used as the extrapol- ated background contribution, with an uncertainty evaluated using the RMS of all attempted fits.
Finally, the number of expected background events is calculated as the sum of the data-driven and simu- lated background estimates. As can be seen in Figure 1, the charged current DY production dominates the background for all values of m
T. As an example, for m
T> 1 TeV the contribution from charged current DY is about 90% for both channels. The remaining background is dominated by multijet production in the electron channel and contains rather similar contributions from neutral current DY, top, and diboson production in the muon channel.
In both channels, the background estimate is in general agreement with the data, as can be seen in Figure 1.
The ratios of data to background expectations are shown in the lower panels, with a band representing
the quadratic sum of all systematic uncertainties that are estimated to change the number of expected
background events in the respective channel by at least 3% in at least one bin in m
T(see Section 6 for
details).
Source Electron channel Muon channel
Background Signal Background Signal
Trigger negl. (negl.) negl. (negl.) 3% (3%) 3% (4%)
Lepton reconstruction and identification negl. (negl.) negl. (negl.) 6% (10%) 5% (8%)
Lepton isolation negl. (negl.) negl. (negl.) 5% (5%) 5% (5%)
Lepton momentum scale and resolution 3% (3%) 11% (6%) 49% (69%) 5% (21%) E
Tmissscale and resolution < 0.5% (< 0.5%) < 0.5% (< 0.5%) 1% (1%) 1% (2%) Jet energy resolution < 0.5% (< 0.5%) < 0.5% (1%) 1% (1%) 1% (1%)
Multijet background 3% (19%) n/a ( n/a ) negl. (negl.) n/a ( n/a )
PDF variation for DY production 8% (10%) n/a ( n/a ) 6% (8%) n/a ( n/a ) PDF choice for DY production 3% (13%) n/a ( n/a ) 2% (2%) n/a ( n/a )
Luminosity 8% (4%) 9% (9%) 9% (9%) 9% (9%)
Total 12% (26%) 14% (11%) 51% (71%) 13% (25%)
Table 1: Systematic uncertainties on the expected number of events as evaluated at m
T= 2 (4) TeV, both for signal events with a W
SSM0mass of 2 (4) TeV and for background. Uncertainties estimated to have an impact < 3% on the expected number of events for all values of m
Tare denoted as negligible (“negl”). In case they are negligible in both channels they are not listed. Uncertainties that are not applicable are denoted “ n/a ”.
6 Systematic uncertainties
The systematic uncertainties can be subdivided in the experimental uncertainties on the selected electrons and muons and on E
missT, and uncertainties from the theoretical predictions. In the statistical analysis, all systematic uncertainties estimated to have an impact < 3% on the expected number of events for all values of m
Tare neglected, as they have negligible impact on the results of the search. The systematic uncertainties considered in at least one of the two channels are summarised in Table 1.
Experimental systematic uncertainties arise from the background and luminosity estimate, the trigger se-
lection, the lepton reconstruction, identification and isolation criteria [23, 24], as well as effects of the
energy/momentum scale and resolution [24, 29]. The data-driven multi-jet background estimation dis-
cussed in Section 5 is the dominating source of uncertainty in the electron channel. The main source of
uncertainty in the muon channel stems from the momentum resolution due to residual misalignments in
the MS, measured using dedicated data-taking periods with no magnetic field in the MS. The electron and
muon e ffi ciencies have been evaluated from data using tag-and-probe methods in Z decays. For electrons
the e ffi ciency is measured following the prescription of Ref. [30], with certain improvements and adjust-
ments for the 2015 running conditions. However, the electron identification efficiency is only measured
precisely up to a transverse momentum of 150 GeV. The e ff ect of the extrapolation to higher values of
p
Twas found to be 2% and was estimated by extrapolating the shower shapes to high p
Tand by varying
the shower shapes for which differences are observed between data and MC simulation. For muons, the
uncertainty in the reconstruction e ffi ciency includes the uncertainty obtained from Z → µ µ data studies,
as well as a high-p
Textrapolation uncertainty corresponding to the magnitude of the drop in the muon
reconstruction and selection efficiency with increasing p
Tthat is predicted by the MC simulation. For
the isolation criterion, the extrapolation uncertainty to high p
Tis 2% for electrons and conservatively
estimated to be 5% for muons with p
T> 500 GeV.
The systematic uncertainties related to E
Tmisscome from both the calculation of the contribution of tracks not belonging to any physics object in the E
Tmisscalculation [25] and the jet energy scale and resolution uncertainties [27]. The uncertainties due to the jet energy and E
missTresolution are small at large m
Tas can be seen in Table 1, but have non-negligible contributions at small m
T, while the scale uncertainties are found to be negligible. The uncertainty on the integrated luminosity is 9%, affecting all simulated samples. It is derived, following a methodology similar to that detailed in Ref. [31], from a preliminary calibration of the luminosity scale, using a pair of x − y beam-separation scans performed in June 2015.
Theoretical uncertainties are related to the production cross sections of the various backgrounds estim- ated from MC simulation. The dominant uncertainty arises from the PDF for the charged current DY background. The PDF uncertainty denoted as “PDF variation” in Table 1 is obtained from the 90% CL CT14NNLO PDF error set, using VRAP in order to calculate the NNLO Drell–Yan cross section as a function of mass. An additional uncertainty is assigned to take into account potential di ff erences when using the MMHT2014 [32] or NNPDF3.0 [33] PDF sets. Of these, only the central values for NNPDF3.0 fall outside of the 90% CL CT14NNLO PDF uncertainty band, and the full difference between the central predictions of these two PDFs is taken as an additional asymmetric uncertainty quoted as “PDF choice.”
Scale uncertainties on the charged current DY are estimated by varying the renormalisation and factor- isation scales simultaneously up and down by a factor of two, also using VRAP. The resulting maximum variations are less than 3%. The theoretical uncertainties on the t¯ t background are due to the t¯ t normalisa- tion (about 6%) and the background extrapolation already described in Section 3, however, they alter the total number of expected events by less than 3%. Similarly, uncertainties on the diboson backgrounds, the electroweak corrections and the choice of α
scan be neglected.
7 Results
To test for excesses in data, a log-likelihood ratio test is carried out using RooStats [34], which calculates the probability that the background fluctuates such as to create a signal-like excess equal to or larger than what is observed. The likelihood functions in the ratio are defined as the product of the Poisson probabilities over all mass bins in the search region assuming Gaussian-distributed nuisance parameters, and are maximised for the two cases of the presence of a signal and background only. The signal is modeled using W
SSM0templates in m
Tfor a series of W
SSM0masses covering the full considered mass range. As examples, three of these templates are shown in Figure 1 for both channels. The largest excess in the electron channel is found around m
T= 600 GeV with a local p
0value of 0.004 corresponding to a significance of 2.6 σ. In the muon channel no excess larger than 2 σ is observed. These significances are local significances that do not include the trials factor, which accounts for the probability of observing an excess anywhere in the search region. The trials factor reduces the excess at 600 GeV to a so-called global significance of 1.0 σ corresponding to a p
0value of 0.16.
In the absence of a signal, upper limits on the cross section for the production of a new boson times its
branching ratio to a single lepton generation (σB) are determined at 95% CL as a function of the mass of
the boson, m
W0. The observed upper limits are derived by comparing data to the expected background,
using templates for the shape of the simulated m
Tdistributions for different signal masses. Similarly, the
expected limit is determined using pseudo-experiments obtained from the estimated background distribu-
tions, instead of the actual data. The pseudo-experiments result in a distribution of limits, the median of
which is taken as the expected limit, and 1 σ and 2 σ bands are defined as the ranges containing respect-
ively 68% and 95% of the limits obtained with the pseudo-experiments. The limit setting is based on a
[TeV]
mW’
1 2 3 4 5 6
B [pb]σ
4
10− 3
10− 2
10− 1
10−
1 10
Expected limit 1σ Expected ±
2σ Expected ± Observed limit W’SSM
Preliminary ATLAS
= 13 TeV, 3.3 fb-1
s eν W’→
Run-I Limit
[TeV]
mW’
1 2 3 4 5 6
B [pb]σ
−4
10
−3
10
−2
10
−1
10 1 10
Expected limit 1σ Expected ±
2σ Expected ± Observed limit W’SSM
Preliminary ATLAS
= 13 TeV, 3.3 fb-1
s ν µ W’→
Run-I Limit
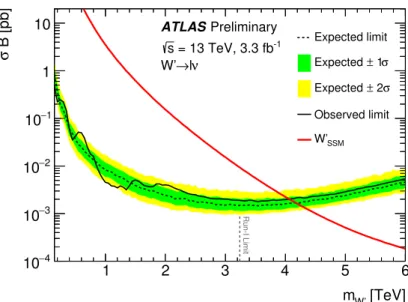
Figure 2: Median expected (dashed black line) and observed (solid black line) 95% CL upper limits on cross-section times branching ratio (σB) in the electron (left panel) and muon (right panel) channels. The 1 σ (green) and 2 σ (yellow) bands are also shown. The predicted σB for W
SSM0production is shown as a red solid line. The vertical dashed line indicates the mass limit of the 8 TeV data analysis [2].
Bayesian approach detailed in Ref. [35], using the Bayesian Analysis Toolkit [36], with a uniform positive prior probability distribution for σB. The W
SSM0templates mentioned above are used for the limit setting, however, the limit on σB is largely independent of the choice of template, as shown in Ref. [35].
Figure 2 presents the expected and observed limits separately for the electron and muon channels, and Figure 3 presents their combination. The expected upper limit on σB is stronger in the electron channel due to the larger acceptance times e ffi ciency and the better momentum resolution. Acceptance times e ffi - ciency is defined as the fraction of simulated candidate events that pass the event selection, and amounts to 85% (81%) for the electron channel and 52% (48%) for the muon channel at a W
0mass of 2 TeV (4 TeV). The di ff erence in resolution can be seen in Figure 1 when comparing the shapes of the three reconstructed W
SSM0signals. For both channels and their combination, the observed limit is within the
±2 σ band of expected limits for all m
W0, except for the region around 600 GeV in the electron channel, where an excess with a local significance of 2.6 σ is found, as already mentioned above.
For specific models with a known σB as a function of mass, the upper limit on σB can be used to set a lower mass limit on the new resonance, e.g., for the benchmark W
SSM0model. Figures 2 and 3 show the predicted σB for the W
SSM0as a function of its mass. The resulting expected and observed lower limits on the W
SSM0mass are given in Table 2.
m
W0limit [TeV]
Decay Expected Observed
W
0→ eν 4.03 3.98
W
0→ µν 3.66 3.42
W
0→ `ν 4.18 4.07
Table 2: Expected and observed 95% CL lower limits on the W
SSM0mass in the electron and muon channel and their
combination.
[TeV]
m
W’1 2 3 4 5 6
B [pb] σ
4
10
− 310
− 210
− 110
−1 10
Expected limit 1σ Expected ±
2σ Expected ± Observed limit W’SSM
Preliminary ATLAS
= 13 TeV, 3.3 fb-1
s lν W’→
Run-I Limit