arXiv:1109.6606v2 [hep-ex] 28 Dec 2011
Submitted to Physical Review D
Search for supersymmetry in final states with jets, missing transverse momentum and one isolated lepton in √
s = 7 TeV pp collisions using 1 fb − 1 of ATLAS data
The ATLAS Collaboration
We present an update of a search for supersymmetry in final states containing jets, missing transverse momentum, and one isolated electron or muon, using 1.04 fb − 1 of proton-proton collision data at √
s = 7 TeV recorded by the ATLAS experiment at the LHC in the first half of 2011. The analysis is carried out in four distinct signal regions with either three or four jets and variations on the (missing) transverse momentum cuts, resulting in optimized limits for various supersymmetry models. No excess above the standard model background expectation is observed. Limits are set on the visible cross-section of new physics within the kinematic requirements of the search. The results are interpreted as limits on the parameters of the minimal supergravity framework, limits on cross-sections of simplified models with specific squark and gluino decay modes, and limits on parameters of a model with bilinear R-parity violation.
PACS numbers: 12.60.Jv, 13.85.Rm, 14.80.Ly
I. INTRODUCTION AND ANALYSIS OVERVIEW
Many extensions of the standard model predict the ex- istence of new colored particles, such as the squarks (˜ q) and gluinos (˜ g) of supersymmetric (SUSY) theories [1], which could be accessible at the LHC. The dominant SUSY production channels are assumed to be squark- (anti)squark, squark-gluino, and gluino-gluino pair pro- duction. Squarks and gluinos are expected to decay to quarks and gluons and the SUSY partners of the gauge bosons (charginos, ˜ χ ± , and neutralinos, ˜ χ 0 ), leading to events with energetic jets. In R-parity conserving SUSY models [2], the lightest supersymmetric particle (LSP) is stable and escapes detection, giving rise to events with significant missing transverse momentum. In de- cay chains with charginos (˜ q L → q χ ˜ ± , ˜ g → q¯ q ′ χ ˜ ± ), the chargino decay can produce a high-momentum lepton.
LHC results of searches for SUSY with 35 pb − 1 of data collected in 2010, in final states with zero, one, or two lep- tons (where leptons refer to either electrons or muons), can be found in Refs. [3–18]. First results obtained with 1 fb − 1 of data collected in 2011 have also been published for the no-lepton channel [19].
This paper reports on an update of a search for events with exactly one isolated high-transverse momentum (p T , relative to the beam direction) electron or muon, at least three high-p T jets, and significant missing transverse mo- mentum (E T miss ), using data collected by ATLAS in the first half of 2011. The analysis proceeds similarly to the analysis of the 2010 data [4], with a number of differ- ences. To cover a broader range of signals, the analy- sis has been extended from one signal search region to four. The kinematic requirements on leptons and jets have been modified, to accommodate changing trigger re- quirements, minimize the overlap with searches in other
final states, and optimize the sensitivity of the search.
As in the 2010 analysis, a combined fit to the observed number of events in signal and background control re- gions is used to search for an excess of events in the signal regions. The control regions normalize the back- grounds from W and t ¯ t production. To estimate these backgrounds in the signal regions, an extrapolation of the individual background components from the control to the signal regions is performed. This is done using transfer factors obtained from Monte Carlo (MC) sim- ulations that represent the expected ratio of events in the signal and control regions for the various background processes.
The selection cuts are optimized based on samples of simulated events. The cut optimization was per- formed not only in the MSUGRA/CMSSM (minimal su- pergravity/constrained Minimal Supersymmetric Stan- dard Model) framework [20, 21], but also for simpli- fied models characterizing specific SUSY production and decay modes. The results are interpreted in these MSUGRA/CMSSM and simplified model frameworks, as well as in a model with bilinear R-parity violation (bRPV) [22].
II. MODELS
In the MSUGRA/CMSSM model, supersymmetry is characterized by universal scalar and gaugino mass pa- rameters m 0 and m 1/2 and a universal trilinear coupling parameter A 0 , all expressed at the GUT scale, the ratio of the vacuum expectation values of the two Higgs dou- blets, tanβ , and the sign of the Higgs mixing parameter µ. In this paper, results are interpreted in terms of m 0
and m 1/2 for fixed values of A 0 = 0, tan β = 10, and
µ > 0. The interpretation is given for tan β = 10 rather
than for tan β = 3 as in our previous publication [4],
since tan β = 3 is increasingly disfavored by the results of direct Higgs boson searches. The influence of a vari- ation of A 0 on the results is very small, whereas high values of tan β (> 30) mostly affect the behavior of the third generation of squarks and sleptons, for which ded- icated analyses are developed. ISAJET [23] is used to calculate the SUSY particle mass spectrum at the elec- troweak scale. For illustration purposes, the expected sig- nal distributions of the MSUGRA/CMSSM model point m 0 = 500 GeV, m 1/2 = 330 GeV, which is close to the expected sensitivity limit, are shown in the figures of this paper.
Simplified models [24, 25] are characterized by well de- fined SUSY particle production and decay modes, and a minimal particle content for the final state under study.
This can be achieved by assuming that all SUSY particles not of interest to a specific model are very massive and decouple. In order to achieve a final state with leptons, the simplified models considered here contain a chargino decaying to the lightest neutralino (LSP) and an on-shell or off-shell W boson: ˜ χ ± → W (∗) χ ˜ 0 . The chargino arises from the decay of a squark or a gluino, via one of the following two models considered:
• In the mass hierarchy corresponding to sequential squark-chargino-neutralino decay, hereafter called the squark model, the decay chain ˜ q → q ′ χ ˜ ± → q ′ W (∗) χ ˜ 0 is assumed to have a 100% branch- ing fraction, and only first- and second-generation squark-squark and squark-antisquark production is considered. This is achieved by setting all other SUSY particle masses, including those of third gen- eration squarks, to multi-TeV values. This model is characterized by three free parameters: m q ˜ , m χ ˜
0, and x = (m χ ˜
±− m χ ˜
0)/(m q ˜ − m χ ˜
0).
• In the gluino-chargino-neutralino model, hereafter called gluino model, the decay chain ˜ g → q¯ q χ ˜ ± → q qW ¯ ( ∗ ) χ ˜ 0 is assumed to have a 100% branching fraction, and only gluino-gluino production is con- sidered. This is achieved by setting all other SUSY particle masses, including those of all squarks, to multi-TeV values. This model is also character- ized by three free parameters: m g ˜ , m χ ˜
0, and x = (m χ ˜
±− m χ ˜
0)/(m ˜ g − m χ ˜
0).
The assumption of massive third generation squarks in the squark model is motivated by the fact that the phe- nomenology of light third generation squarks (production of top and/or bottom squarks) is covered by a separate dedicated analysis [7]. For each choice of the three free parameters in the simplified models, the sparticle mass spectrum at the weak scale, and the sparticle decays are fully specified. Simplified models are used to identify the limits of the effectiveness of the search, characterize a possible excess in data, and derive limits. Constraints on a wide variety of models can be deduced from limits on simplified models [25].
The MSUGRA/CMSSM model and the simplified models assume R-parity conservation. Additionally, re- sults are interpreted in a model that allows for bilin- ear R-parity breaking terms in the superpotential [22].
Such terms lead to non-vanishing vacuum expectation values for the sneutrinos which in turn induce a mixing between neutrinos and neutralinos, thus providing a phe- nomenologically viable alternative to the origin of neu- trino mass and mixing [26, 27]. In the study presented here, the R-parity violating couplings are embedded in an MSUGRA/CMSSM SUSY production model. For a chosen set of MSUGRA parameters, the bRPV parame- ters are unambiguously determined under the tree-level dominance scenario [28] by fitting them to the neutrino oscillations data as described in Ref. [29]. The neutralino LSP is unstable and decays within the detector through decay modes that predominantly include neutrinos [30].
Such decays along with the presence of neutrinos in SUSY decay chains such as ˜ χ ± → ℓν χ ˜ 0 lead to significant miss- ing transverse momentum. However, this model was not used to optimize the selection. Only the muon selection is considered in this analysis since in the leptonic decays of the LSP, the electron channels are highly suppressed in favor of the µ- and τ-producing modes. Scenarios lead- ing to a long lifetime (cτ > ∼ 15 mm) of the LSP are not considered here.
III. THE ATLAS DETECTOR
ATLAS [31] is a particle physics detector with a forward-backward symmetric cylindrical geometry and near 4π coverage in solid angle [32]. The inner detec- tor (ID) consists of a silicon pixel detector, a silicon microstrip detector (SCT), and a transition radiation tracker (TRT). The ID is surrounded by a thin super- conducting solenoid providing a 2 T magnetic field, and by high-granularity liquid-argon (LAr) sampling electro- magnetic calorimeters. Hadron calorimetry is provided by an iron-scintillator tile calorimeter in the central ra- pidity range. The end-cap and forward regions are in- strumented with LAr calorimeters for both electromag- netic and hadronic measurements. The muon spectrome- ter (MS) is based on three large superconducting toroids arranged with an eight-fold azimuthal coil symmetry around the calorimeters, and a system of three stations of chambers for the trigger and chambers for precise mea- surements.
IV. MONTE CARLO SIMULATION
MC simulations are used to develop the analysis,
extrapolate backgrounds from the control to the sig-
nal regions, and to assess sensitivity to specific SUSY
signal models. Samples of W and Z/γ ∗ produc-
tion with accompanying jets are simulated with ALP-
GEN [33], using the CTEQ6L1 [34] parton density func-
tions (PDFs). Top quark pair production is simu- lated with MC@NLO [35] and the next-to-leading or- der (NLO) PDF set CTEQ6.6 [36], which is used for all NLO MC. Single top production is simulated with MC@NLO. Fragmentation and hadronisation for the ALPGEN and MC@NLO samples is performed with HERWIG [37], using JIMMY [38] for the underlying event. Diboson production is simulated with HERWIG, using the MRST2007LO* [39] modified leading-order PDFs. SUSY signal samples in the MSUGRA/CMSSM model and for the simplified models are generated with HERWIG++ [40], normalized using NLO cross-sections determined by PROSPINO [41]. The bRPV sparticle spectrum is calculated with SPHENO 3.1 [42, 43], the event generation is carried out by PYTHIA6 [44] and the NLO cross-sections are also provided by PROSPINO.
The MC samples are produced using an ATLAS param- eter tune of PYTHIA and HERWIG/JIMMY [45] and a GEANT4 [46] based detector simulation [47]. Detailed comparisons of MC predicted lepton reconstruction and identification efficiencies to the corresponding measure- ments from data are used to determine scale factors.
These scale factors obtained from specifically selected event samples, such as Z → ℓℓ, are then used to cor- rect the MC prediction of efficiencies and acceptances for both signal and background events. The MC samples are produced with a simulation of multiple interactions per LHC bunch crossing (pile-up). Differing pile-up con- ditions as a function of the instantaneous luminosity of the LHC machine are taken into account by reweighting MC events according to the mean number of interactions expected.
V. OBJECT RECONSTRUCTION
Collision events are selected by requiring a recon- structed primary vertex with at least five associated tracks, consistent with the beam spot position.
Electrons are reconstructed from clusters in the elec- tromagnetic calorimeter matched to a track in the in- ner detector [48]. Several requirements on the track and clusters are imposed to select true electrons. The
“medium” electron selection, used in this analysis to es- timate the contribution from non-isolated and misidenti- fied electrons and to veto on dileptonic events, is based on calorimeter shower shape, inner-detector track qual- ity, and track-to-calorimeter-cluster matching. Electrons in the final selection are required to pass the “tight”
electron definition, which adds a requirement on the ra- tio E/p, where E is the calorimeter cluster energy and p is the track momentum, and detection of transition radiation in the TRT. Furthermore, the electron is re- quired to be isolated: the p T sum of tracks within a cone of ∆R < 0.2 around the electron candidate (ex- cluding the electron candidate itself) is required to be less than 10% of the electron p T . All electrons are required to pass kinematic cuts of p T > 20 GeV and
| η | < 2.47. In addition, electrons with a distance to the closest jet of 0.2 < ∆R < 0.4 are discarded, where
∆R = p
(∆η) 2 + (∆φ) 2 . For “tight” electrons, the p T
requirement is raised to 25 GeV.
Preselected muons are either the result of a combined track in the muon spectrometer and in the inner detec- tor, or a muon spectrometer segment matching with an extrapolated inner detector track [49]. The matched in- ner detector track must have ≥ 1 hit in the pixel detec- tor, ≥ 1 hit in the inner layer of the pixel detector if the pixel detector module at that location is operational, ≥ 6 hits in the SCT, and fewer than two missing hits on the track in pixel and SCT detectors. For | η | < 1.9, at least 6 TRT hits are required, and the number of TRT hits that are classified as “outliers” must be less than 90% of the total number of TRT hits on the track. The latter cut is also applied if | η | ≥ 1.9 and at least 6 TRT hits are on the track. TRT outliers appear in two forms in the track reconstruction, as a straw tube with a signal but not crossed by the nearby track, or as a set of TRT measurements in the prolongation of a track which, how- ever, failed to form a smooth trajectory together with the pixel and SCT measurements. These quality cuts are put in place to suppress fake tracks and discriminate against muons from hadron decays. Muons with a dis- tance to the closest jet of ∆R < 0.4 are discarded. In order to reject muons resulting from cosmic rays, tight cuts are applied on the proximity of the muon trajecto- ries to the primary vertex (PV): | z µ − z PV | < 5 mm and d 0 < 2 mm, where z µ is the z coordinate of the extrapo- lated muon track at the point of closest approach to the primary vertex, z PV is the z coordinate of the primary vertex, and d 0 is the magnitude of the impact parameter of the muon in the transverse plane. These preselected muons, similar to the electron case, are used to quantify the contribution from non-isolated muons and to reject events with additional muons, and are required to have p T > 10 GeV, and | η | < 2.4. For muons in the final se- lection, the p T requirement is raised to 20 GeV, and the muon is required to be isolated: the p T sum of tracks within a cone of ∆R < 0.2 around the muon candidate (excluding the muon candidate itself) is required to be less than 1.8 GeV.
Jets are reconstructed using the anti-k t jet clustering algorithm [50] with a radius parameter of 0.4. The inputs to the jet algorithm are three-dimensional clusters formed from energy deposits in the calorimeter. The jets are calibrated using p T - and η-dependent correction factors based on MC simulation and validated by test beam and collision data studies [51]. Preselected jets are required to have p T > 20 GeV and | η | < 2.8. Events with jets not passing jet quality criteria against noise and non-collision backgrounds [52] are rejected. Jets within a distance
∆R < 0.2 of a preselected electron are rejected, since
these jets are likely to be electrons also reconstructed as
jets. For jets in the signal regions, the p T requirement
is tightened to 25 GeV and to remove jets that are not
associated with the hard scattering of interest, jets with
associated tracks are required to pass the selection that at least 75% of the summed p T of all associated tracks must come from tracks associated to the selected primary vertex.
The occurrence of a b-tagged jet in the final state is used to distinguish between t ¯ t and W events. The re- construction of b-tagged jets proceeds as for other jets, apart from the requirement that | η | < 2.5, and that a b- tagging algorithm exploiting both impact parameter and secondary vertex information [53] tags the jet. This algo- rithm has a 60% efficiency for tagging b-jets in a Monte Carlo sample of t ¯ t events, with a mistag rate for light quarks and gluons of less than 1%.
The missing transverse momentum E T miss in this anal- ysis is the opposite of the vectorial p T sum of recon- structed objects in the event, comprised of the jets with p T > 20 GeV, the selected lepton, any additional identi- fied non-isolated muons, and three-dimensional calorime- ter clusters with | η | < 4.5 not belonging to any of the aforementioned object types.
During a part of the data-taking period, an electron- ics failure in the LAr barrel EM calorimeter created a dead region in the second and third layers, correspond- ing to approximately 1.4 × 0.2 in ∆η × ∆φ. Events with an electron in this region are vetoed, leading to loss of signal efficiency of about 1%. The energy measurement for jets in the data in the problematic region is under- estimated. A correction to the jet energy is made using the energy depositions in the cells neighbouring the dead region, and this is also propagated to E T miss . The cor- rection to the jet energy amounts to a few percent for jets just touching the dead region and reaches 40 per- cent for jets in the center of the dead region. The con- tribution of jets in the dead region to E T miss can be es- timated and is denoted as E T miss (hole). Projecting this quantity on the direction of E T miss gives the quantity
∆E T miss (hole) = E T miss (hole) · cos ∆φ(jet, ~ E miss T ). Events with ∆E miss T (hole) > 10 GeV and ∆E T miss (hole)/E T miss >
0.1 are rejected. This requirement rejects less than 0.5%
of the events in the signal regions, and up to 2% of the events in the control regions.
In the event selection, a number of variables derived from the reconstructed objects are used. The transverse mass m T formed by E T miss and the p T of the lepton (ℓ) is defined as
m T = q
2 · p ℓ T · E T miss · (1 − cos(∆φ(~ℓ, ~ E T miss ))).
The effective mass m eff is obtained from objects in the event as the scalar sum
m eff = p ℓ T +
3(4)
X
i=1
p jet T
i+ E T miss ,
where p jet T
iare the transverse momenta of the three (four) leading jets.
VI. TRIGGER AND DATA SELECTION The data were collected between March and July 2011.
The trigger system selects events online by requiring an electron or muon trigger to fire. The electron trigger selects electrons that deposit an amount of energy corre- sponding to E T = E sin θ > 20 GeV in the calorimeter.
The muon trigger requirement determines a logical OR between a trigger that requires a muon with p T > 18 GeV and a trigger that requires a muon of looser quality with p T > 40 GeV in the barrel; the OR of these two triggers increases the trigger acceptance in the barrel. The trig- ger efficiency is measured in the data. To assure good data quality, only runs in which all subdetectors perform well are used, resulting in a data set corresponding to an integrated luminosity of 1.04 fb − 1 , with an estimated uncertainty of 3.7% [54].
VII. EVENT SELECTION
The kinematic selections start by requiring the pres- ence of exactly one lepton (electron or muon) with p T >
25 GeV in case of an electron and p T > 20 GeV for muons. If another lepton is reconstructed with p T >
20 GeV (“medium” electrons) or p T > 10 GeV (prese- lected muons), the event is rejected in order to minimize overlap with other analyses aimed at final states with higher lepton multiplicities.
At least three or four good jets with pseudorapidity
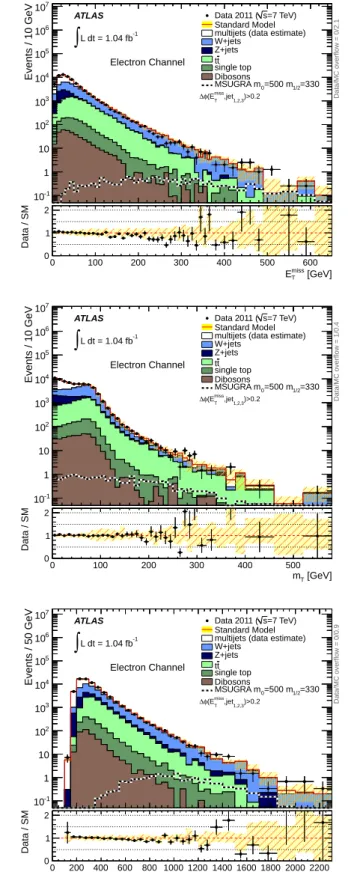
| η | < 2.8 are required, depending on the selection, as outlined below. Large mismeasurement of the jet trans- verse momenta are avoided by requiring that E miss T is not aligned with any of the three or four selected jets (∆φ(jet i , ~ E T miss ) > 0.2 ). Kinematic distributions after application of the lepton and jet selection requirements are shown in Figure 1 for at least three jets and Figure 2 for at least four jets.
A. Signal regions
Four different signal regions are defined to maximize the sensitivity to different kinematic configurations of su- persymmetric event topologies.
1. “Loose” 3-jet selection (3JL). The loose 3-jet se- lection is nearly identical to the selection used in the analysis of the 2010 data [4]. At least three jets, with p T > 60 GeV for the leading jet, and p T > 25 GeV for the other jets, are required. The transverse mass m T must exceed 100 GeV, and E T miss must be larger than 125 GeV. Two final cuts, E T miss /m eff > 0.25 and m eff > 500 GeV, define this signal region.
2. “Tight” 3-jet selection (3JT). In the tight 3-jet se-
lection, the requirement on the leading jet p T is
[GeV]
miss
E
T0 100 200 300 400 500 600
Data / SM
0 1 2
Events / 10 GeV
10
-11 10 10
210
310
410
510
610
7L dt = 1.04 fb
-1∫
ATLAS
Electron Channel
)>0.2
1,2,3 miss,jet (ET
φ
∆ Data/MC overflow = 0/2.1
=7 TeV) s Data 2011 ( Standard Model multijets (data estimate) W+jets
Z+jets t t single top Dibosons
1/2
=330
=500 m MSUGRA m
0[GeV]
miss
E
T0 100 200 300 400 500 600
Data / SM
0 1 2
Events / 10 GeV
10
-11 10 10
210
310
410
510
6 -1L dt = 1.04 fb
∫
ATLAS
Muon Channel
)>0.2
1,2,3 miss,jet (ET
φ
∆ Data/MC overflow = 1/0.2
=7 TeV) s Data 2011 ( Standard Model multijets (data estimate) W+jets
Z+jets t t single top Dibosons
1/2
=330
=500 m MSUGRA m
0[GeV]
m
T0 100 200 300 400 500
Data / SM
0 1 2
Events / 10 GeV
10
-11 10 10
210
310
410
510
610
7L dt = 1.04 fb
-1∫
ATLAS
Electron Channel
)>0.2
1,2,3 miss,jet (ET
φ
∆ Data/MC overflow = 1/0.4
=7 TeV) s Data 2011 ( Standard Model multijets (data estimate) W+jets
Z+jets t t single top Dibosons
1/2
=330
=500 m MSUGRA m
0[GeV]
m
T0 100 200 300 400 500
Data / SM
0 1 2
Events / 10 GeV
10
-11 10 10
210
310
410
510
6L dt = 1.04 fb
-1∫
ATLAS
Muon Channel
)>0.2
1,2,3 miss,jet (ET
φ
∆ Data/MC overflow = 1/0.8
=7 TeV) s Data 2011 ( Standard Model multijets (data estimate) W+jets
Z+jets t t single top Dibosons
1/2
=330
=500 m MSUGRA m
0[GeV]
m
eff0 200 400 600 800 1000 1200 1400 1600 1800 2000 2200
Data / SM
0 1 2
Events / 50 GeV
10
-11 10 10
210
310
410
510
610
7L dt = 1.04 fb
-1∫
ATLAS
Electron Channel
)>0.2
1,2,3 miss,jet (ET
φ
∆ Data/MC overflow = 0/0.9
=7 TeV) s Data 2011 ( Standard Model multijets (data estimate) W+jets
Z+jets t t single top Dibosons
1/2
=330
=500 m MSUGRA m
0[GeV]
m
eff0 200 400 600 800 1000 1200 1400 1600 1800 2000 2200
Data / SM
0 1 2
Events / 50 GeV
10
-11 10 10
210
310
410
510
610
7L dt = 1.04 fb
-1∫
ATLAS
Muon Channel
)>0.2
1,2,3 miss,jet (ET
φ
∆ Data/MC overflow = 0/0.6
=7 TeV) s Data 2011 ( Standard Model multijets (data estimate) W+jets
Z+jets t t single top Dibosons
1/2
=330
=500 m MSUGRA m
0FIG. 1: Distributions after requiring one electron with p T > 25 GeV or one muon with p T > 20 GeV, and at least three jets
with p T > 60, 25, 25 GeV and ∆φ(jet i , ~ E T miss ) > 0.2. The top row shows the missing transverse momentum, E T miss , the middle
row shows the transverse mass, m T , and the bottom row displays the effective mass, m eff . The electron channel is shown in
the left column, the muon channel is shown in the right column. The “Data/SM” plots show the ratio between data and the
summed standard model expectation. In these plots, the standard model expectation is derived from Monte Carlo simulations
only, normalized to the theoretical cross sections. The uncertainty band on the standard model expectation combines the MC
statistical uncertainty and systematic uncertainties on the jet energy scale and resolution, the lepton resolution and identification
efficiencies, pile-up and luminosity. For illustration, the expected signal distributions of the MSUGRA/CMSSM model point
m 0 = 500 GeV, m 1/2 = 330 GeV are also shown.
[GeV]
miss
E
T0 100 200 300 400 500 600
Data / SM
0 1 2
Events / 10 GeV
10
-11 10 10
210
310
410
510
6L dt = 1.04 fb
-1∫
ATLAS
Electron Channel
)>0.2
1,2,3,4 miss,jet (ET
φ
∆ Data/MC overflow = 0/0.6
=7 TeV) s Data 2011 ( Standard Model multijets (data estimate) W+jets
Z+jets t t single top Dibosons
1/2
=330
=500 m MSUGRA m
0[GeV]
miss
E
T0 100 200 300 400 500 600
Data / SM
0 1 2
Events / 10 GeV
10
-11 10 10
210
310
410
510
6L dt = 1.04 fb
-1∫
ATLAS
Muon Channel
)>0.2
1,2,3,4 miss,jet (ET
φ
∆ Data/MC overflow = 0/0.2
=7 TeV) s Data 2011 ( Standard Model multijets (data estimate) W+jets
Z+jets t t single top Dibosons
1/2
=330
=500 m MSUGRA m
0[GeV]
m
T0 50 100 150 200 250 300 350
Data / SM
0 1 2
Events / 10 GeV
10
-11 10 10
210
310
410
510
6L dt = 1.04 fb
-1∫
ATLAS
Electron Channel
)>0.2
1,2,3,4 miss,jet (ET
φ
∆ Data/MC overflow = 1/2.2
=7 TeV) s Data 2011 ( Standard Model multijets (data estimate) W+jets
Z+jets t t single top Dibosons
1/2
=330
=500 m MSUGRA m
0[GeV]
m
T0 50 100 150 200 250 300 350
Data / SM
0 1 2
Events / 10 GeV
10
-11 10 10
210
310
410
510
6L dt = 1.04 fb
-1∫
ATLAS
Muon Channel
)>0.2
1,2,3,4 miss,jet (ET
φ
∆ Data/MC overflow = 0/3.9
=7 TeV) s Data 2011 ( Standard Model multijets (data estimate) W+jets
Z+jets t t single top Dibosons
1/2
=330
=500 m MSUGRA m
0[GeV]
m
eff0 200 400 600 800 1000 1200 1400 1600 1800 2000 2200
Data / SM
0 1 2
Events / 50 GeV
10
-11 10 10
210
310
410
510
6L dt = 1.04 fb
-1∫
ATLAS
Electron Channel
)>0.2
1,2,3,4 miss,jet (ET
φ
∆ Data/MC overflow = 0/0.1
=7 TeV) s Data 2011 ( Standard Model multijets (data estimate) W+jets
Z+jets t t single top Dibosons
1/2
=330
=500 m MSUGRA m
0[GeV]
m
eff0 200 400 600 800 1000 1200 1400 1600 1800 2000
Data / SM
0 1 2
Events / 50 GeV
10
-11 10 10
210
310
410
510
6L dt = 1.04 fb
-1∫
ATLAS
Muon Channel
)>0.2
1,2,3,4 miss,jet (ET
φ
∆ Data/MC overflow = 0/0.0
=7 TeV) s Data 2011 ( Standard Model multijets (data estimate) W+jets
Z+jets t t single top Dibosons
1/2
=330
=500 m MSUGRA m
0FIG. 2: Distributions after requiring one electron with p T > 25 GeV or one muon with p T > 20 GeV, and at least four jets
with p T > 60, 25, 25, 25 GeV and ∆φ(jet i , ~ E T miss ) > 0.2. The top row shows the missing transverse momentum, the middle row
shows the transverse mass, and the bottom row displays the effective mass. The electron channel is shown in the left column,
the muon channel is shown in the right column. The “Data/SM” plots show the ratio between data and the summed standard
model expectation. In these plots, the standard model expectation is derived from Monte Carlo simulations only, normalized to
the theoretical cross sections. The uncertainty band on the standard model expectation combines the MC statistical uncertainty
and systematic uncertainties on the jet energy scale and resolution, the lepton resolution and identification efficiencies, pile-up
and luminosity. For illustration, the expected signal distributions of the MSUGRA/CMSSM model point m 0 = 500 GeV,
m 1/2 = 330 GeV are also shown.
raised to 80 GeV. In addition to these cuts, the following criteria are applied: m T > 100 GeV, E T miss > 240 GeV, E T miss /m eff > 0.15 and m eff >
600 GeV.
3. “Loose” 4-jet selection (4JL). Four jets with p T >
25 GeV are required, with at least one of them ex- ceeding 60 GeV. In addition to the jet cuts, the se- lection requires: m T > 100 GeV, E miss T > 140 GeV, E T miss /m eff > 0.30 and m eff > 300 GeV.
4. “Tight” 4-jet selection (4JT). A tight selection with at least four jets is defined. The p T requirement on the non-leading jets is raised to 40 GeV, whereas the leading jet is still required to pass p T > 60 GeV.
To define this signal region, three more criteria are imposed: E T miss > 200 GeV, E T miss /m eff > 0.15 and m eff > 500 GeV.
The “tight” signal regions are optimized for the MSUGRA/CMSSM model, which is characterized by en- ergetic jets and large missing transverse momentum. The
“loose” signal regions perform better for the simplified models with compressed particle spectra, i.e. when the LSP mass approaches the squark or gluino mass. The 3- jet selection is optimized for squark-squark and squark- antisquark production, the 4-jet selection is better suited for squark-gluino and gluino-gluino production.
B. Control regions
Two classes of control regions (CR) are defined, i.e.
separate control regions for the 3-jet and the 4-jet selec- tions. The requirements on the lepton and the jets in the control regions are identical to those in the signal regions.
1. W +jets control regions (WR). W +jets control re- gions are defined by requiring 30 GeV < E T miss <
80 GeV, 40 GeV < m T < 80 GeV, and that none of the three or four jets with the highest p T is tagged as a b-jet.
2. Top control regions (TR). Top control regions are defined by identical cuts on E T miss and m T as for the W +jets control regions, but requiring at least one b-tagged jet among the three or four jets with the highest p T .
The jet requirements are identical to the ones of the
“loose” signal regions. In addition, a cut on m eff is applied to both classes of control regions, again corre- sponding to the cut of the “loose” signal regions: m eff >
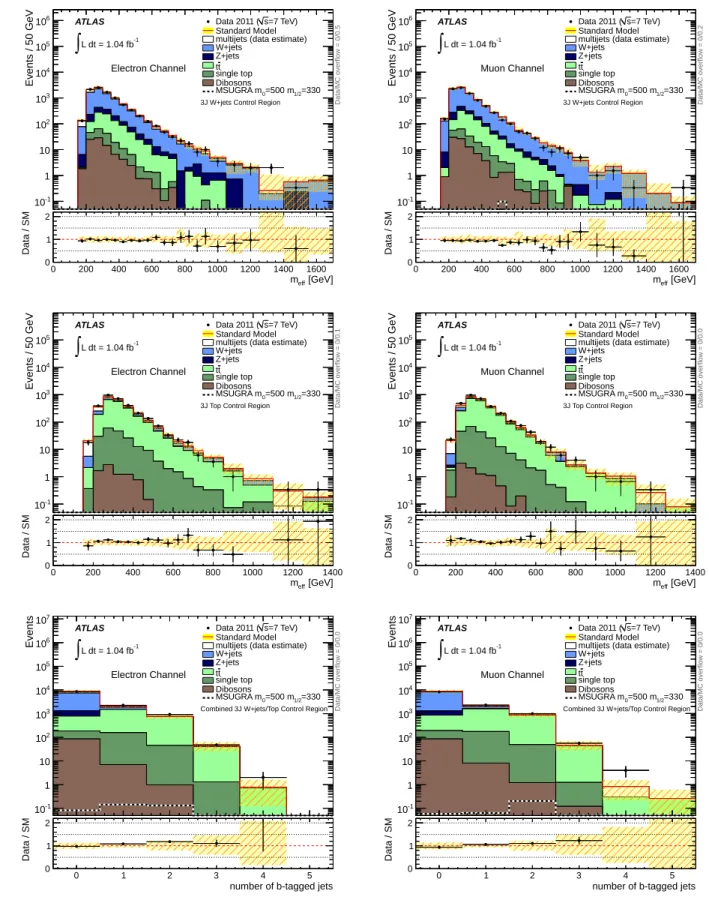
500 GeV for the 3-jet selection, and m eff > 300 GeV for the 4-jet selection. Figure 3 shows distributions of m eff
and the number of b-tagged jets for events in the W +jets and top control regions for the electron and muon chan- nel applying the 3-jet selection. The distributions of m eff
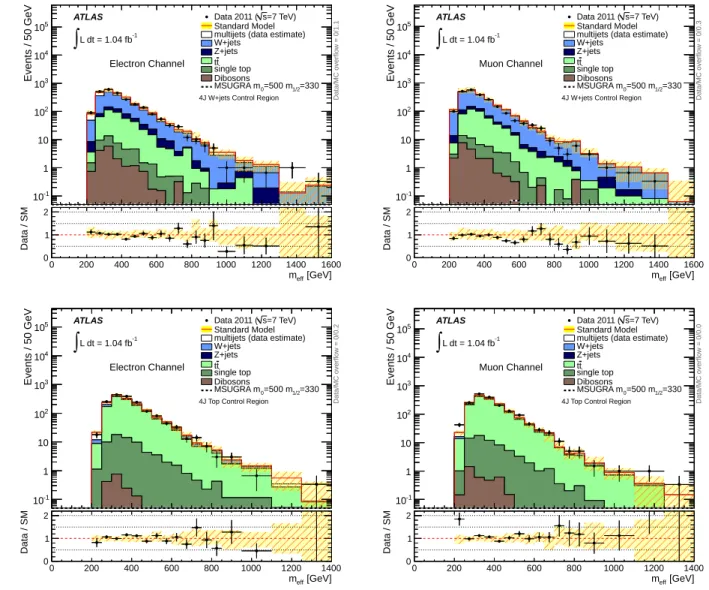
in the 4-jet control regions are shown in Fig. 4. The MC simulation describes the data well.
VIII. BACKGROUND ESTIMATION The multijet background is estimated from the data in the signal regions and in the W +jets and top control regions, using a matrix method. This background orig- inates from jets misidentified as leptons, but also from non-isolated real leptons, for example from heavy flavor decay. In this paper, both components are collectively called misidentified leptons. For all regions, multijet- dominated samples are defined by loosening the lepton identification criteria: for electrons the “medium” cri- teria are used instead of the “tight” criteria [48], and for both electrons and muons the isolation criterion is dropped. Defining N pass and N fail as the number of events in such a loose sample passing or failing the final lepton selection criteria, and defining N real and N misid.
as the number of real and the number of misidentified leptons, the following equations hold:
N pass = ǫ real N real + ǫ misid. N misid. ,
N fail = (1 − ǫ real )N real + (1 − ǫ misid. )N misid. , where ǫ real is the relative identification efficiency for real leptons, and ǫ misid. is the misidentification efficiency for misidentified leptons. Solving the equations leads to:
N misid. pass = ǫ misid. N misid. = N fail − (1/ǫ real − 1)N pass
1/ǫ misid. − 1/ǫ real
. The efficiency ǫ real is taken from simulated Z → ee events (electron channel) or t ¯ t and W +jets events (muon chan- nel). The efficiency ǫ misid. is determined from data con- trol samples enriched in multijet events, selected as fol- lows. For the electron channel “medium” electrons with p T > 20 GeV are required. In addition, one jet with p T > 30 GeV needs to be present in the event. To sup- press W and t t ¯ contributions, an upper cut of 30 GeV is imposed on E T miss . For the determination of the multi- jet background in the top CR, a b-tag is required for at least one of the selected jets. For the muon final state, the multijet control region is defined by one preselected muon with p T > 20 GeV, one jet with p T > 60 GeV and E miss T < 30 GeV. These control samples are corrected for contamination by real leptons, which amounts to about 9% for muons, and less than 3% for electrons. The misidentification efficiency ǫ misid. is measured as func- tion of p T and η and this dependence is considered in the determination of the multijet contribution in both the signal and control regions. Typical values for ǫ real and ǫ misid. are 88% and 10%, respectively, for the electron channel, and 98% and 35%, respectively, for the muon channel.
A normalisation of the W +jets and top backgrounds
to the data is performed in the W +jets and top control
regions. Assuming that the shape of the distributions is
described correctly by the Monte Carlo simulation, trans-
fer factors C iR j → SR from control region iR (i =W, T) to
[GeV]
m
eff0 200 400 600 800 1000 1200 1400 1600
Data / SM
0 1 2
Events / 50 GeV
10
-11 10 10
210
310
410
510
6L dt = 1.04 fb
-1∫
ATLAS
Electron Channel
3J W+jets Control Region Data/MC overflow = 0/0.5
=7 TeV) s Data 2011 ( Standard Model multijets (data estimate) W+jets
Z+jets t t single top Dibosons
1/2
=330
=500 m MSUGRA m
0[GeV]
m
eff0 200 400 600 800 1000 1200 1400 1600
Data / SM
0 1 2
Events / 50 GeV
10
-11 10 10
210
310
410
510
6L dt = 1.04 fb
-1∫
ATLAS
Muon Channel
3J W+jets Control Region Data/MC overflow = 0/0.2
=7 TeV) s Data 2011 ( Standard Model multijets (data estimate) W+jets
Z+jets t t single top Dibosons
1/2
=330
=500 m MSUGRA m
0[GeV]
m
eff0 200 400 600 800 1000 1200 1400
Data / SM
0 1 2
Events / 50 GeV
10
-11 10 10
210
310
410
5 -1L dt = 1.04 fb
∫
ATLAS
Electron Channel
3J Top Control Region Data/MC overflow = 0/0.1
=7 TeV) s Data 2011 ( Standard Model multijets (data estimate) W+jets
Z+jets t t single top Dibosons
1/2
=330
=500 m MSUGRA m
0[GeV]
m
eff0 200 400 600 800 1000 1200 1400
Data / SM
0 1 2
Events / 50 GeV
10
-11 10 10
210
310
410
5 -1L dt = 1.04 fb
∫
ATLAS
Muon Channel
3J Top Control Region Data/MC overflow = 0/0.0
=7 TeV) s Data 2011 ( Standard Model multijets (data estimate) W+jets
Z+jets t t single top Dibosons
1/2
=330
=500 m MSUGRA m
0number of b-tagged jets
0 1 2 3 4 5
Data / SM
0 1 2
Events
10
-11 10 10
210
310
410
510
610
7L dt = 1.04 fb
-1∫
ATLAS
Electron Channel
Combined 3J W+jets/Top Control Region Data/MC overflow = 0/0.0
=7 TeV) s Data 2011 ( Standard Model multijets (data estimate) W+jets
Z+jets t t single top Dibosons
1/2
=330
=500 m MSUGRA m
0number of b-tagged jets
0 1 2 3 4 5
Data / SM
0 1 2
Events
10
-11 10 10
210
310
410
510
610
7L dt = 1.04 fb
-1∫
ATLAS
Muon Channel
Combined 3J W+jets/Top Control Region Data/MC overflow = 0/0.0
=7 TeV) s Data 2011 ( Standard Model multijets (data estimate) W+jets
Z+jets t t single top Dibosons
1/2
=330
=500 m MSUGRA m
0FIG. 3: Distributions for events in the lepton plus three jets control regions for the electron channel (left column) and muon
channel (right column). Top row: effective mass in the W +jets control region. Middle row: effective mass in the top control
region. Bottom row: number of b-tagged jets in the combined W +jets and top control regions. The “Data/SM” plots show the
ratio between data and the summed standard model expectation. The uncertainty band on the standard model expectation
combines the MC statistical uncertainty and systematic uncertainties on the jet energy scale and resolution, b-tagging, the
lepton resolution and identification efficiencies, pile-up and luminosity.
[GeV]
m
eff0 200 400 600 800 1000 1200 1400 1600
Data / SM
0 1 2
Events / 50 GeV
10
-11 10 10
210
310
410
5L dt = 1.04 fb
-1∫
ATLAS
Electron Channel
4J W+jets Control Region Data/MC overflow = 0/1.1
=7 TeV) s Data 2011 ( Standard Model multijets (data estimate) W+jets
Z+jets t t single top Dibosons
1/2
=330
=500 m MSUGRA m
0[GeV]
m
eff0 200 400 600 800 1000 1200 1400 1600
Data / SM
0 1 2
Events / 50 GeV
10
-11 10 10
210
310
410
5L dt = 1.04 fb
-1∫
ATLAS
Muon Channel
4J W+jets Control Region Data/MC overflow = 0/0.3
=7 TeV) s Data 2011 ( Standard Model multijets (data estimate) W+jets
Z+jets t t single top Dibosons
1/2
=330
=500 m MSUGRA m
0[GeV]
m
eff0 200 400 600 800 1000 1200 1400
Data / SM
0 1 2
Events / 50 GeV
10
-11 10 10
210
310
410
5L dt = 1.04 fb
-1∫
ATLAS
Electron Channel
4J Top Control Region Data/MC overflow = 0/0.2
=7 TeV) s Data 2011 ( Standard Model multijets (data estimate) W+jets
Z+jets t t single top Dibosons
1/2
=330
=500 m MSUGRA m
0[GeV]
m
eff0 200 400 600 800 1000 1200 1400
Data / SM
0 1 2
Events / 50 GeV
10
-11 10 10
210
310
410
5L dt = 1.04 fb
-1∫
ATLAS
Muon Channel
4J Top Control Region Data/MC overflow = 0/0.0
=7 TeV) s Data 2011 ( Standard Model multijets (data estimate) W+jets
Z+jets t t single top Dibosons
1/2
=330
=500 m MSUGRA m
0FIG. 4: Distributions for events in the lepton plus four jets control regions for the electron channel (left column) and muon
channel (right column). Top row: effective mass in the W +jets control region. Bottom row: effective mass in the top control
region. The “Data/SM” plots show the ratio between data and the summed standard model expectation. The uncertainty
band on the standard model expectation combines the MC statistical uncertainty and systematic uncertainties on the jet energy
scale and resolution, b-tagging, the lepton resolution and identification efficiencies, pile-up and luminosity.
signal region SR for background type j (j = W +jets, top) can be defined:
C iR j → SR = N MC,j SR N MC,j iR .
Thus the predicted contribution for background type j in the signal region is given by
N pred.j SR = X
i=W,T
(N data iR × C iR j → SR ).
Typical values for the transfer factors are C WR→SR W = 0.023 (0.007) and C TR→SR t ¯ t = 0.040 (0.023) for the elec- tron channel and the 3JT (4JL) selection. The control regions are not 100% pure, and cross-contamination of backgrounds in the various control regions is taken into account. The solution of the coupled equations is per- formed in a combined fit to each signal region and the corresponding WR and TR control regions. The esti- mated backgrounds include contributions from dileptonic events with an undetected lepton as well as top quark or W +jets production with leptonic tau decays.
The assumption that the MC simulation is able to pre- dict the backgrounds in the signal regions from the con- trol regions is validated by checking additional control re- gions at low m T and high E miss T , or at low E T miss and high m T . Since these additional control regions have differ- ent kinematics and composition than the nominal ones, these regions are susceptible to react differently to any mismodeling of the data. In each region, the observed number of events is compared to the prediction of the nominal background fit. In these 28 additional control regions, only one is found where the difference between expected and observed events exceeds 2σ.
Possible contamination from events originating from cosmic ray muons is estimated by loosening the | z µ − z PV | < 5 mm requirement and studying the z µ distri- bution, and is found to be negligible. Remaining back- grounds from single top and diboson production are es- timated with MC simulation, and are also found to be negligible.
IX. SYSTEMATIC UNCERTAINTIES In this analysis systematic uncertainties arise on the estimates of the background in the signal regions, as well as on the estimate of the SUSY signal itself. The pri- mary sources of systematic uncertainty are the jet energy scale (JES) calibration, the jet energy resolution (JER) uncertainty, theory and MC modeling uncertainties, and uncertainties on object reconstruction and identification.
The JES uncertainty has been measured from the com- plete 2010 data set using the techniques described in Ref. [55]. Additional contributions to the JES uncer- tainty are added to account for the effect of pile-up at the relatively high luminosity delivered by the LHC in
the 2011 run. The JES and JER calibrations are ap- plied to MC simulated jets, and their uncertainties are propagated throughout the analysis, including to E T miss .
The JER measured with 2010 data [56] is applied to all MC simulated jets. The difference in the JER between the re-calibrated and nominal MC simulation is taken as the systematic uncertainty. Additional contributions are added to account for pile-up in 2011.
MC modeling uncertainties, affecting the transfer fac- tors, are derived from alternative MC samples with dif- ferent generators, or with different generator parameters.
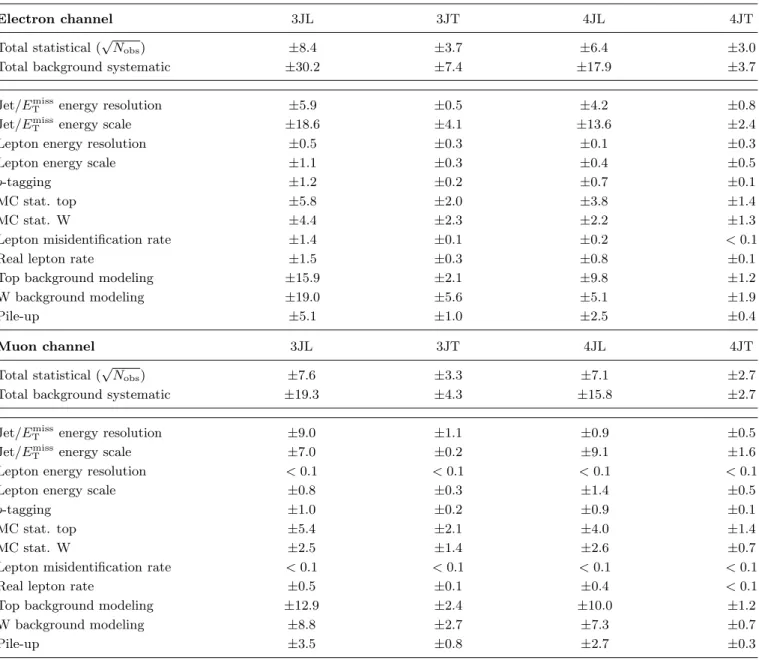
Apart from jet energy scale, jet energy resolution and MC modeling uncertainties, further uncertainties on the background estimates originate from finite MC statistics of top and W +jets events, from lepton en- ergy/momentum scale and resolution uncertainties, from uncertainty in the lepton misidentification rates, from the identification efficiencies for real leptons, and from b-tagging uncertainties. The uncertainties on the back- ground estimates are summarized in Table I.
Systematic uncertainties on the SUSY signal are esti- mated through variation of the factorisation and renor- malisation scales in PROSPINO between half and twice their default values, by considering variations in α s , and by considering the PDF uncertainties provided by CTEQ6. Uncertainties are calculated for individual SUSY production processes. In the relevant regions of parameter space in the MSUGRA/CMSSM model, these theoretical uncertainties on the signal cross-sections are typically 20 − 30%. Further uncertainties on the number of predicted signal events arise from the JES uncertainty (1 − 10%), the JER uncertainty (1 − 10%), pile-up un- certainties (1 − 10%), lepton trigger and identification uncertainties (1 − 4%), the uncertainty on the luminos- ity (3.7%) and finite statistics of the signal Monte Carlo samples ( ∼ 15%). Uncertainties in the modeling of ini- tial state radiation in signal events affect the uncertainty of the acceptance for low values of squark and/or gluino masses, and for small mass differences in the simplified models. These uncertainties are estimated from varia- tions of MC generator parameters as well as by explicitly generating ˜ g˜ g+jet and ˜ q˜ q+jet events with a matrix ele- ment approach as implemented in MadGraph 5 [57]. Re- sulting uncertainties vary from negligible at high masses and high mass splittings, to ∼ 30% at low masses and low mass splittings.
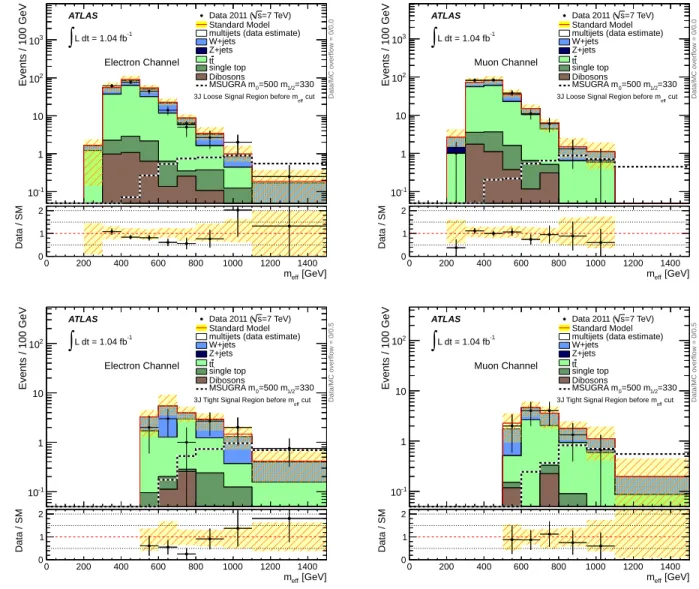
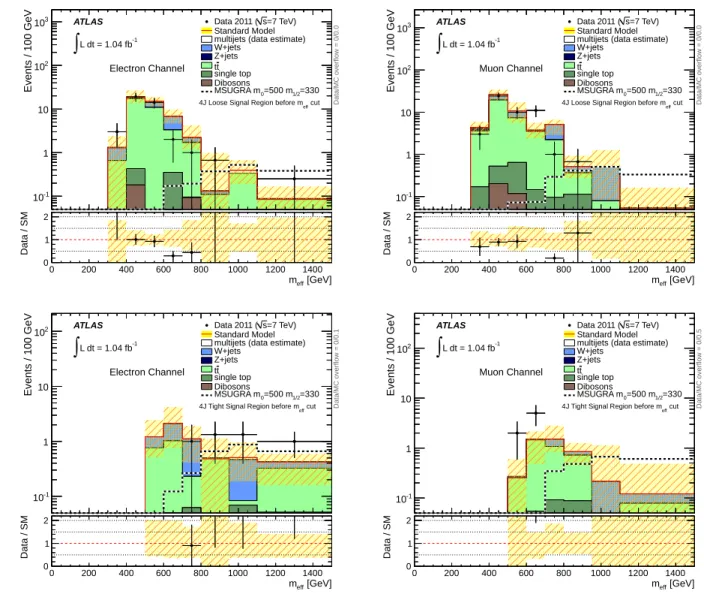
X. RESULTS AND INTERPRETATION Figures 5 and 6 show the distributions of the effective mass in the 3-jet and 4-jet signal regions, respectively, after application of the final selection criteria described in Section VII A, except for the cut on m eff itself.
As discussed in Section VIII, a combined fit to the
number of observed events in the signal and control re-
gions is performed. The fit is performed for the four sig-
nal regions individually. The likelihood function of the
TABLE I: Breakdown, in number of events, of the dominant systematic uncertainties on background estimates in the various signal regions. Note that the nuisance parameters of individual uncertainties can be correlated in the fit, and therefore their uncertainties do not necessarily add quadratically to the total background uncertainty.
Electron channel 3JL 3JT 4JL 4JT
Total statistical ( √
N obs ) ± 8.4 ± 3.7 ± 6.4 ± 3.0
Total background systematic ± 30.2 ± 7.4 ± 17.9 ± 3.7
Jet/E miss T energy resolution ± 5.9 ± 0.5 ± 4.2 ± 0.8
Jet/E miss T energy scale ± 18.6 ± 4.1 ± 13.6 ± 2.4
Lepton energy resolution ± 0.5 ± 0.3 ± 0.1 ± 0.3
Lepton energy scale ± 1.1 ± 0.3 ± 0.4 ± 0.5
b-tagging ± 1.2 ± 0.2 ± 0.7 ± 0.1
MC stat. top ± 5.8 ± 2.0 ± 3.8 ± 1.4
MC stat. W ± 4.4 ± 2.3 ± 2.2 ± 1.3
Lepton misidentification rate ± 1.4 ± 0.1 ± 0.2 < 0.1
Real lepton rate ± 1.5 ± 0.3 ± 0.8 ± 0.1
Top background modeling ± 15.9 ± 2.1 ± 9.8 ± 1.2
W background modeling ± 19.0 ± 5.6 ± 5.1 ± 1.9
Pile-up ± 5.1 ± 1.0 ± 2.5 ± 0.4
Muon channel 3JL 3JT 4JL 4JT
Total statistical ( √
N obs ) ± 7.6 ± 3.3 ± 7.1 ± 2.7
Total background systematic ± 19.3 ± 4.3 ± 15.8 ± 2.7
Jet/E miss T energy resolution ± 9.0 ± 1.1 ± 0.9 ± 0.5
Jet/E miss T energy scale ± 7.0 ± 0.2 ± 9.1 ± 1.6
Lepton energy resolution < 0.1 < 0.1 < 0.1 < 0.1
Lepton energy scale ± 0.8 ± 0.3 ± 1.4 ± 0.5
b-tagging ± 1.0 ± 0.2 ± 0.9 ± 0.1
MC stat. top ± 5.4 ± 2.1 ± 4.0 ± 1.4
MC stat. W ± 2.5 ± 1.4 ± 2.6 ± 0.7
Lepton misidentification rate < 0.1 < 0.1 < 0.1 < 0.1
Real lepton rate ± 0.5 ± 0.1 ± 0.4 < 0.1
Top background modeling ± 12.9 ± 2.4 ± 10.0 ± 1.2
W background modeling ± 8.8 ± 2.7 ± 7.3 ± 0.7
Pile-up ± 3.5 ± 0.8 ± 2.7 ± 0.3
fit is written as:
L( n | s, b , θ ) = P S × P W × P T × C Syst ,
where n represents the number of observed events in data, s is the SUSY signal to be tested, b is the back- ground, and θ represents the systematic uncertainties, which are treated as nuisance parameters with a Gaus- sian probability density function. The three P functions in the right hand side are Poisson probability distribu- tions for event counts in the defined signal (S) and con- trol regions (W and T, for W and top pair, respectively) and C Syst represents the constraints on systematic un- certainties. Systematic uncertainties can be correlated
between the signal and control regions. The determina- tion of the multijet contribution to the various regions, with the method described in Section VIII, is performed as part of the fit procedure.
In “discovery mode”, the number of SUSY signal events in the signal regions is left free in the fit, as well as the background normalisations and nuisance parameters.
Possible signal contamination in the control regions is ig-
nored. This fit tests the standard model hypothesis in
the signal regions, and quantifies any possible excess of
events above the background-only expectation in the sig-
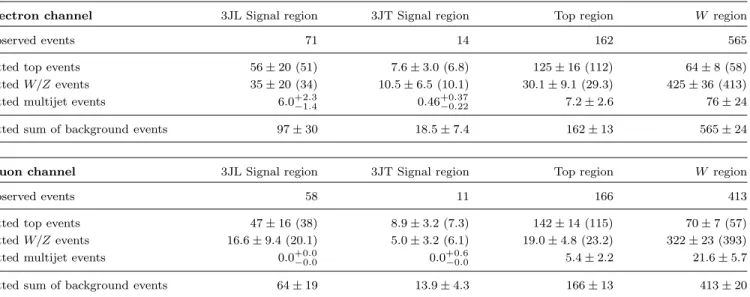
nal regions. The results of the “discovery fit” are shown
in Tables II and III. Note that for the control regions, by
[GeV]
m
eff0 200 400 600 800 1000 1200 1400
Data / SM
0 1 2
Events / 100 GeV
10
-11 10 10
210
3L dt = 1.04 fb
-1∫
ATLAS
Electron Channel
eff cut 3J Loose Signal Region before m Data/MC overflow = 0/0.0
=7 TeV) s Data 2011 ( Standard Model multijets (data estimate) W+jets
Z+jets t t single top Dibosons
1/2
=330
=500 m MSUGRA m
0[GeV]
m
eff0 200 400 600 800 1000 1200 1400
Data / SM
0 1 2
Events / 100 GeV
10
-11 10 10
210
3∫ L dt = 1.04 fb
-1ATLAS
Muon Channel
eff cut 3J Loose Signal Region before m Data/MC overflow = 0/0.0
=7 TeV) s Data 2011 ( Standard Model multijets (data estimate) W+jets
Z+jets t t single top Dibosons
1/2
=330
=500 m MSUGRA m
0[GeV]
m
eff0 200 400 600 800 1000 1200 1400
Data / SM
0 1 2
Events / 100 GeV
10
-11 10 10
2L dt = 1.04 fb
-1∫
ATLAS
Electron Channel
eff cut 3J Tight Signal Region before m Data/MC overflow = 0/0.5
=7 TeV) s Data 2011 ( Standard Model multijets (data estimate) W+jets
Z+jets t t single top Dibosons
1/2
=330
=500 m MSUGRA m
0[GeV]
m
eff0 200 400 600 800 1000 1200 1400
Data / SM
0 1 2
Events / 100 GeV
10
-11 10
10
2∫ L dt = 1.04 fb
-1ATLAS
Muon Channel
eff cut 3J Tight Signal Region before m Data/MC overflow = 0/0.5
=7 TeV) s Data 2011 ( Standard Model multijets (data estimate) W+jets
Z+jets t t single top Dibosons
1/2
=330
=500 m MSUGRA m
0FIG. 5: Distributions of the effective mass for events in the 3-jet signal regions 3JL (top) and 3JT (bottom) for the electron channel (left) and the muon channel (right), after application of the final selection criteria described in Section VII A, except for the cut on m eff itself. The “Data/SM” plots show the ratio between data and the summed standard model expectation. The uncertainty band on the standard model expectation combines the MC statistical uncertainty and systematic uncertainties on the jet energy scale and resolution, the lepton resolution and identification efficiencies, pile-up and luminosity. For illustration, the expected signal distributions of the MSUGRA/CMSSM model point m 0 = 500 GeV, m 1/2 = 330 GeV are also shown.
construction, the number of “fitted” background events equals the number of observed events. The observed number of events in data is consistent with the standard model expectation. The last column in Table IV shows the p − values of the discovery fit to data (p(s = 0) for the no-signal hypothesis) for the individual electron and muon channels.
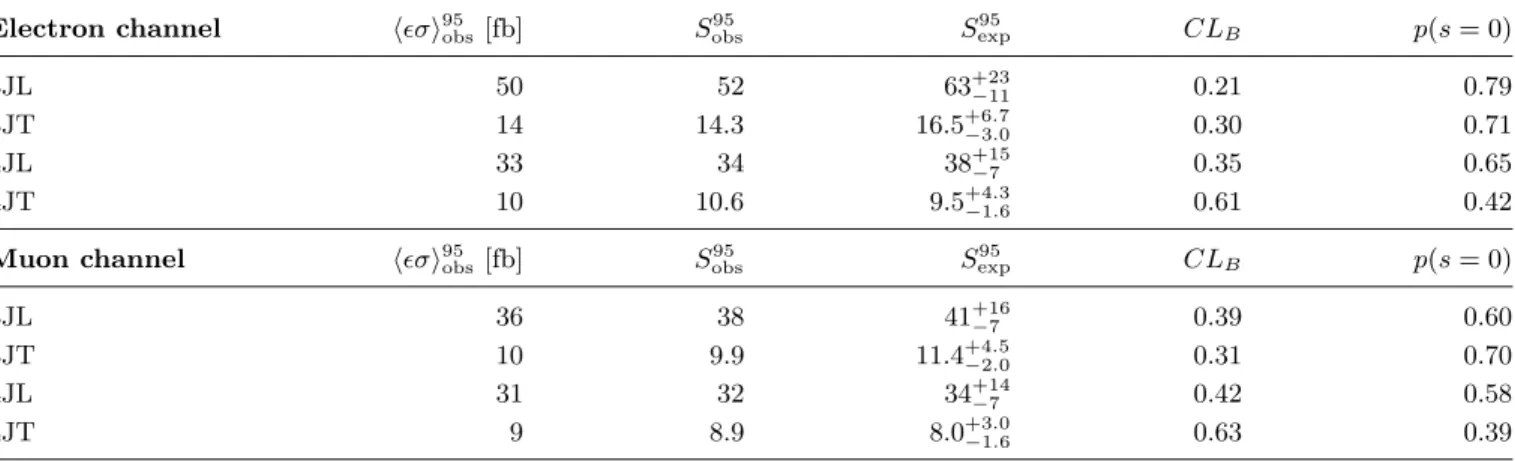
Model-independent upper limits on new physics contri- butions to (only) the signal regions can be derived from the discovery fit results. The ignorance of possible sig- nal contamination in the control regions in the discovery fit leads to conservative upper limits on non-standard model contributions. The limits are derived using the CL s method [58] based on the profile likelihood ratio test
statistic [59], Λ(s) = − 2(ln L( n | s, b ˆ ˆ , ˆ ˆ θ ) − ln L( n | ˆ s, b ˆ , θ ˆ )), where ˆ s, ˆ b and ˆ θ maximize the likelihood function and b ˆ ˆ and ˆ ˆ θ maximize the likelihood for a given choice of s. In the fit, s and ˆ s are constrained to be non-negative. The resulting 95% confidence level (CL) limits are shown in Table IV as observed and expected upper limits on the number of non-SM events in the signal regions, as well as upper limits on the visible cross-section (which equals the limit on the observed number of signal events divided by the integrated luminosity).
Limits within the MSUGRA/CMSSM framework are derived from a second fit to signal and control regions, in
“exclusion mode”. This fit mode tests for a specific new
[GeV]
m
eff0 200 400 600 800 1000 1200 1400
Data / SM
0 1 2
Events / 100 GeV
10
-11 10 10
210
3L dt = 1.04 fb
-1∫
ATLAS
Electron Channel
eff cut 4J Loose Signal Region before m Data/MC overflow = 0/0.0
=7 TeV) s Data 2011 ( Standard Model multijets (data estimate) W+jets
Z+jets t t single top Dibosons
1/2
=330
=500 m MSUGRA m
0[GeV]
m
eff0 200 400 600 800 1000 1200 1400
Data / SM
0 1 2
Events / 100 GeV
10
-11 10 10
210
3L dt = 1.04 fb
-1∫
ATLAS
Muon Channel
eff cut 4J Loose Signal Region before m Data/MC overflow = 0/0.0
=7 TeV) s Data 2011 ( Standard Model multijets (data estimate) W+jets
Z+jets t t single top Dibosons
1/2
=330
=500 m MSUGRA m
0[GeV]
m
eff0 200 400 600 800 1000 1200 1400
Data / SM
0 1 2
Events / 100 GeV
10
-11 10 10
2L dt = 1.04 fb
-1∫
ATLAS
Electron Channel
eff cut 4J Tight Signal Region before m Data/MC overflow = 0/0.1
=7 TeV) s Data 2011 ( Standard Model multijets (data estimate) W+jets
Z+jets t t single top Dibosons
1/2
=330
=500 m MSUGRA m
0[GeV]
m
eff0 200 400 600 800 1000 1200 1400
Data / SM
0 1 2
Events / 100 GeV
10
-11 10
10
2∫ L dt = 1.04 fb
-1ATLAS
Muon Channel
eff cut 4J Tight Signal Region before m Data/MC overflow = 0/0.5
=7 TeV) s Data 2011 ( Standard Model multijets (data estimate) W+jets
Z+jets t t single top Dibosons
1/2