ATLAS-CONF-2012-096 09July2012
ATLAS NOTE
ATLAS-CONF-2012-096
July 2, 2012
Search for top-jet resonances in the lepton + jets channel of t ¯ t + jets events with the ATLAS detector in 4.7 fb
−1of pp collisions at √
s = 7 TeV
The ATLAS Collaboration
Abstract
This note presents a search for a heavy new particle
Xproduced singly in association with a
t(¯t) quark. The new particle decays to a ¯t(t) quark and a light flavor quark, leadingto a color singlet (triplet) resonance in the ¯
t(t)+ jsystem of the
t¯t+jets signature. The full 2011 ATLAS
ppcollisions dataset from the LHC (4.7 fb
−1) is used to select
t¯tevents produced in association with jets, in which one of the
Wbosons from the top quark decays leptonically and the other decays hadronically. The data are consistent with the Standard Model expectation and a new particle with mass below 350 (430) GeV for
W0(color triplet) models is excluded at 95% confidence level, assuming unit right-handed coupling.
c
Copyright 2012 CERN for the benefit of the ATLAS Collaboration.
Reproduction of this article or parts of it is allowed as specified in the CC-BY-3.0 license.
1 Introduction
In the past few decades, remarkable agreement has been shown between predictions of the Standard Model (SM) and experimental measurements in particle physics. The top quark sector is one important place to look for deviations from the SM, as the large top quark mass suggests that it may play a special role in electroweak symmetry breaking. The recent top quark forward-backward asymmetry measure- ments from the Tevatron experiments [1,
2] are among the few discrepancies between SM expectationsand observations. One possible explanation of these asymmetries is a top-flavor-violating process [3–5].
In these models, a heavy new particle
Xis produced in association with a top quark or an anti-top quark (
pp→ Xt/Xt). The massive particle then decays to ¯¯
tq/tq, leading to a resonance in the ¯t(or
t) plus jetsystem of
t¯t+jets events. Figure1shows example production diagrams for these new particles. When produced at a
ppcollider such as the LHC, the baryon asymmetry of the beam leads to a resonance pre- dominantly in either
tqor ¯
tq. Thet(¯t) then decays toW+b(W
−b), and this analysis considers the decay¯ signature of events in which one
Wboson decays leptonically and the other
Wboson decays hadronically.
Two types of
Xresonances are considered: a color singlet
W0model that would give a resonance pre- dominantly in the ¯
tqsystem, and a di-quark color triplet (φ) model that would give a resonance largely in the
tqsystem. The new resonances are assumed not to be self-conjugate, which then evades limits from searches for same-sign top quarks. The first direct search for such a particle was made at CDF [6], which excluded triplets with masses below 200 GeV and
W0models with masses below 300 GeV, for particles with unit right-handed coupling (g
R) to
tq. CMS recently performed a search that excluded a newW0with a mass less than 840 GeV [7] for particles with
gR=2
1.
g
t
q
t
W
0t q
(a)
g
t
q
t
φ
t q
(b)
Figure 1: Example production and decay Feynman diagrams for the
W0(a) and
φ(b) models.
2 Data Selection
The analysis presented here uses the full 7 TeV ATLAS
ppdataset collected in 2011, corresponding to 4.7
±0.2 fb
−1of integrated luminosity [8,
9] delivered by the LHC. The data were collected by the ATLASexperiment [10], a multi-purpose particle physics detector with cylindrical geometry.
2The inner detector
1There are several differences between the models in Refs. [3] and [4]. The Lagrangian in the former (used in this note) includes a factor of 1/√
2, and the one in the latter (used by CMS) does not. In addition, Ref. [4] includes additional non- resonant diagrams with cross section that scale asg4R. Such diagrams are not included in Ref. [3].
2ATLAS uses a right-handed coordinate system with its origin at the nominal interaction point (IP) in the center of the detector and thez-axis along the beam pipe. Thex-axis points from the IP to the center of the LHC ring, and theyaxis points upward. Cylindrical coordinates (r, φ) are used in the transverse plane,φ
(ID) system consists of a high-granularity silicon pixel detector and silicon micro-strip tracker, as well as a transition radiation straw tracker. The ID is immersed in a 2 T axial magnetic field, and provides charged particle tracking in the range
|η| <2.5. Surrounding the ID, electromagnetic calorimetry is provided by barrel and endcap liquid-argon (LAr)/lead accordion calorimeters and LAr/copper sampling calorimeters in the forward regions. Hadronic calorimetry is provided in the barrel by a steel
/scintillating tile sampling calorimeter, in the endcaps by LAr/copper, and in the forward region by LAr/tungsten sam- pling calorimeters. The muon spectrometer (MS) comprises separate trigger and high-precision tracking chambers measuring the deflection of muons in a magnetic field with a bending integral from 2 to 8 Tm, generated by three superconducting air-core toroid systems. A three-level trigger system is used to select interesting events. The level-1 trigger is implemented in hardware and uses a subset of detector informa- tion to reduce the event rate to a design value of at most 75 kHz. This is followed by two software-based trigger levels, level-2 and the event filter, which together reduce the event rate to a few hundred Hz.
Electrons reconstructed off-line are required to have a shower shape in the electromagnetic calorime- ter consistent with expectation, as well as a good quality track pointing to the cluster in the calorimeter.
Candidate electrons with transverse energy
ET >25 GeV are required to pass the “tight” ATLAS elec- tron quality cuts [11], to fall inside a well instrumented region of the detector (|η|
<2.47, excluding 1.37
<|η|<
1.52), and to be well isolated from other objects in the event. Muons with transverse momentum
pT >20 GeV are required to pass standard ATLAS muon quality cuts [12], to be well measured in both the ID and the muon spectrometer, to fall within
|η| <2.5, and to be isolated from other objects in the event. Events with an electron (muon) are required to have been triggered by an electron (muon) trigger with a threshold of 20 (18) GeV, ensuring that the trigger is fully e
fficient.
Jets are reconstructed in the calorimeter using the anti-k
t[13] algorithm with a distance parameter of 0.4. Jets are required to satisfy
ET >25 GeV and
|η|<2.5. Events with jets arising from electronic noise bursts and beam backgrounds are rejected [14]. Jets are calibrated to the hadronic energy scale using
pT- and
η-dependent corrections derived from collision and test-beam data as well as simulation [15]. Jetsfrom the decay of heavy flavor hadrons are selected by the multivariate b-tagging algorithm [16] at an operating point with 70% e
fficiency for
b-jets and a mis-tag rate of less than 1% in simulatedt¯tevents.
Neutrinos are inferred from the magnitude of the missing transverse momentum (E
missT) in the event [17].
The signal region for this analysis requires exactly one charged lepton and five or more jets, including at least one
b-tagged jet. To tag events with a leptonically decaying Wboson, events are required to have
EmissT >30 GeV (E
missT >20 GeV) in the electron (muon) channel. Additionally, the event must have a transverse mass of the leptonic
Wboson
mWT >30 GeV in the electron channel, or scalar sum
EmissT +mWT >60 GeV in the muon channel [18].
3 Simulation Samples
A variety of Monte Carlo generators are used to study and estimate backgrounds. The generated events are processed through the full ATLAS detector simulation [19], based on GEANT4 [20], and include the effect of multiple
ppinteractions per bunch crossing. Events are reweighted so that the distribution of the number of
ppcollisions occurring in addition to the hard scatter process matches that in data.
The
t¯tbackground is nominally modeled with MC@NLO v4.01 [21] interfaced to HERWIG v6.520 [22]
and JIMMY v4.31 [23]. An additional
t¯tsample modeled with MC@NLO interfaced to PYTHIA v6.425 [24] is used to study potential systematic uncertainties. Other
t¯tsamples use POWHEG [25] in- terfaced either to PYTHIA or HERWIG, as well as ACERMC v3.8 [26] The background from production of single
Wbosons in association with extra jets is modeled by the ALPGEN v2.13 [27] generator inter- faced to HERWIG. The MLM matching scheme [28] is used to form inclusive
Wboson
+jets samples.
Duplicate heavy flavor events in both the hard scatter and showering are removed, and the heavy flavor
contributions are reweighted based on data-driven estimates [29]. Diboson events are generated using
HERWIG. Single-top quark events are modeled with MC@NLO, interfaced with JIMMY for the parton showering in the
s-channel andWtchannel, and ACERMC v3.8 in the
t-channel. The small backgroundin which multi-jet processes fake a prompt lepton, is modeled from a data-driven matrix method [30].
In determining the expected event yields, the
t¯tcross section is normalized to approximate next-to-next- to-leading order QCD calculations of 167
+−1817pb for a top quark mass of 172.5 GeV [31,
32], and thetotal
W+jets background is normalized to inclusive next-to-next-to-leading-order predictions [33]. Sig-nal events are produced with MADGRAPH v5.1.3.16 [34] and interfaced to PYTHIA v6.425. Leading order cross sections from Ref. [3] are used for the predicted signal normalization.
4 Fitting Method
Events are reconstructed with a kinematic fitting algorithm [35] that utilizes knowledge of the over- constrained
t¯tsystem to assign jets to partons. The two top quark masses are each constrained to 172.5 GeV in the fit by a penalty in the likelihood computed from variations from this nominal value and the natural top quark width of 1.5 GeV. The two
Wboson masses are similarly constrained to 80.4 GeV within a width of 2.1 GeV. This also allows the z-component of the neutrino from the leptonically de- caying
Wboson to be computed. Both solutions from the quadratic ambiguity of this computation are tested. Charged lepton, neutrino and jet energies and momenta are constrained in the fit by resolution transfer functions derived from simulated
t¯tevents. The full shape of the transfer function is used. All assignments of any four jets to partons from the
t¯tdecay are tested, and the assignment with the largest likelihood output for the
t¯thypothesis is selected. After the assignment is selected, the originally mea- sured jet and lepton momenta and
EmissTare used. The remaining jets not associated to the
t¯tpartons are included to form
mt jand
mt j¯masses, where the charge of the lepton is used to infer which is the top candidate and which is the anti-top candidate. All combinations of extra jets with the top and anti-top quark candidates are considered, and the pairings that give the largest
mt jand
m¯t jmasses are used. In this way, the same extra jet can (but does not necessarily have to) be used to form
mt jand
mt j¯. These two masses are used as observables for the search.
5 Control Regions
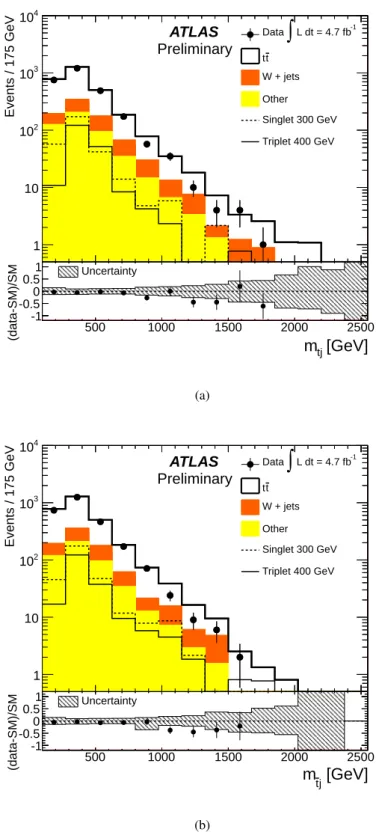
Several control regions are tested to ensure good modeling and understanding of the backgrounds before the signal region is examined. The dominant
t¯tbackground is tested in a region with exactly four jets (including at least one
b-tagged jet) but no fifth jet. The rejection of events with more than four jetsensures small signal contamination. A second
t¯tcontrol region is defined by events with exactly four jets with
pTabove 25 GeV, one of which must be
b-tagged, and exactly one jet withpTbetween 20 and 25 GeV. Signal contamination is further reduced by requiring that the
∆R ≡ p(∆
η)2+(∆
φ)2between the fifth jet and both the reconstructed top and anti-top quarks is greater than
π/2. Figure 2shows distributions in the five-jet control region. Good agreement is observed between data and prediction.
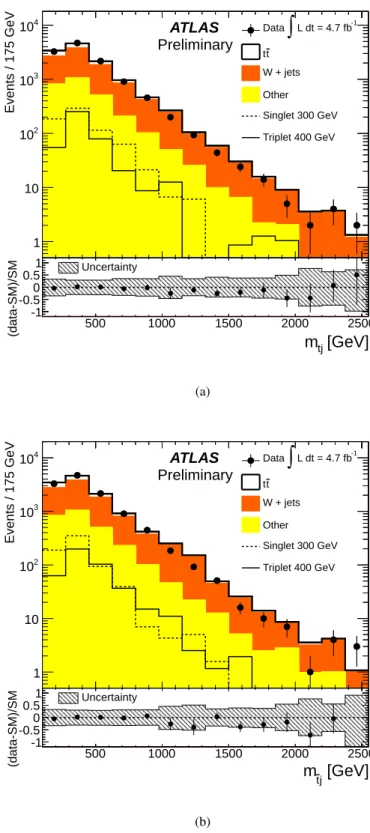
The second major background, production of single
Wbosons in association with extra jets, is tested in
a region with five or more jets, vetoing events with
b-tags. The requirement of zerob-tagged jets reducesboth signal and
t¯tcontamination. The distributions shown in Figure
3show good agreement between
data and prediction within uncertainties. Table
1summarizes the expected and observed yields in the
control regions.
500 1000 1500 2000 2500
Events / 175 GeV
1 10 102
103
104
L dt = 4.7 fb-1
∫
Data t t W + jets Other Singlet 300 GeV Triplet 400 GeV
ATLAS Preliminary
[GeV]
mtj
500 1000 1500 2000 2500
(data-SM)/SM
-1 -0.5
0 0.5
1 Uncertainty
(a)
500 1000 1500 2000 2500
Events / 175 GeV
1 10 102
103
104
L dt = 4.7 fb-1
∫
Data t t W + jets Other Singlet 300 GeV Triplet 400 GeV
ATLAS Preliminary
[GeV]
j
mt
500 1000 1500 2000 2500
(data-SM)/SM
-1 -0.5
0 0.5
1 Uncertainty
(b)
Figure 2: Expected and observed distributions of
mt j(a) and
mt j¯(b) in the five-jet
t¯tcontrol region. The
example signal distributions assume unit coupling for the new physics process. The total uncertainty
shown on the ratio includes both statistical and systematic effects.
500 1000 1500 2000 2500
Events / 175 GeV
1 10 102
103
104 Data
∫
L dt = 4.7 fb-1t t W + jets Other Singlet 300 GeV Triplet 400 GeV
ATLAS Preliminary
[GeV]
mtj
500 1000 1500 2000 2500
(data-SM)/SM
-1 -0.5
0 0.5
1 Uncertainty
(a)
500 1000 1500 2000 2500
Events / 175 GeV
1 10 102
103
104 Data
∫
L dt = 4.7 fb-1t t W + jets Other Singlet 300 GeV Triplet 400 GeV
ATLAS Preliminary
[GeV]
j
mt
500 1000 1500 2000 2500
(data-SM)/SM
-1 -0.5
0 0.5
1 Uncertainty
(b)
Figure 3: Expected and observed distribution of
mt j(a) and
mt j¯(b) in the
W+jets control region. Theexample signal distributions assume unit coupling for the new physics process. The total uncertainty
shown on the ratio includes both statistical and systematic e
ffects.
Table 1: Expected and observed yields in the four control regions (CR). The preselection control region requires at least four jets and no tag requirement. The
Wboson+jets control region requires more than four jets and zero
b-tags. The four-jet t¯tregion requires a
b-tagged jet and exactly four jets. The fivejet
t¯tcontrol region requires four jets, at least one
b-tagged jet, and exactly one soft jet between 20 and25 GeV. The errors include all systematic uncertainties. The total background includes
t¯t, Wboson
+jets and the other smaller backgrounds, single top production, diboson production and multi-jet events, which are not tabulated separately here.
Preselection CR
W+jets CR four-jet
t¯tCR five-jet
t¯tCR
t¯t
50000
±47002000
±40019000
±6002100
±200W+
jets 46000
±140007000
±29003800
±800360
±170Total Background 116000
±21000 12000
±3600 26000
±1300 2900
±440
Observed 110933 11858 26197 2736
300 GeV
W010400
±500690
±802200
±300300
±60400 GeV
φ6100
±200430
±601100
±100200
±206 Systematic Uncertainties
A variety of potential systematic e
ffects are evaluated on predictions for both the signal and background rates and shapes. The dominant systematic e
ffects of jet energy scale [15] and resolution [36] lead to uncertainties of up to 10% on the total background rate and up to 21% on the total signal expectation, depending on the signal mass. The other dominant systematic uncertainty, from di
fferences of the
b-tagging e
fficiency in simulation and data, leads to uncertainties of roughly 16% on both the signal and background rates. Effects due to lepton trigger uncertainties and ID efficiency as well as energy scale and resolution are assessed using
Z →eeand
Z →µµdata, which lead to systematic uncertainties of a few percent. Other potential systematic e
ffects considered are the size of the small multi-jet background (assigned 100% uncertainty),
t¯tgenerator systematics (evaluated by comparing different results using the MC@NLO and POWHEG generators, 1-10%),
t¯tshowering and fragmentation systematics (evaluated by comparing samples using both PYTHIA and HERWIG, 1-6%), an uncertainty on the total integrated luminosity (3.9%) [8,
9], and the amount of QCD radiation for the signal and thet¯tbackground (approx- imately 10%, evaluated using ACERMC). Total cross section uncertainties of 10% (55%) are used for the
t¯t(W
+jets) backgrounds.
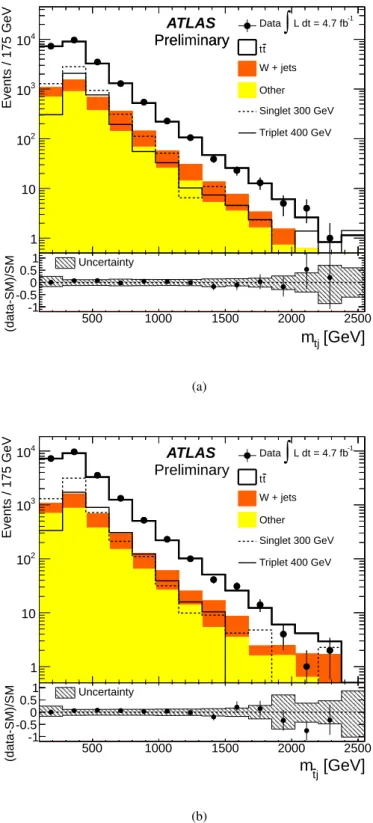
7 Results
Figure
4shows the expected and observed
mt jand
mt j¯distributions in the signal region before any additional cuts. The data are found to be consistent with expectation. Expected and observed upper limits on the signal cross section are computed at discrete mass points as follows. For each signal mass point under consideration, a signal region is defined in the
mt j-m
t j¯plane. When setting limits for the
W0(φ) model, the
mt j(m
t j¯) window is significantly wider than the
mt j¯(m
t j) window to account for the fact that the resonance is predominantly in the
mt j¯(m
t j) system. The windows are optimized to maximize sensitivity, accounting for the full e
ffect of systematic uncertainties. For each mass window, 95% C.L.
upper limits on the signal cross section are computed using a single bin frequentist CLs method [
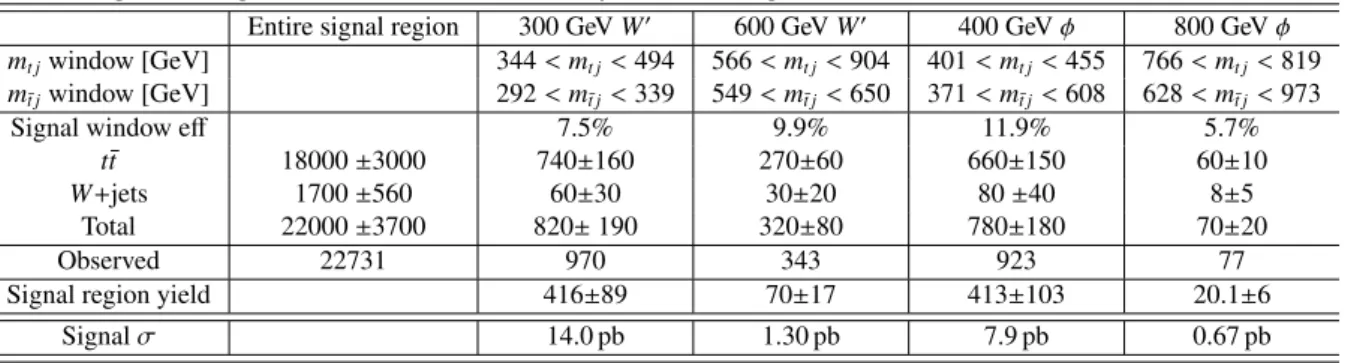
37,38].No further shape information is used. Table
2shows the expected and observed event yields in several of the signal region windows. The data are consistent with the background, and no excess is observed.
Expected and observed 95% C.L. lower limits on the signal mass are derived, assuming a coupling of
gR =1 and
gR =2, and are shown in Figure
5. Assuming couplings ofg2R, the exclusion in the mass-
coupling plane is shown in Figure
6.500 1000 1500 2000 2500
Events / 175 GeV
1 10 102
103
104
L dt = 4.7 fb-1
∫
Data t t W + jets Other Singlet 300 GeV Triplet 400 GeV
ATLAS Preliminary Preliminary
[GeV]
mtj
500 1000 1500 2000 2500
(data-SM)/SM
-1 -0.5
0 0.5
1 Uncertainty
(a)
500 1000 1500 2000 2500
Events / 175 GeV
1 10 102
103
104 Data
∫
L dt = 4.7 fb-1t t W + jets Other Singlet 300 GeV Triplet 400 GeV
ATLAS Preliminary
[GeV]
j
mt
500 1000 1500 2000 2500
(data-SM)/SM
-1 -0.5
0 0.5
1 Uncertainty
(b)
Figure 4: Expected and observed distributions of
mt j(a) and
mt j¯(b) in the signal region. The example signal distributions assume unit coupling for the new physics process. No mass window cuts are applied.
The uncertainty band includes both statistical and systematic uncertainties.
Singlet Resonance Mass [GeV]
200 400 600 800 1000 1200 1400 1600 1800 2000
95% C.L. Cross-Section Limit [pb]
10-1
1 10 102
R = 1
Theory, g σ
R = 2
Theory, g σ
Observed limit Expected limit
σ
± 1 σ
± 2
=1
R
CDF excluded, g
ATLAS
= 7 TeV s
L dt = 4.7 fb-1
∫
Preliminary
(a)
Triplet Resonance Mass [GeV]
200 400 600 800 1000 1200 1400 1600 1800 2000
95% C.L. Cross-Section Limit [pb]
10-1
1 10 102
R = 1
Theory, g σ
R = 2
Theory, g σ
Observed limit Expected limit
σ
± 1 σ
± 2
R=1 CDF excluded, g
ATLAS
= 7 TeV s
L dt = 4.7 fb-1
∫
Preliminary
(b)
Figure 5: Expected and observed 95% C.L. upper limits on the
W0(a) and
φ(b) model cross sections.
The green and yellow bands show the one and two standard deviation variations on the expected limits.
The solid black line is the observed limit. The blue line shows the theoretical prediction for the cross section assuming unit coupling, and the dashed brown line shows the theoretical prediction at
gR =2.
The CDF result comes from [6].
Singlet Resonance Mass [GeV]
500 1000 1500 2000 2500
RCoupling g
0 0.5 1 1.5 2 2.5 3 3.5 4 4.5 5
95% C.L. exclusion Expected exclusion CDF exclusion
t
σt
and Observed AFB
ATLAS
Preliminary
L dt = 4.7 fb-1
∫
= 7 TeV s
(a)
Triplet Resonance Mass [GeV]
500 1000 1500 2000 2500
RCoupling g
0 0.5 1 1.5 2 2.5 3 3.5 4 4.5 5
95% C.L. exclusion Expected exclusion CDF exclusion
t
σt
and Observed AFB
ATLAS
Preliminary
L dt = 4.7 fb-1
∫
= 7 TeV s
(b)
Figure 6: Expected and observed 95% C.L. upper limits on the
W0(a) and
φ(b) model cross sections
assuming coupling scales with
g2R. The blue hashed area shows regions of parameter space that improve
upon the goodness of fit to Tevatron over the SM expectation [39]. The CDF result comes from [6].
Table 2: Expected and observed yields in different signal regions. The errors include all systematic uncertainties. Total refers to the total expected background, including
t¯t,Wboson
+jets and the other smaller backgrounds, single top production, diboson production and multi-jet events. Signal window e
ffrefers to the efficiency for the signal to fall inside the optimized 2-d mass window. Signal region yield refers to the yield in the signal region after the mass window cuts at each signal point. Signal
σrefers to the leading order signal cross section before any
t¯tbranching fraction or mass window cuts.
Entire signal region 300 GeVW0 600 GeVW0 400 GeVφ 800 GeVφ mt jwindow [GeV] 344<mt j<494 566<mt j<904 401<mt j<455 766<mt j<819 m¯t jwindow [GeV] 292<mt j¯ <339 549<mt j¯ <650 371<mt j¯ <608 628<mt j¯ <973
Signal window eff 7.5% 9.9% 11.9% 5.7%
t¯t 18000±3000 740±160 270±60 660±150 60±10
W+jets 1700±560 60±30 30±20 80±40 8±5
Total 22000±3700 820±190 320±80 780±180 70±20
Observed 22731 970 343 923 77
Signal region yield 416±89 70±17 413±103 20.1±6
Signalσ 14.0 pb 1.30 pb 7.9 pb 0.67 pb
8 Conclusions
In conclusion, a search for a heavy new particle
Xin the
t jor ¯
t jsystem of
t¯tplus extra jet events with the
ATLAS detector has been presented. Such new particles could explain the anomalous forward-backward
asymmetry observed in top quark pair production at the Tevatron. The full 2011 ATLAS
ppdataset
(4.7 fb
−1) was used in the search. Assuming a unit coupling, the expected 95% C.L. lower limit on the
mass of the new particle is 450 (700) GeV in the
W0(φ) model. No significant excess of data above SM
expectation was observed, and 95% C.L. lower limits of 350 (430) GeV for the
W0(φ) model were set. At
gR =2, the limits are 1.10 (1.45) TeV for the
W0(φ) model, with expected limits of 0.90 (1.30) TeV. Most
of the regions of phase space that explain the Tevatron forward background asymmetry were excluded.
References
[1] CDF Collaboration, T. Aaltonen
et al., Phys. Rev. 19 D83, 112003 (2011), arXiv:1101.0034.[2] D0 Collaboration, V. M. Abazov
et al., Phys. Rev. 21 D84, 112005 (2011), arXiv:1107.4995.[3] Zurek
et al, arXiv:1102.0018 (2011).[4] Y. Cui, Z. Han and M. D. Schwartz, JHEP
1107, 127 (2011), arXiv:1106.3086.
[5] S. Knapen, Y. Zhao and M. J. Strassler, arXiv:1111.5857 (2011).
[6] CDF Collaboration, T. Aaltonen
et al., Phys Rev. Lett.108211805 (2012), arXiv: 1203.3894.
[7] CMS Collaboration, arXiv:1206.3921, submitted to Phys. Lett. B.
[8] ATLAS Collaboration, ATLAS-CONF-2011-116,
http://cdsweb.cern.ch/record/1376384.[9] ATLAS Collaboration, Eur. Phys. J.
C71, 1630 (2011).[10] ATLAS Collaboration, JINST
3, S08003 (2008).[11] ATLAS Collaboration, Eur. Phys. J.
C72, 1909 (2012), arXiv:1110.3174.[12] ATLAS Collaboration, ATLAS-CONF-2011-063,
http://cdsweb.cern.ch/record/1345743.[13] M. Cacciari, G. P. Salam and G. Soyez, JHEP
0804, 063 (2008), arXiv:0802.1189; M. Cacciariand G. P. Salam, Phys. Lett.
B641(2006) 57, arXiv:hep-ph
/0512210.
[14] ATLAS Collaboration, ATLAS-CONF-2010-038,
http://cdsweb.cern.ch/record/1277678.[15] ATLAS Collaboration, arXiv:1112.6426, submitted to Eur. Phys. J.
[16] ATLAS Collaboration, ATLAS-CONF-2012-043,
https://cdsweb.cern.ch/record/1435197.[17] ATLAS Collaboration, arXiv:1108.5602, submitted to Eur. Phys. J.
[18] ATLAS Collaboration, arXiv:1205.5371, submitted to Eur. Phys. J.
[19] ATLAS Collaboration, Eur. Phys. J.
C70(2010) 823, arXiv:1005.4568.
[20] S. Agostinelli et al. Nucl. Instrum. Meth.
A506250 (2003).
[21] S. Frixione and B. R. Webber, JHEP
06(2002) 029, arXiv:hep-ph
/0204244; S. Frixione, P. Nason and B. R. Webber, JHEP
08(2003) 007.
[22] G. Corcella et al., JHEP
01(2001) 010, arXiv:0011363.
[23] J. Butterworth, J. Forshaw and M. Seymour, Z. Phys.
C72(1996) 637, arXiv:hep-ph
/9601371.
[24] T. Sj¨ostrand, S. Mrenna and P. Skands, JHEP
05(2006) 026, arXiv:hep-px/0603175.
[26] B. Kersevan and E. Richter-Was, Comput. Phys. Commun. 149 (2003) 142.
[27] M. Mangano et al., JHEP
07(2003) 001, arXiv:hep-ph/0206293.
[28] S.Hoeche et al., arXiv:hep-ph
/0602031.
[29] ATLAS Collaboration, arXiv:1205:5371, submitted to Eur. Phys. J.
[30] ATLAS Collaboration, Eur. Phys. J. C71 (2011) 1577, arXiv:1012.1792.
[31] S. Moch and P. Uwer, Phys Rev.
D78(2008) 0034003, arXiv:0804.1476.
[32] M. Aliev et al., HATHOR HAdronic Top and Heavy quarks cross section calculatoR Comput.
Phys. Commun. 182 (2011) 1034-1046, arXiv:1007.1327.
[33] K. Melnikov, F. Petriello, Phys. Rev.
D74(2006) 114017, arXiv:hep-ph/0609070.
[34] J. Alwall
et al., JHEP0709(2007) 028, arXiv:0706.2334.[35] Dipl.Phys. Olaf Nackenhorst, July 2010, II.Physik-UniG¨o-Dipl-2010
/04 [36] ATLAS Collaboration, ATLAS-CONF-2010-054,
http://cdsweb.cern.ch/record/1281311.