ATLAS-CONF-2012-108 13August2012
ATLAS NOTE
ATLAS-CONF-2012-108
August 11, 2012
Search for supersymmetry using events with three leptons, multiple jets, and missing transverse momentum with the ATLAS detector
The ATLAS Collaboration
Abstract
We report on a search for physics beyond the Standard Model using events with three leptons, four or more jets, and missing transverse momentum. The search utilizes 4.7 fb
−1of proton-proton collision data collected at
√s=
7 TeV with the ATLAS detector at the Large Hadron Collider. Data are found to be in agreement with the Standard Model expectation.
The result is interpreted in the scope of two simplified supersymmetry models. The first model is pair-production of gluinos that decay into top squarks and quarks;
pp → g˜
g,˜
˜
g→t
˜
∗1t, and ˜¯
t1∗→χ˜
01t. The second model is pair-production of bottom squarks decaying via b˜
→t+χ˜
±1, where ˜
χ±1 →W±χ˜
01.
c Copyright 2012 CERN for the benefit of the ATLAS Collaboration.
Reproduction of this article or parts of it is allowed as specified in the CC-BY-3.0 license.
1 Introduction
Supersymmetry [1–9] (SUSY) is considered to be one of the most promising extensions of the Standard Model (SM) at the electroweak scale. Naturalness suggests that the SUSY partners of the top quark (stops), gluon (gluinos), and possibly bottom quark (sbottoms) could have masses below 1 TeV [10, 11].
Consequently, they could be produced with large cross sections at the Large Hadron Collider (LHC).
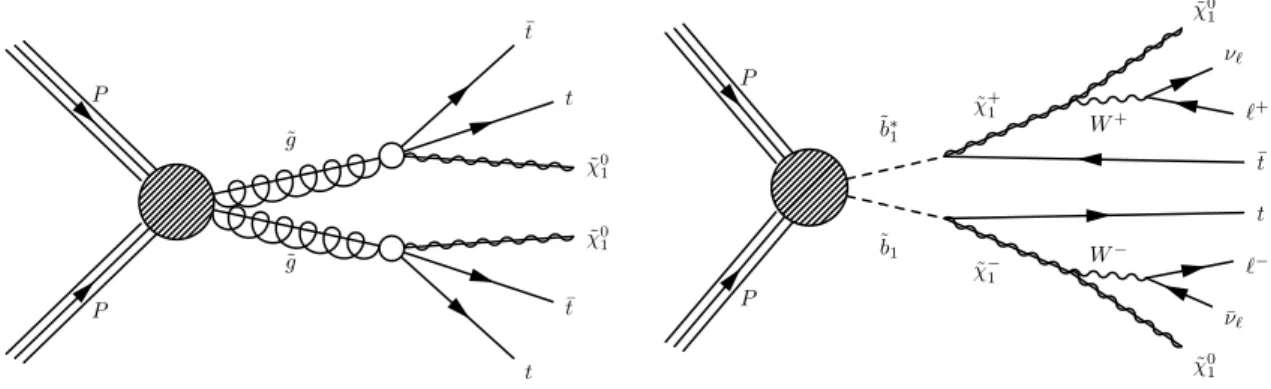
In this note, we report on a search for pair-production of gluinos and of bottom squarks. Two different hypotheses regarding the mass hierarchy of the SUSY particle are made. In the first one, gluinos and neutralinos are the lightest SUSY particles, and pair-produced gluinos decay to t¯ t+
χ˜
01final states via off-shell stops (see Fig. 1). The second SUSY scenario assumes that only pair-production of bottom squarks is relevant, and a sbottom decays only via a top quark and a chargino ( ˜
χ±1 →W
±+χ˜
01). Figure 1 illustrates these two processes of interest. The search is conducted using final states with three energetic leptons, four or more jets, and missing transverse momentum. The leptons considered in this analysis are identified electrons and muons, including those from decays of tau leptons, but excluding hadronically decaying tau leptons.
P P
˜g
˜g
t
¯ t
χ˜01
˜ χ01
t
¯t
1
P P
˜b1
˜b∗1
χ˜−1 W−
˜ χ+1
W+
˜ χ01
¯ νℓ
ℓ− t
¯t ℓ+ νℓ
χ˜01
Figure 1: Diagrams for pair-production of gluinos (right) and bottom squarks (left).
These models all feature the production of four W
±bosons from either top quark decays (gluino pair-production) or from top quark and chargino decays (bottom squark pair-production). The SM cross sections for production of background processes such as W
±Z, ZZ, and three W
±bosons are low, es- pecially when additional jets are required. Therefore, the multiple leptonic decays of W give a robust signature of new physics. The selection of events with three or more leptons and multiple jets offers suppression of the t t ¯ production.
The search is conducted as a counting experiment for events with three or more leptons and four or more jets. A requirement on missing transverse momentum is also imposed since the SUSY models considered assume R-parity [12–16] conservation, so that neutralinos escape direct detection and lead to imbalance in the momentum of observed particles. The SM backgrounds in the three-lepton final state are expected to be low, at the level of about one event. We separate the three-lepton events into six categories depending on the charge-flavor combination of the three leptons
1since the rates of the SM backgrounds and SUSY signal vary among the categories. The separation into these categories improves sensitivity of the search to new physics and allows us to diagnose potential deviations between data and the SM predictions.
1We consider the first three leptons with the highest transverse momentum. No requirement is imposed on additional leptons.
2 ATLAS detector
ATLAS uses a right-handed coordinate system with its origin at the nominal pp interaction point (IP) in the center of the detector and the z-axis along the beam pipe. The x-axis points from the IP to the center of the LHC ring, and the
y-axis points upward. Cylindrical coordinates (r, φ) are used in the transverseplane,
φbeing the azimuthal angle around the beam pipe. The pseudorapidity is defined in terms of the polar angle
θas
η = −ln tan(θ/2) and the rapidity is defined as
y =ln[(E
+p
z)/(E
−p
z)]/2. The separation between final state particles is defined as
∆R= p(∆y)
2+(∆φ)
2and is Lorentz invariant under boosts along the z-axis. The transverse momentum is denoted as p
T.
The ATLAS detector [17, 18] consists of an inner tracking system (inner detector) surrounded by a thin superconducting solenoid providing a 2T magnetic field, electromagnetic (EM) and hadronic calorimeters, and a muon spectrometer. The inner detector consists of pixel and silicon microstrip detec- tors, surrounded by a straw tube transition radiation tracker. The electromagnetic calorimeter is a liquid- argon and lead detector, split into barrel (|η|
<1.475) and endcap (1.375
< |η| <3.2) regions. Hadron calorimetry is based on two different detector technologies. The barrel (|η|
<0.8) and extended barrel (0.8
<|η|<1.7) calorimeters are composed of scintillator and iron, while the hadronic endcap calorime- ters (1.5
<|η|<3.2) utilize liquid-argon and copper. The forward calorimeters (3.1
< |η| <4.9) are in- strumented with liquid-argon/copper and liquid-argon/tungsten, providing electromagnetic and hadronic energy measurements, respectively. The muon spectrometer is based on three large superconducting toroids arranged with an eight-fold azimuthal coil symmetry around the calorimeters, and a system of three stations of chambers for triggering and for precise track measurements.
3 Data sample
The data used for this analysis were collected during the year of 2011 and correspond to an integrated luminosity of 4.7 fb
−1, with an estimated uncertainty of 3.9% [19]. The data were selected by the single- electron and single-muon triggers, and duplicate events are removed. All parts of the detector relevant to the measurement (trigger, calorimetry, muon detector, inner detector) are required to be in good operating condition.
4 Monte Carlo simulation
The Monte Carlo data sets used for this analysis are generated for pp collisions with a center of mass energy of 7 TeV. The major SM contributions to events with three leptons, multiple jets, and missing transverse momentum are from t¯ t+jets (where additional isolated leptons are produced by b-quark decays or photon conversions), VZ
+jets (V =W or Z), and t t+V+jets. ¯
The modeling of multi-jet final states is of extreme importance for this analysis. The V+jets, V+b b+jets, ¯ t¯ t+jets, and WW
+jets production is modeled using the Av2.13 [20] Monte Carlo generator. The ZZ+jets and WZ+jets samples are generated using the S v1.4 [21] Monte Carlo generator. Simu- lations with MC@NLO [22] for WZ+jets are used as a cross-check for the corresponding samples from S. Jet production in V+jets, V+b b+jets, and ¯ t¯ t+jets is generated using up to five-parton matrix elements (ME’s). The diboson samples from S contain ME’s for up to three final state partons. The jet-parton matching is performed for 20 and 30 GeV jets in A and S, respectively. S
uses its default parametrization for renormalization and factorization scales. A parametrizes the scales as Q
20 =m
2W + Σm2T, where m
2T=m
2+p
2Tis calculated for all final state partons (excluding the V , VV , and t t ¯ decay products). The A generator is interfaced to H v6.510 [23, 24] for showering and hadronization processes and to JIMMY v4.31 [25] for underlying event simulation (AUET1 LO*
tune) [26]. Tau decays are processed with T v1.0.2 [27]. The diboson samples, WZ, and ZZ, are
generated with a threshold of m(e
+e
−)
>0.1 GeV threshold. The combined Z+jets samples correspond to a m
Z>10 GeV cut-off and the Z+b b ¯ samples have m
Z >30 GeV. Single-topWt production is simulated with AMC [28]. MG [29] is used to generate ME’s for t t+W+jets and ¯ t t+Z+jets, which are ¯ then passed to P [30].
Overlap between the Z+jets and Z+b b+jet samples is eliminated: events with two ¯ b quarks are removed from the Z+jets sample if the angular separation between the b quarks is large. Similarly, events with small angular separation between b quarks are removed from the Z+b b+jet sample. ¯
The parton density function sets (PDF) used for these samples are CTEQ6L1 [31] in A and LO* (modified LO PDF: MRST2007lomod [32]) in P and AMC. The NLO CT10 PDF [33] is used with S and MC@NLO.
The radiation of photons from charged leptons is treated in A using P v2.15.4 [34]. The ATLAS MC10 [26, 35] underlying event tune is used for A samples and P inclusive vector boson production, whereas the AMBT1 [35] tune is used for the P V+jets samples. The samples generated with S use the default tune as recommended by the authors. Detector response simulation is run using GEANT version 4 [36] which models the ATLAS detector in full detail.
We use theory cross sections to normalize the simulated processes. The NNLO cross sections for inclusive production of W and Z bosons are from Refs. [37] and [38]. The corrections for the different thresholds of m
Zare obtained with the MC simulations described earlier. The t t ¯ cross section is cal- culated with Hathor at approximate NNLO accuracy [39] using the MSTW2008 NNLO PDF set [40]
incorporating PDF+α
Suncertainties according to the MSTW prescription [41]. The diboson cross sec- tions are documented in Ref. [42]. Again, the corrections for the different thresholds of m
Zin the ZZ and WZ MC simulations are obtained with the MC samples. The NNLO cross section calculation for Wt single-top production is described in Ref. [43]. The tree-level cross sections for Z+b b+jets are scaled ¯ in proportion to the number of events that survived the removal of heavy flavor overlap. The corrected cross sections are multiplied by a K-factor of 1.24, using a conservative uncertainty of 55%. The gener- ator cross sections for t¯ t+V+jets are multiplied by a K-factor of 1.3 and the relative uncertainty on the cross-sections is 74%.
The SUSY signal samples are generated with HERWIG++ [44] and the SUSY mass spectrum is calculated using SUSYHIT [45]. Signal cross sections are calculated to next-to-leading order in the strong coupling constant, adding the resummation of soft gluon emission at next-to-leading-logarithmic accuracy (NLO+NLL) [46]. An envelope of cross section predictions is defined using the 68% CL ranges of the CTEQ [47] (including the
αSuncertainty) and MSTW [40] PDF sets, together with independent variations of the factorisation and renormalisation scales by factors of two or one half. The nominal cross section value is taken to be the midpoint of the envelope and the uncertainty assigned is half the full width of the envelope. The procedure follows the recommendations from PDF4LHC [48]. The simulated datasets are reweighted to match data using the multiplicity of additional pp interactions that occured in the bunch-crossings selected by the single-lepton triggers (in-time pileup).
5 Object definitions and event selection
5.1 Electron definition
An electron candidate is reconstructed as a cluster of energy in the EM calorimeter, matched to a track in
the inner detector. Electrons are required to have p
T >15 GeV and an absolute value of
ηof the electron
calorimeter cluster
<2.47. The p
Tis calculated from the EM cluster energy and the pseudo-rapidity
of the inner-detector track as p
T =E
Cluster·sin(θ
track). The electron cluster and track are required to
satisfy requirements on the shape of the cluster, the quality of the track, angular matching between the
track and the cluster, and the number of track hits in the innermost layer of the inner detector [49]. The
z-component of the origin of the electron track is required to be within 10 mm of the primary vertex defined below. Any electrons located in the small regions of the detector where the LAr calorimeter is not fully operational are removed.
Isolation of the electron is achieved by requiring that the scalar sum of the transverse momenta of all tracks with p
T >1 GeV, inside a cone of
∆R <0.2 around the electron track, is less than 10% of the electron p
T. The electron track and any tracks from reconstructed photon conversions are excluded from the sum.
5.2 Muon definition
Muon candidates are required to have track segments in both the inner detector and the muon spectrome- ter. The two segments are combined using an algorithm which significantly reduces contamination from the decays-in-flight of light mesons.
A muon is required to have p
T >15 GeV and
|η| <2.5, with the momentum and pseudo-rapidity calculated using the combined track. The inner detector track must satisfy the nominal requirements of at least two hits in the pixel layers and at least six hits in the silicon-strip layers.
The inner detector segment of a muon track is required to originate from the primary vertex. The transverse impact parameter of the track d
0and its significance d
0/σ(d0) are calculated with respect to the primary vertex. Similarly, the longitudinal impact parameter,
∆z0, is also calculated with respect to the primary vertex. We require
|d0|<0.2 mm,
|d0/σ(d0)|
<3, and
|∆z0|<1 mm to ensure that the muon is promptly produced.
Muon isolation similar to the electron case is required. The sum of the transverse momenta of tracks with p
T >1 GeV within
∆R <0.2 of the muon direction is required to be less than 10% of the muon transverse momentum. The tracks in this cone are selected to have a longitudinal impact parameter
|∆z0|with respect to the primary vertex of less than 1 mm, also have a
|∆z0|with respect to the origin of the muon track of less than 1mm, to avoid contamination from in-time pileup. The combined number of hits in the pixel and silicon strip detectors for these tracks is required to be at least four.
5.3 Event preselection
An initial sample of events containing three isolated leptons (electrons or muons) is selected as described below.
• Data Quality
- All events are required to satisfy the data quality requirements described in Sec- tion 3. In addition, a set of cleaning requirements is applied to energy clusters in the calorime- ter [50]. These reject events with a significant energy in the calorimeters from effects such as cosmic rays, beam-halo and beam-gas interactions, and instrumental noise.
• Primary Vertex
- The primary vertex is required to have five or more associated tracks with p
T>0.4 GeV that are consistent with emerging from the beam spot. Interaction vertices are sorted in
Σ(p
trackT)
2, the sum of track p
T2, and the vertex with the maximum sum is selected as the primary vertex for this analysis.
• Trigger
- Events are selected from the single-lepton trigger streams. The online p
Tthresholds
varied slightly during the 2011 data taking as the instantaneous luminosity increased. In order to
avoid uncertainties associated with the trigger efficiency each event is required to have at least one
lepton in the plateau region of high efficiency. For an electron this corresponds to p
T >23 GeV
and
|η|<2.47 and for a muon it is p
T >20 GeV and
|η|<2.4.
• Multi-lepton requirements
- Events with a pair of leptons having the same flavor, opposite charge, and m(`
+`−)
<12 GeV are removed. The cut matches the phase space requirement applied to the simulated event samples. In the data it also removes events with pairs of energetic leptons from decays of heavy hadrons such as J/ψ
→ `+`−. The requirement has a negligible impact on the signal acceptance. Two leptons are considered to overlap if
∆R(`1, `2)
<0.1. An overlapping electron and muon are excluded, as is the softer of two overlapping electrons.
5.4 Jet definition
For this analysis, jets are reconstructed using the FJ implementation of the anti-k
tjet algorithm [51], with four-momentum recombination and a distance parameter R
=0.4. Jets are constructed from uncal- ibrated clusters of calorimeter cell energies [52]. The measured jet transverse momentum at the electro- magnetic energy scale is corrected for the non-compensating nature of the calorimeter, the presence of dead material, and in-time pileup as described in Ref. [53]. These corrections are derived using in situ techniques with data. Jets are required to have p
T >30 GeV and
|η|<2.8.
Jets entering the analysis are required to be separated by
∆R>0.2 from a selected lepton. The eventis kept if a jet is within 0.2 of a lepton but the jet is not used for the event selection. This removes the effects of energy sharing or double-counting between the lepton and near-by jet. The effect is most pronounced in the electron channel.
To reject jets originating from pileup interactions a quantity called the jet-vertex fraction (JVF) is calculated for each jet in the event using tracks associated with the jet. This is defined as a ratio of the scalar sum of p
Tof the associated tracks that originate from the primary vertex to the scalar sum of p
Tof all tracks associated with the jet. Jets are required to have a jet vertex fraction of
|JVF| >0.75. TheJVF cannot be calculated for jets which fall outside the tracking fiducial region (|η|
<2.5) or which haveno matching tracks. These jets are assigned a value JVF=-1 and are thus accepted by the requirement
|JVF|>0.75.
5.5 Calculation of missing transverse momentum
The missing transverse momentum E
missTis calculated as the negative vector sum of transverse momenta of the reconstructed jets, electrons, muons, and topological clusters that are not included in the electrons, muons, and jets. For this calculation, electrons are selected with p
T >15 GeV. Muons and electrons are required to satisfy all the baseline selection requirements except that of isolation. Jets are defined by the anti-k
talgorithm with R
=0.4 and are required to have p
T>20 GeV.
5.6 Lepton-related corrections to experimental data and simulations
Corrections to the reconstruction efficiencies of leptons are applied to the simulated events. Corrections from trigger inefficiencies are expected to be negligible given that the selected final states contains at least three leptons. Efficiencies of the single-lepton triggers are in the range of 80%-90% for muons and 95%-99% for electrons. These are well modeled in the simulation and corrections to the simulated single-lepton trigger efficiencies are less than 10% (relative). Approximately 97% of the tri-lepton events contain at least two leptons in the fiducial kinematic range for the single-lepton triggers and hence the overall trigger efficiency for the three-lepton final states is close to 100%.
5.7 Final event selection and definition of the tri-lepton sample
The final tri-lepton sample is derived from the preselected sample with some additional requirements.
After removing overlaps, the leptons are ordered in p
Tto apply additional selection and classification
requirements. The total charge of the first three leptons is required to be
±1. This follows from the factthat the SUSY scenarios targeted in this analysis present a signature with four W bosons of net charge equal to zero, and hence the selection of any three should have a net charge of
±1.We impose an additional requirement on an electron present among the three leptons. These re- quirements are only applied to the softest electron which has the same charge as the net charge of the three leptons. Additional constraints are imposed on the ratio between the energy of the electron cluster and the momentum of the track, E/ p, and on the track-cluster match in
φ. Criteria to suppress photonconversions are also applied.
The SUSY decays can produce tri-lepton final states with a pair of same-charge, same-flavor leptons and a lepton of a different flavor. The SM cross section for such a final state is extremely low. To exploit the lepton charge and flavor information we classify the events into six categories depending on the number of observed electrons and the charge of the same-flavor pair when the third lepton is of a different flavor. Only the three leading leptons are used in the classification. Events with additional reconstructed leptons are kept. These charge/flavor categories are as follows:
• 0e
- events with three muons and no electrons,
• 1eOS
- events with an electron and two oppositely-charged muons,
• 1eSS
- events with an electron and two same-charge muons,
• 2eOS
- events with a muon and two oppositely-charged electrons,
• 2eSS
- events with a muon and two same-charge electrons,
• 3e
- events with three electrons.
The SM backgrounds differ depending on the category, while the expected contributions from the SUSY signal to the six categories are well defined for the SUSY final states with four W bosons. Thus the population of these categories is an important indicator of the source of any signal. Typical values of the signal selection kinematic acceptance times detector efficiencies are 0.9-1.5% for the pair-production of gluinos and 0.4-0.6% for sbottom pair-production. These values include the branching ratios for the leptonic decays of W bosons.
6 Signal and control regions
The tri-lepton events are divided into four non-overlapping kinematic regions, consisting of three control regions and a signal region. The control regions are used to estimate the SM backgrounds in the signal region. The regions are:
•
Z-boson control region - Events have a pair of leptons with opposite charge, same flavor, and 81
<m(`
+`−)
<101 GeV.
• Low-ETmisscontrol region
- Events have E
Tmiss<50 GeV and are not in the Z-boson control region.
•
t¯ t
control region- Events have fewer than four jets, E
missT >50 GeV, and are not in the Z-boson control region.
• Signal region
- Events have four or more jets, E
missT >50 GeV, and are not in the Z-boson control
region.
Each region contains some or all of the six tri-lepton charge/flavor categories and the relative strength of the various background processes varies with category. Expected contamination of the control regions with the SUSY processes is low, with the t t ¯ control region being the most affected. Typical signal contaminations are below 1%, the worst expected signal contamination being about 5% for sbottom pair-production and m(˜ b)
∼410 GeV.An important source of tri-lepton events in the signal region is expected to be real SM processes lead- ing to three prompt leptons. These are predominantly t¯ t+W, t¯ t+Z final states accompanied by additional jets. These rates are calculated from MC simulation.
The dominant source of background is processes with two real prompt leptons and a third misidenti- fied lepton (referred as “fake”). The fake can arise from the real, non-prompt decays of heavy hadrons, although these are suppressed by the lepton isolation requirement and the requirement on the transverse impact parameter of the track. Fakes can also arise from the misidentification of light hadrons as leptons.
Again, these are suppressed by the lepton isolation and identification requirements. The probabilities of jets and photons faking a lepton are obtained from MC simulations and corrected with experimental data. The corrections are derived by using data in the control regions and their different charge-flavor populations. Processes likely to contribute to this background are t¯ t, WW , and Z final states accompanied by additional jets.
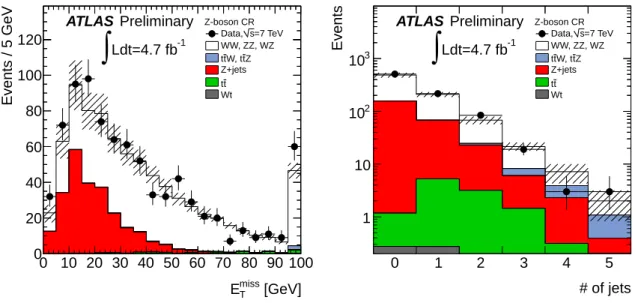
Figure 2(a) provides the comparison of data with MC for the E
missTdistribution in events contributing to the Z control region. Figure 2(b) shows the corresponding jet multiplicities. As can be seen from the plots, the WZ and ZZ channels dominate these distributions and in all cases the data are well described.
Corresponding plots for the t t ¯ control region are shown in Fig. 3. Data and SM predictions are found in agreement for the control regions.
[GeV]
miss
ET
0 10 20 30 40 50 60 70 80 90 100
Events / 5 GeV
0 20 40 60 80 100 120
Z-boson CR
=7 TeV s Data, WW, ZZ, WZ
Z t W, t t t Z+jets
t t Wt
ATLAS Preliminary Ldt=4.7 fb-1
∫
# of jets
0 1 2 3 4 5
Events
1 10 102
103
Z-boson CR
=7 TeV s Data, WW, ZZ, WZ
Z t W, t t t Z+jets
t t Wt
ATLAS Preliminary Ldt=4.7 fb-1
∫
Figure 2: Distributions of
EmissT(left) and jet multiplicity (right) for events from the
Z-boson controlregion. The right-most bin includes overflow. The hashed band represents the sum of systematic uncer- tainties on the SM predictions.
6.1 Estimation of fake lepton background
H is used to simulate the parton showering and hadronization for processes leading to a “fake”
lepton. The A+H and S samples with tree-level matrix element calculations matched
[GeV]
miss
ET
50 100 150 200 250 300
Events / 25 GeV
0 10 20 30 40 50 60 70
CR t t
=7 TeV s Data, WW, ZZ, WZ
Z t W, t t t Z+jets
t t Wt
ATLAS Preliminary Ldt=4.7 fb-1
∫
# of jets
0 1 2 3
Events
0 10 20 30 40 50
60 tt CR
=7 TeV s Data, WW, ZZ, WZ
Z t W, t t t Z+jets
t t Wt
ATLAS Preliminary Ldt=4.7 fb-1
∫
Figure 3: Distributions of
EmissT(left) and jet multiplicity (right) for events from the
t¯tcontrol region.
The right-most bin includes overflow. The hashed band represents the sum of systematic uncertainties on the SM predictions.
to parton showering (ME+PS) are used to obtain predictions for events with high jet multiplicities. Al- though the rates for fake leptons are estimated by these calculations, the estimates are adjusted by intro- ducing four scale factors which are determined from fits to the data in various control regions.
The scale factors are different for electrons and muons, and depend on whether the fake originates from heavy-flavored or light-flavored hadrons. They are defined as follows:
•
light-flavor jet faking an electron, S (LF→ e), (applied to Z+jets and WW+jets),
•
light-flavor jet faking a muon, S (LF→
µ), (applied toZ+jets and WW+jets),
•
heavy-flavor jet faking an electron, S (HF→ e), (applied to Z
+b b+jets, ¯ Wt, and t t), ¯
•
heavy-flavor jet faking a muon, S (HF→
µ), (applied toZ
+b b+jets, ¯ Wt, and t¯ t).
These corrections are applied to the normalization of the t¯ t, Z+jets, Z
+b b+jets, ¯ Wt, and WW+jets processes. Initially, the total yields of all background processes are normalized using the integrated lu- minosity and the predicted cross sections at the highest available accuracy. The expected rates for events with a “fake” lepton in a given tri-lepton category are multiplied by an appropriate linear combination of the electron and muon scale factors, S (process→
`). The linear combinations are shown in Table 1.A likelihood function is defined in terms of the four fake-rate scale factors and the Poisson probabil- ities based on the observed and expected numbers of events in binned distributions. Sixteen distributions are selected from the possible flavor and charge categories in the three control regions:
•
four distributions of E
missTfor the flavor and charge categoris in the Z-boson control region,
•
four distributions of E
Tmissfor the flavor and charge categories excluding those with leptons of the same charge and flavor in the low-E
missTcontrol region,
•
two distributions of jet multiplicity for the low-E
Tmisscontrol region for charge-flavor final states
with two leptons of the same charge and flavor,
Process 0e 1eOS 1eSS 2eOS 2eSS 3e
Z+jets,Z→ee S
(LF→
µ) S(LF→
µ) S(LF→
e)Z+jets,Z→µµ S
(LF→
µ) S(LF→
e) S(LF→
e)Z+bb+jets,
¯
Z→ee S(HF→
µ) S(HF→
µ) S(HF→
e)Z+bb+jets,
¯
Z→µµ S(HF→
µ) S(HF→
e) S(HF→
e)tt
¯
S(HF→
µ) Sc(HF)
S(HF→
µ) Sc(HF)
S(HF→
e) S(HF→
e) Wt S(HF→
µ) Sc(HF)
S(HF→
µ) Sc(HF)
S(HF→
e) S(HF→
e) WW+jets S(LF→
µ) Sc(LF)
S(LF→
µ) Sc(LF)
S(LF→
e) S(LF→
e)Table 1: The multiplicative fake-rate scale factors are applied to the simulated processes depending on the flavors and charges of the final-state leptons. Since some processes contribute through both fake electrons and muons, the linear combinations
Sc(HF)
={e·S(HF
→µ)+µ·S(HF
→e)}/(e+µ) and
Sc(LF)
={e·S(LF
→µ)+µ·S(LF
→e)}/(e+µ) are defined, where
eand
µare the reconstruction efficiencies for electrons and muons. The scale factors are not applied to
WZ, ZZ, t¯t+W, and t¯t+Zsamples. The
Z+jets and Z+bb+jets samples with¯
Z→µµdo not contain events with two same-sign muons and an electron.
•
six distributions of jet multiplicity for the flavor and charge categories in the t¯ t control region.
The distributions are chosen for variables that provide the best separation between processes with three prompt leptons, and with a “fake” lepton. Distributions other than these sixteen are used to validate accuracy of the background simulations.
The minimization of the negative log likelihood leads to scale factors that range from 0.9 to 1.6, with statistical uncertainties between 0.1 and 0.65. The scale factors are consistent with unity within the uncertainties. The statistical uncertainty on the factors is included as an uncertainty on the expected number of background events.
7 Systematic Uncertainties
The expected rates of the SUSY signals and the SM backgrounds depend on a number of parameters that are sources of systematic uncertainty. Variations of these parameters are applied at the same time to both the SM backgrounds and SUSY signal to account for correlations between them. Uncertainties due to the limited statistics of the MC simulations are included.
The dominant detector-related uncertainties, affecting both background and signal predictions, arise from the jet energy scale (JES) and and jet energy resolution (JER). These are determined from in- situ measurements and simulations [53]. The uncertainties on JES include those due to the close-by jets [54], unknown jet flavor composition [55], and pileup interactions [56]. The JES uncertainty varies as a function of jet p
Tand
η, and ranges from∼2.5% at 60 GeV in the central region to
∼14% below 30 GeV in the forward regions. The uncertainty increases monotonically with the absolute value of jet pseudo-rapidity. The uncertainty on the correction of the JES for pileup pp interactions is less than 1.5%
per additional interaction for jets with p
T>50 GeV. The uncertainty on the JER ranges from 2% to 5%depending on the
ηand p
Tof the jet. The altered jet energies are also propagated into the calculation of E
missT. In addition, an uncertainty on the energy of clusters in the calorimeters not associated with a jet or electron, such as those from the underlying event and pileup interactions is also included.
Other less important sources of detector-related uncertainties are due to the lepton momentum/energy
scale and resolution, and the data-driven scale factors for lepton efficiencies. The uncertainty from pileup
is estimated by varying rate of the pile-up interactions in the simulated samples by 10%. The effects are
found to be small.
Important contributions to the uncertainties on the background estimations also arise from the scale factors for the fake rates (see Section 6.1), integrated luminosity, the available statistics from MC simu- lations, and theoretical uncertainties on cross sections of contributing processes (see Section 4).
The detector-related uncertainties are also applied to the SUSY samples and are less than 5%. The dominant source is the uncertainty on jet energy scale followed by the uncertainties on luminosity and efficiencies of lepton identification. These, however, are much smaller than the theoretical uncertainties on the signal cross section. In gluino-mediated stop models, theoretical uncertainties increase with the gluino mass, from 15% at m
g˜ =400 GeV to over 30% for m
g˜above 1000 GeV. They are dominated by uncertainties on the PDFs, which increase from about 10% to over 25% as the gluino mass increases.
For the sbottom pair-production models, the uncertainties are roughly constant at 15%.
8 Results and Interpretation
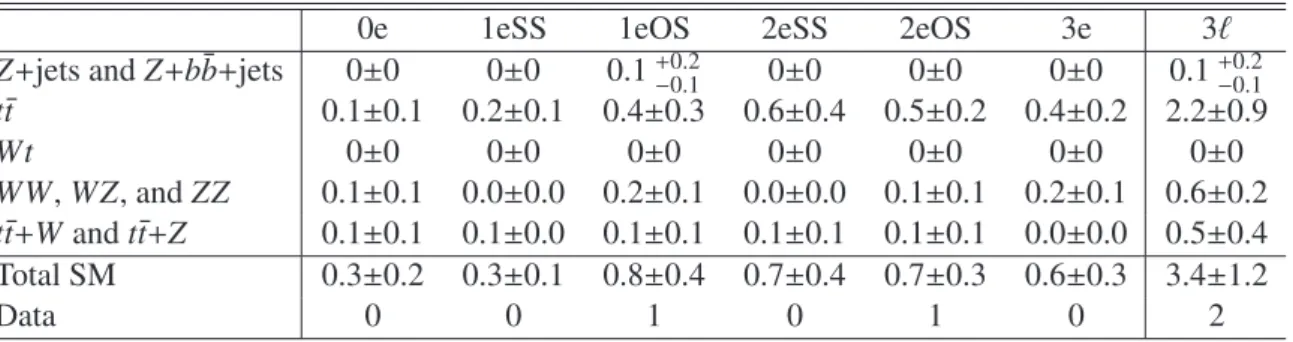
The number of events observed in data and the number of expected events from SM backgrounds in the tri-lepton signal region and in each of the six categories are shown in Table 2. Good agreement is observed between data and the SM predictions in the six final states. We expect 3.4±1.2 (stat.⊕syst.) events and we observe 2 events. Figure 4 shows distributions in jet multiplicity for data, SM predictions, and two SUSY models. The SUSY models feature higher jet multiplicities than the SM predictions and data.
0e 1eSS 1eOS 2eSS 2eOS 3e 3`
Z+jets andZ+bb+jets
¯ 0±0 0±0 0.1
+0.2−0.10±0 0±0 0±0 0.1
+0.2−0.1 tt¯ 0.1±0.1 0.2±0.1 0.4±0.3 0.6±0.4 0.5±0.2 0.4±0.2 2.2±0.9
Wt
0±0 0±0 0±0 0±0 0±0 0±0 0±0
WW
,
WZ, andZZ0.1±0.1 0.0±0.0 0.2±0.1 0.0±0.0 0.1±0.1 0.2±0.1 0.6±0.2
tt+W¯ and
tt+Z¯ 0.1±0.1 0.1±0.0 0.1±0.1 0.1±0.1 0.1±0.1 0.0±0.0 0.5±0.4 Total SM 0.3±0.2 0.3±0.1 0.8±0.4 0.7±0.4 0.7±0.3 0.6±0.3 3.4±1.2
Data 0 0 1 0 1 0 2
Table 2: Expected number of events from SM backgrounds and number of events observed in data in tri-lepton signal region. Numbers are shown for each of the six categories. Uncertainties on the back- grounds include statistical and systematic uncertainties. Correlations between uncertainties are taken into account. The
tt¯ production is the dominant background.
The CL
sprescription [57] is used to set model independent upper exclusion limits at 95% confidence level (CL) on the number of signal events in the tri-lepton signal region, using just the total numbers of the events expected and observed in the signal region. Systematic uncertainties on the SM background predictions are included in the limit. An upper limit on the visible cross section (defined as cross section times kinematic acceptance times efficiency) of possible new physics processes is also derived. The observed (expected) upper limit on the number of signal events is 5.6 (7.2). The observed (expected) limit on the visible cross section is 1.2 (1.5) fb.
The results are also interpreted in the context of the following SUSY simplified models:
•
gluino-mediated stop production; pp
→g˜
g, where gluinos always decay into two top quarks and˜ a neutralino via a heavy off-shell stop: ˜
g →t¯ ˜ t
→t¯ t
χ˜
01and m
t˜=1.2 TeV. Exclusion limits arepresented in the m
g˜−m
χ˜01
plane.
[GeV]
miss
ET
50 100 150 200 250 300
Events / 25 GeV
0 0.5 1 1.5 2 2.5 3 3.5
4 Signal Region
=7 TeV s Data, WW, ZZ, WZ
Z t W, t t t Z+jets
t t Wt
0350 χ∼
800, g~
080 χ∼
160, χ∼±
400, b~
ATLAS Preliminary Ldt=4.7 fb-1
∫
# of jets
4 5 6 7 8 9 10 11
Events
0 0.5 1 1.5 2 2.5 3 3.5
4 Signal Region
=7 TeV s Data, WW, ZZ, WZ
Z t W, t t t Z+jets
t t Wt
0350 χ∼
800,
~g
080 χ∼
160, χ∼±
400,
~b
ATLAS Preliminary Ldt=4.7 fb-1
∫
Figure 4: Distributions of
EmissT(left) and jet multiplicity (right) for events from the signal region. The hashed band represents the sum of systematic uncertainties on the SM predictions.
•
direct sbottom production; pp
→b ˜ b, where the sbottom always decays as ˜ ¯˜ b
→t
+χ˜
±1and the chargino subsequently decays as ˜
χ±1 →W
±+χ˜
01. Exclusion limits are presented in the m
b˜ −m
χ˜0plane, assuming m
χ˜± 11 =
2m
χ˜01
and above the experimental LEP limit of about 104 GeV, and in the m
b˜−m
χ˜±1
plane, assuming m
χ˜01=60 GeV.
Exclusion limits at 95% CL are calculated summing together the six categories in the tri-lepton signal region. Systematic uncertainties associated with jets, E
missT, pileup, leptons and luminosity are treated as fully correlated between signal and backgrounds. All other uncertainties are assumed to be uncorrelated.
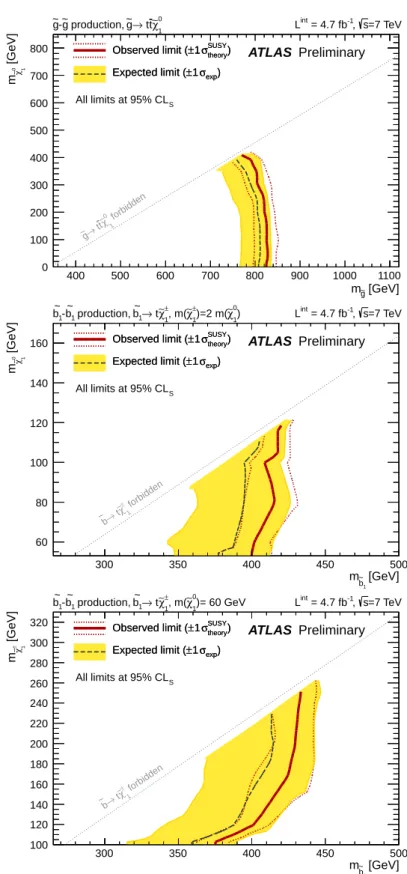
The expected and observed exclusion limits at 95% CL are shown in Fig. 5. The yellow band around the expected limit shows the
±1σresults including all systematic uncertainties except theoretical un- certainties on the SUSY cross section. The
±1σSUSYTheorylines around the observed limit are obtained by changing the SUSY cross section by
±1σ(where
σis defined as described in Section 4). All limits quoted later in this section are derived from the
−1σSUSYTheoryline, which is the most conservative hypothe- sis.
Thanks to the low requirement on E
missT, the limit for gluino-mediated stop production only depends very weakly on the neutralino mass. Gluino masses below 800 GeV are excluded for m
χ˜01 <
220 GeV.
Neutralino masses below 380 GeV are excluded for gluino masses below 740 GeV. This search excludes models with gluino masses between 740 and 780 GeV and with neutralino masses in the region close to the line delimiting the area in which ˜
g →t t ¯
χ˜
01is kinematically not allowed, thus extending limits set by previous ATLAS analyses [58] in this region.
In direct sbottom production models, in the m
b˜ −m
χ˜01
plane, sbottom masses below 370 GeV are excluded for m
χ˜01=53 GeV and sbottom masses of 410 GeV are excluded for
m
χ˜01=110 GeV. In the
m
b˜−mχ˜±plane, sbottom masses of up to 360 GeV are excluded for chargino masses of 100 GeV. Chargino masses
1of about 200 GeV are excluded for sbottom masses of 410 GeV. These are the first limits set by ATLAS
in this hypothesis.
[GeV]
g~
m
400 500 600 700 800 900 1000 1100
[GeV] 1 0χ∼m
0 100 200 300 400 500 600 700 800
forbidden
1
χ0
∼t
→ t
~g
1
χ∼0
t
→ t g~ production, g~
-
~g Lint = 4.7 fb-1, s=7 TeV
ATLAS Preliminary
theory) σSUSY
±1 Observed limit (
exp) σ
±1 Expected limit (
All limits at 95% CLS
theory) σSUSY
±1 Observed limit (
exp) σ
±1 Expected limit (
[GeV]
b1
m~
300 350 400 450 500
[GeV] 1 0χ∼m
60 80 100 120 140 160
forbidden
1
χ±
t∼ b→
~
1) χ∼0
)=2 m(
1
χ∼± 1, m(
χ∼±
→ t b~1
production, b~1
1- b~
=7 TeV s
-1, = 4.7 fb Lint
ATLAS Preliminary
theory) σSUSY
±1 Observed limit (
exp) σ
±1 Expected limit (
All limits at 95% CLS
theory) σSUSY
±1 Observed limit (
exp) σ
±1 Expected limit (
[GeV]
b1
m~
300 350 400 450 500
[GeV] 1±χ∼m
100 120 140 160 180 200 220 240 260 280 300 320
forbidden
1
χ±
t∼ b→
~
)= 60 GeV
1
χ∼0 1, m(
χ∼±
→ t b~1
production, b~1
1- b~
=7 TeV s
-1, = 4.7 fb Lint
ATLAS Preliminary
theory) σSUSY
±1 Observed limit (
exp) σ
±1 Expected limit (
All limits at 95% CLS
theory) σSUSY
±1 Observed limit (
exp) σ
±1 Expected limit (
Figure 5: Expected and observed exclusion limit at 95% CL for gluino-mediated stop production in the
mg˜ −mχ˜01
plane (top) and direct sbottom production in the
mb˜ −mχ˜01
(middle) and
mb˜ −mχ˜±1
(bottom)
planes.
9 Conclusions
We have presented a search for supersymmetry in final states with three energetic leptons, multiple jets, and missing transverse momentum. The analysis is performed using 4.7 fb
−1of data from proton-proton collisions at a center of mass energy of 7 TeV at the LHC, corresponding to the full ATLAS data sample from 2012.
The number of events observed in the signal region is found to be in good agreement with the ex- pectations from SM backgrounds. The results are interpreted in the context of simplified SUSY models.
Exclusion limits at 95% CL are provided in the m
g˜−m
χ˜01