ATLAS-CONF-2012-046 14May2012
ATLAS NOTE
ATLAS-CONF-2012-046
May 14, 2012
Search for physics beyond the Standard Model in events with a Z boson and large missing transverse momentum with the ATLAS detector
The ATLAS Collaboration
Abstract
This note presents a search for supersymmetry in the final state defined by a
Zboson and missing transverse momentum. The analysis uses a data sample collected during the first half of 2011 that corresponds to a total integrated luminosity of 1.04 fb
−1of
√s=
7 TeV proton- proton collisions recorded with the ATLAS detector at the Large Hadron Collider. No excess above the Standard Model background expectation is observed. The results are interpreted in the context of a general gauge mediation (GGM) scenario, where the lightest neutralino, which is the next-to-lightest supersymmetric particle, is higgsino-like. For higgsino masses in the range 200
−640 GeV, gluino masses up to 600
−700 GeV are excluded at 95% CL.
c
Copyright 2012 CERN for the benefit of the ATLAS Collaboration.
Reproduction of this article or parts of it is allowed as specified in the CC-BY-3.0 license.
1 Introduction
Supersymmetry (SUSY) [1–9] is one of the most popular extensions of the Standard Model (SM) that provides solutions to some of its shortcomings. SUSY transformations turn bosonic states into fermionic states, and vice versa. The minimal supersymmetric extension to the SM (MSSM) [10–14] predicts a supersymmetric partner (or superpartner) for each SM particle, that di
ffers in spin by 1
/2 from its SM counterpart. In R-parity conserving SUSY [10–14], each supersymmetric interaction involves an even number of sparticles, and as a result there exists a lightest supersymmetric particle (LSP) that must be stable. In many SUSY models, the LSP serves as a viable candidate for non-baryonic dark matter.
Assuming R-parity conservation, SUSY production is characterized by pair-produced sparticles, which then decay via long chains, otherwise known as “cascades”, into final states involving LSPs.
Because evidence for supersymmetric particles has not yet been found, if SUSY exists, it must be a broken symmetry, allowing the superpartners to be heavier than the corresponding SM particles.
One popular scenario that provides a formalism to explain the mechanism of SUSY breaking, which in turn gives rise to the superpartner masses and interactions, is gauge-mediated supersymmetry breaking (GMSB). In GMSB models [15–20], SUSY is broken in a hidden sector and the SUSY breaking is prop- agated to the visible sector via SM-like S U(3)
C×S U(2)
L×U(1)
Ygauge boson and gaugino interactions of some new chiral supermultiplets, called messengers, and the MSSM particles. The main advantage of GMSB models relative to the minimal supergravity and anomaly mediated SUSY breaking models is that scalars with the same gauge quantum numbers, but different flavors, have identical soft SUSY breaking masses. As a result, flavor-changing neutral currents (FCNC) are suppressed.
In GMSB, the gravitino ( ˜ G) is the LSP (in general m( ˜ G) 1 keV). The gravitino escapes detection, leading to missing transverse momentum (denoted
pmissTand its magnitude E
Tmiss). The phenomenology of GMSB models is determined by the nature of the next-to-lightest supersymmetric particle (NLSP), which for a large part of the GMSB parameter space is the lightest neutralino ˜ χ
01.
Neutralinos are mixtures of gaugino ( ˜ B, ˜ W
0) and higgsino ( ˜ H
u0, ˜ H
0d) eigenstates, and therefore the lightest neutralino decays to a ˜ G and either a γ, Z, or Higgs boson (H). If the ˜ χ
01is bino-like, the main decay mode is ˜ χ
01 →γ G. If the ˜ ˜ χ
01is higgsino-like, it decays as ˜ χ
01 →H G. In addition, since ˜ the longitudinal polarization component of the Z boson is also a Goldstone mode of the Higgs field, a higgsino-like neutralino can also decay as ˜ χ
01 →Z G. Consequently, a pair of ˜ ˜ χ
01s produced in a collider can give rise to the diboson final states (HH, Hγ, HZ, Zγ, ZZ, γγ)
+E
missT. The Z-rich case of higgsino- like neutralino NLSPs, where BR( ˜ χ
01 →H G) is negligible, is considered in this paper. In this scenario ˜ both neutralinos decay as ˜ χ
01→Z G, leading to the final state ˜ ZZ
+E
missT. Due to the low branching ratio of Z to leptons, the four lepton final state has a low acceptance times branching ratio. Therefore, the final state that includes at least one Z boson which decays to a pair of electrons or muons is considered here.
Searches for GMSB at the Tevatron were interpreted in a simplified GMSB scenario using a minimal GMSB model, where the ˜ χ
01is bino-like [21, 22]. In recent years, the e
ffort to formulate GMSB in a model-independent way has led to the development of general gauge mediation (GGM) [23, 24]. GGM includes an observable sector with all the MSSM fields, together with a hidden sector that contains the source of SUSY breaking In GGM, there need not be any hierarchy between colored and uncolored states, and thus there is no theoretical constraint on how light the colored states can be. Removing this constraint raises the probability of GGM discovery even with early LHC data. Both ATLAS and CMS have performed searches for GGM models with bino–like ˜ χ
01s [25, 26]. CMS also performed a search for wino–like ˜ χ
01GGM [27]. No excesses above the SM background expectations were observed.
In the GGM SUSY models considered in this analysis and suggested in [28, 29], the gluino mass
(m( ˜ g)) and the higgsino mass parameter (m( ˜ H)) are treated as free parameters. All other sparticle masses
are fixed at
∼1.5 TeV, which leads to gluino pair production via strong interactions being the dominantproduction mode. The gluinos then cascade-decay into final states involving the NLSP ˜ χ
01and jets. The
U(1) and S U(2) gaugino mass parameters (M
1and M
2) are fixed to 1 TeV. In this particular region of parameter space, the two lightest neutralinos ( ˜ χ
01and ˜ χ
02) and lightest chargino ( ˜ χ
±1) become higgsino- like. In the limit (M
1, M
2)
→ ∞, the exact relations m( ˜ χ
01)
=m( ˜ χ
02)
=m( ˜ χ
±1)
=m( ˜ H) hold true. In practice, M
1and M
2are never infinite, and therefore the effect of neutralino and chargino mixing will push the masses of ˜ χ
01, ˜ χ
02and ˜ χ
±1away from m( ˜ H). A tan β value of 1.5 was chosen to ensure ˜ χ
01→Z G ˜ is the dominant NLSP decay (BR( ˜ χ
01 →Z G) ˜
∼97%) [28]. Finally, the NLSP decay length is fixed to be cτ
NLSP< 0.1 mm.
The three-body gluino decays ˜ g
→q q ¯ χ ˜
01and ˜ g
→q q ¯ χ ˜
02followed by the higgsino-like ˜ χ
02decay χ ˜
02 →χ ˜
01f f ¯ and ˜ χ
01decay ˜ χ
01 →Z G ˜ are expected to lead to final states that are characterised by the presence of at least one Z boson, which decays to a pair of electrons or muons, and large E
missT. The E
missTresults from the undetected gravitinos. The main SM backgrounds are the Z/γ
∗+jets, t¯ t, single-top, and diboson processes. The evaluation of the instrumental Z/γ
∗+jets background, which has E
missTthat is mostly due to hadronic mismeasurement, was made using a sample of γ
+jets events. The top quark and diboson backgrounds were estimated using Monte Carlo (MC) simulation.
2 ATLAS detector
The ATLAS detector [30] is a general-purpose particle detector with forward-backward symmetric cylin- drical geometry. ATLAS consists of inner tracking devices surrounded by a superconducting solenoid, electromagnetic and hadronic calorimeters, and a muon spectrometer with a toroidal magnetic field. The inner detector (ID) consists of a silicon pixel detector, a silicon microstrip detector (SCT), and a transition radiation tracker (TRT). In combination with the 2 T field from the solenoid, the ID provides precision tracking of charged particles for
|η|< 2.5
1. The calorimeter system covers the pseudorapidity range
|η|<
4.9 and is composed of sampling calorimeters with either liquid argon (LAr) or scintillating tiles as the active media. The muon spectrometer has separate trigger and high precision tracking chambers which provide muon identification and measurement for
|η|< 2.7.
3 Simulation
Simulated MC event samples were used to model the SUSY signal and to describe the SM background.
For the GGM models, the SUSY mass spectra, the gluino branching ratios, and the gluino decay width were calculated using SUSPECT 2.41 [31] and SDECAY 1.3 [32]. The MC signal samples were generated using PYTHIA 6.423 [33] with MRST2007 LO
∗[34] parton distribution functions (PDF). The next-to-leading order (NLO) production cross-sections for the SUSY signal points were calculated using PROSPINO 2.1 [35] with the CTEQ6.6M [36] PDF set.
Single-top and t¯ t production were simulated using MC@NLO [37] with the NLO PDF set CTEQ6.6 [38].
POWHEG [39] samples were used to assess the systematic uncertainties associated with the choice of generator for t¯ t production. A
MC [40] samples were used to assess the uncertainties associated with initial and final state radiation (ISR/FSR). The Z/γ
∗+jets and W
+jets samples were generated usingALPGEN [41] with PDF set CTEQ6L1 [42] and normalized to inclusive next-to-next-to-leading (NNLO) cross-sections. Parton showering and fragmentation were simulated by the HERWIG [43] generator with JIMMY [44] generating the underlying event. Diboson (ZZ, WZ and WW) samples were generated with HERWIG and normalized to NLO cross-sections.
1ATLAS uses a right-handed coordinate system with its origin at the nominal interaction point in the centre of the detector and thez-axis coinciding with the axis of the beam pipe. Thex-axis points from the IP to the center of the LHC ring, and the y-axis points upward. Cylindrical coordinates (r,φ) are used in the transverse plane,φbeing the azimuthal angle around the beam pipe. The pseudorapidity is defined in terms of the polar angleθasη=−ln tan(θ/2). The distance∆R in theη−φspace is defined as∆R=p
(∆η)2+(∆φ)2.
All samples were processed through the GEANT4 simulation [45, 46] of the ATLAS detector [30].
The in-time and out-of-time pile-up conditions, which result from multiple proton-proton interactions per crossing, were taken into account by overlaying minimum-bias events on the hard-scattering process in each MC sample. The simulated events were then reweighted such that the distribution of the number of interactions per crossing in MC matched the one observed in data.
4 Object and Event Selection
The analysis is performed using data recorded in proton-proton collisions at a center-of-mass energy of 7 TeV, corresponding to an integrated luminosity of
RL
dt
=1.04
±0.04 fb
−1[47] after the application of beam, detector and data quality requirements. Events are selected using single electron and muon triggers that have constant e
fficiency as a function of lepton transverse momentum (p
T) above the o
ffline p
Tcuts used in the analysis. The photon data sample, required for the evaluation of the instrumental Z/γ
∗+jets background, is collected using a single photon trigger that selects a stream of photon events using a p
Tthreshold of 40 GeV. This photon trigger, which is prescaled to maintain reasonable trigger rates during data taking, selects a data sample corresponding to an integrated luminosity of
RL
dt
=80.8
±3.0 pb
−1.
Jets are reconstructed using the anti-k
tjet clustering algorithm [48] with a distance parameter of R
=0.4 (in y
−φ space). Jets are required to have p
T> 20 GeV and lie within
|η|< 2.8. Electron candidates are required to have p
T> 20 GeV and
|η|< 2.47 and pass the “medium” shower shape and track selection criteria [49]. Muon candidates within
|η|< 2.4 are considered, and their p
Tmust be greater than 10 GeV. Muons are identified by matching an extrapolated inner detector track and one or more track segments in the muon spectrometer [50]. The leading lepton is required to have p
T> 25 GeV if it is an electron and p
T> 20 GeV if it is a muon. Photon candidates are required to have p
T> 45 GeV and
|η|< 1.81, removing
|η| ∈[1.37, 1.52], and must satisfy the “tight” selection criteria [51]. To avoid overlap, any electron within
∆R < 0.01 of a selected photon is discarded. In addition, any jet within
∆R < 0.2 of any remaining electron is removed. Finally, electron or muon candidates within
∆R < 0.4 of any remaining jet are also discarded. The missing transverse momentum is calculated from the energy deposited in calorimeter cells inside three-dimensional clusters with
|η|<
4.9 and is corrected for contributions from muons, if any [52]. The cluster energy is calibrated to correct for the non-compensating calorimeter response, energy loss in dead material, and out-of-cluster energy.
After performing the baseline object selection described above, including jet overlap removal, elec- tron candidates must pass the “tight” selection criteria [49], which adds a requirement on the ratio E/p, where E is the calorimeter cluster energy and p is the track momentum, and the detection of transition radiation. Furthermore, an isolation requirement is imposed by requiring that the sum of the p
Tof tracks within
∆R < 0.2 around an electron candidate must be less than 10% of the electron p
T. Muon candidates must have longitudinal and transverse impact parameter values within 1 mm and 0.2 mm of the primary vertex, respectively, and are required to be isolated. The isolation requirement is that the sum of the p
Tof tracks within
∆R < 0.2 around a muon candidate is less than 1.8 GeV.
Events that contain at least two muons or electrons with opposite charge with an invariant mass in a window around the Z boson mass, [81, 101] GeV, are selected.
When plotting kinematic distributions of the Z-selected events, two representative GGM signal points, which are characterised by the gg
→g˜ ˜ g production mechanism, are chosen to illustrate the SUSY contribution:
•
m( ˜ g)
=300 GeV, m( ˜ H)
=120 GeV represents the region m( ˜ g) > m( ˜ H).
•
m( ˜ g)
=300 GeV, m( ˜ H)
=290 GeV represents the region m( ˜ g)
≈m( ˜ H).
[GeV]
miss
ET
0 50 100 150 200 250 300
Events / 20 GeV
10-1
1 10 102
103
104
105
106 Data 2011
SM Background
*+jets γ Z/
top dibosons
H=120
=300, m~
~g
GGM m
H=290
=300, m~
~g
GGM m
=7 TeV s
-1, L dt ~ 1.04 fb
∫
ee channelATLAS Preliminary
[GeV]
miss
ET
0 50 100 150 200 250 300
Data / SM
0 0.5 1 1.5 2
[GeV]
miss
ET
0 50 100 150 200 250 300
Events / 20 GeV
10-1
1 10 102
103
104
105
106
Data 2011 SM Background
*+jets γ Z/
top dibosons
H=120
=300, m~ g~
GGM m
H=290
=300, m~ g~
GGM m
=7 TeV s
-1, L dt ~ 1.04 fb
∫
µµ channelATLAS Preliminary
[GeV]
miss
ET
0 50 100 150 200 250 300
Data / SM
0 0.5 1 1.5 2
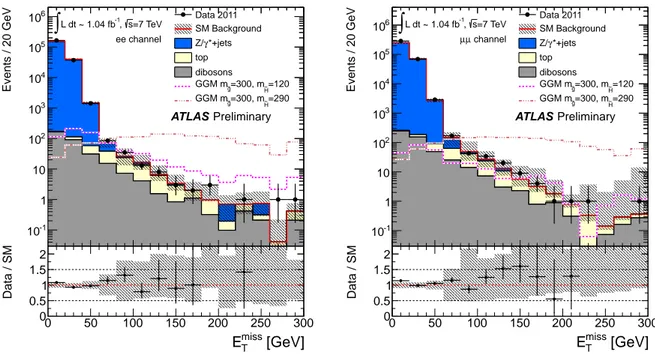
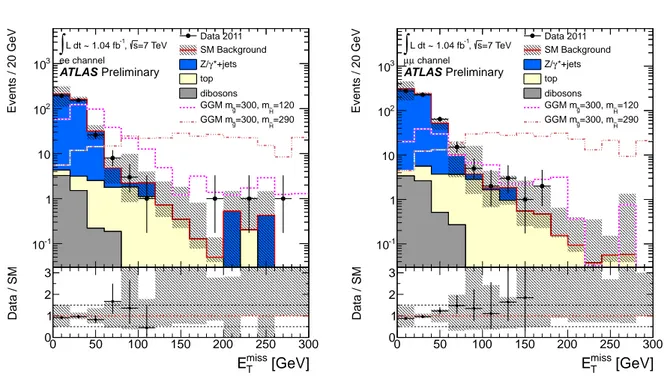
Figure 1: Distribution of E
Tmissfor data and MC events after Z
→e
±e
∓(left) and Z
→µ
±µ
∓(right) selections. Two GGM signal points are included. The first point was produced with m( ˜ g)
=300 GeV and m( ˜ H)
=120 GeV, and the second with m( ˜ g)
=300 GeV and m( ˜ H)
=290 GeV. The plot labeled “Data/SM”
shows the ratio of the distribution from data to that of the total SM background. The error bars on the data represent statistical uncertainties. The hatched grey band represents the systematic uncertainties on the MC expectation without uncertainties on the t¯ t generator and ISR/FSR effects. The plots include the overflow bin.
By examining these GGM grid points, one can see how the SUSY contributions from different kine- matic regions behave in the distributions of interest. The source of the E
missTin the GGM models is the G, which is produced in the decay ˜ ˜ χ
01 →Z G. As a result, ˜ E
missTdepends on m( ˜ H). This can be seen in Figure
1, which shows theE
Tmissdistribution of data and MC events after the Z mass requirement for the ee and µµ channels.
Due to the di
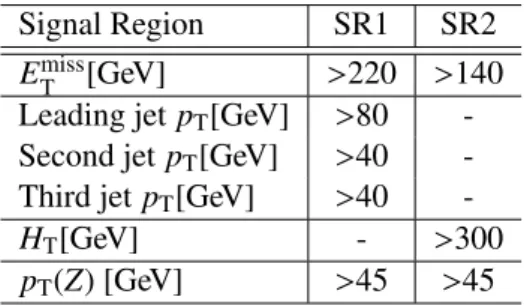
fferent kinematics of the GGM signal points, two signal regions were selected to op- timize the GGM search throughout the parameter space. The signal regions, characterised by E
Tmiss, jet multiplicity, and the scalar sum of the p
Tof all reconstructed objects (denoted H
T ≡Pi
p
jet,iT +Pi
p
lepton,iT + Pi
p
photon,iT) are defined as shown in Table
1. The cut onp
T(Z) was motivated by the trigger p
Tthreshold for the photon data sample used in the evaluation of the Z/γ
∗+jets background. The decrease in the acceptance of the signal MC due to this cut is negligible. The H
Tdistributions of data and MC events after the Z mass requirement for the ee and µµ channels are shown in Figure
2. This variable is used inthe signal region definitions to select events with high levels of hadronic activity.
5 Background Evaluation
A data-driven method for the instrumental Z/γ
∗ +jets background evaluation was developed for this analysis. The t¯ t, single-top, and diboson contributions were estimated using MC.
After the Z mass requirement, one of the dominant SM backgrounds is Z/γ
∗ +jets. Since only
Z
→ee and Z
→µµ (and not Z
→ττ) decays were selected, this background has E
missTthat mostly
stems from mismeasurement of the reconstructed objects, especially jets. To estimate the contribution of
Signal Region SR1 SR2 E
missT[GeV] >220 >140 Leading jet p
T[GeV] >80 - Second jet p
T[GeV] >40 - Third jet p
T[GeV] >40 -
H
T[GeV] - >300
p
T(Z) [GeV] >45 >45 Table 1: Criteria for each of the signal regions.
[GeV]
HT
0 200 400 600 800 1000 1200
Events / 60 GeV
10-1
1 10 102
103
104
105
106 Data 2011
SM Background
*+jets γ Z/
top dibosons
H=120
=300, m~
~g
GGM m
H=290
=300, m~
~g
GGM m
=7 TeV s
-1, L dt ~ 1.04 fb
∫
ee channelATLAS Preliminary
[GeV]
HT
0 200 400 600 800 1000 1200
Data / SM
0 0.5 1 1.5 2
[GeV]
HT
0 200 400 600 800 1000 1200
Events / 60 GeV
10-1
1 10 102
103
104
105
106 Data 2011
SM Background
*+jets γ Z/
top dibosons
H=120
=300, m~ g~
GGM m
H=290
=300, m~ g~
GGM m
=7 TeV s
-1, L dt ~ 1.04 fb
∫
µµ channelATLAS Preliminary
[GeV]
HT
0 200 400 600 800 1000 1200
Data / SM
0 0.5 1 1.5 2
Figure 2: Distributions of H
Tfor data and MC events after Z
→e
±e
∓(left) and Z
→µ
±µ
∓(right)
selections. Two GGM signal points are included. The first point was produced with m( ˜ g)
=300 GeV and
m( ˜ H)
=120 GeV, and the second with m( ˜ g)
=300 GeV and m( ˜ H)
=290 GeV. The hatched grey band
represents the systematic uncertainties on the MC expectations without uncertanies on the t¯ t generator
and ISR/FSR effects. The plots include the overflow bin.
[GeV]
miss
ET
0 50 100 150 200 250 300
Events
10-1
1 10 102
103
ee channel
=7 TeV s
-1, L ~ 1.04 fb
∫
ATLAS Preliminary
SR1
Data 2011 Z template non-Z template Fit total
[GeV]
miss
ET
0 50 100 150 200 250 300
Events
1 10 102
103
ee channel
=7 TeV s
-1, L ~ 1.04 fb
∫
ATLAS Preliminary
SR2
Data 2011 Z template non-Z template Fit total
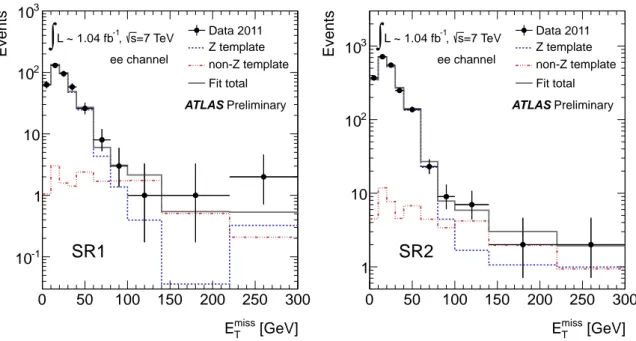
Figure 3: Distributions of the E
Tmissfor data events after SR1 (left) and SR2 (right) selection without the E
missTrequirement for the ee channel. The γ
+jets template for Z/γ
∗+jets and the non-Z MC distribution of E
missT, which serves as the template for non-Z sources, are shown on the plots.
the instrumental Z/γ
∗+jets background in the signal regions, a data control sample of γ
+jets events, which are also characterised by E
missTdue to hadronic mismeasurement, was used.
The expected contamination of the photon sample from W
+jets, top, and diboson processes, which have real E
missTand can be selected if an electron is misidentified as a photon, was evaluated based on a data-driven estimation of the electron-photon fake probability. This probability, as derived in [25], varies between 5% and 17% as a function of η, due to the distribution of material in front of the calorimeter.
To evaluate the contamination, the fake probability was applied to reconstructed electrons in MC events, which were then subtracted from the photon sample. The full difference between the contamination found using the data-driven fake probabilities and that based on simulated fake probabilities is assigned as a systematic uncertainty. The contributions from Wγ and Zγ processes to the selected photon events were found to be negligible. Contamination from multijet events was found to be small. A systematic uncertainty was applied to account for this contamination.
The expected di
fference between the E
missTdistributions of the photon and Z samples was corrected by reweighting the background subtracted photon sample, in events with E
Tmiss< 30 GeV, such that its H
Tdistribution matches that of the Z data sample. Reweighting was then applied to photon events across the whole E
Tmissspectrum.
A template method was utilised to evaluate the Z/γ
∗+jets background. The Z/γ
∗+jets E
missTtemplate derived from γ
+jets events was fit to data in each signal region over the range 0 < E
missT< 140 GeV taking the non-Z background component from MC simulation.
The results of the template fits for the estimate in SR1 and SR2 are shown for the electron channel
in Figure
3. The estimatedZ and non-Z backgrounds, after applying all the signal regions requirements,
are summarized in Section
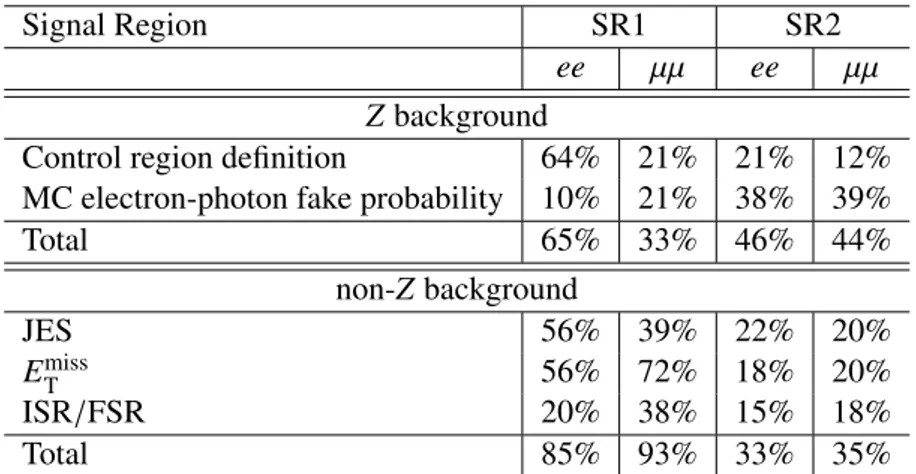
7.Signal Region SR1 SR2 ee µµ ee µµ Z background
Control region definition 64% 21% 21% 12%
MC electron-photon fake probability 10% 21% 38% 39%
Total 65% 33% 46% 44%
non-Z background
JES 56% 39% 22% 20%
E
missT56% 72% 18% 20%
ISR/FSR 20% 38% 15% 18%
Total 85% 93% 33% 35%
Table 2: Fractional values of the dominant and total systematic uncertainties on SM Z and non-Z events for the electron and muon channels in the two SRs.
6 Systematic Uncertainties
Systematic uncertainties a
ffecting the background rate and SUSY signal yields in the signal regions have been evaluated. Table
2summarizes the dominant and total systematic uncertainties on the SM Z and non-Z backgrounds.
The systematic uncertainties on the data-driven estimates of the Z/γ
∗+jets background are found to be 65% (33%) for SR1 and 46% (44%) for SR2 for the electron (muon) channel. The primary sources of this systematic uncertainty are the choice of control region used to derive the H
Treweighting and the use of di
fferent subtraction methods to correct the selected γ
+jets control sample. The large di
fference between the systematic uncertainties in electron and muon channels in SR1 is due to the stringent SR1 requirements, which lead to statistical fluctuations.
The background from t¯ t, single-top and dibosons is obtained using MC. The total uncertainty on these predictions is estimated to be 85% (93%) for SR1 and 33% (35%) for SR2 for the electron (muon) channel. The uncertainties are dominated by the uncertainty on the jet energy scale, uncertainties asso- ciated with ISR and FSR, and the uncertainties in energy scale associated to the calorimeter clusters that are used in the E
Tmisscomputation, but which are not associated to any hard objects in the event.
For the SUSY signal processes, various sources of uncertainties affect the theoretical NLO cross- sections. Variations of the renormalisation and factorisation scales by factors of two in the NLO PROSPINO calculation result in uncertainties up to 20%. The PDF uncertainties on the GGM cross-sections were evaluated by using the CTEQ6.6M [36] PDF error sets in the PROSPINO 2.1 [35] cross-section calcu- lation and range from 12% to 29%, depending on the gluino and higgsino masses. The di
fference in the impact of the PDF and scale uncertainties on the various GGM points is related to the different production mechanisms in the GGM grid considered here. The systematic uncertainties due to experimental sources were also assessed for signal MC and were found to vary from 5–60% for points with large m( ˜ H).
7 Results and Interpretation
Table
3shows the number of expected events in the SRs for each background source together with the observed number of events. In both signal regions, the contribution from QCD and W
+jets are negligible, and the dominant backgounds are Z/γ
∗+jets and t¯ t. Due to the jet requirement in SR1, the diboson contribution is negligible.
In Figures
4and
5the distributions of E
missTfor data and MC events in the ee and µµ channels after
application of the SR1 and SR2 requirements, except for the E
Tmisscut, are shown.
Background source SR1 SR2
ee µµ ee µµ
top 0.2
±0.2 0.2
±0.1 2.2
±1.0 3.0
±1.3
dibosons - 0.0
±0.1 0.8
±0.2 0.9
±0.4
Z/γ
∗+jets 0.3
±0.4 0.3
±0.3 2.1
±1.2 3.2
±1.8 Total SM Background 0.5
±0.4 0.4
±0.3 5.2
±1.7 7.1
±2.3
Observed 2 0 4 7
Table 3: Expected SM background event yields and number of events observed in data for an integrated luminosity of 1.04 fb
−1after the signal region requirements for the electron and muon channels. The uncertainties are a combination of the statistical and systematic uncertainties.
[GeV]
miss
ET
0 50 100 150 200 250 300
Events / 20 GeV
10-1
1 10 102
103
Data 2011 SM Background
*+jets γ Z/
top dibosons
H=120
=300, m~
~g
GGM m
H=290
=300, m~
~g
GGM m
=7 TeV s
-1, L dt ~ 1.04 fb
∫
ee channelATLAS Preliminary
[GeV]
miss
ET
0 50 100 150 200 250 300
Data / SM
0 1 2 3
[GeV]
miss
ET
0 50 100 150 200 250 300
Events / 20 GeV
10-1
1 10 102
103
Data 2011 SM Background
*+jets γ Z/
top dibosons
H=120
=300, m~ g~
GGM m
H=290
=300, m~ g~
GGM m
=7 TeV s
-1, L dt ~ 1.04 fb
∫
µ channel µATLAS Preliminary
[GeV]
miss
ET
0 50 100 150 200 250 300
Data / SM
0 1 2 3
Figure 4: Distributions of E
Tmissfor data and MC events after SR1 selection without the E
missTrequirement for the ee (left) and µµ (right) channels. Two GGM signal points are included. The first point was produced with m( ˜ g)
=300 GeV and m( ˜ H)
=120 GeV, and the second with m( ˜ g)
=300 GeV and m( ˜ H)
=
290 GeV. The hatched grey band represents the total systematic uncertainties on the MC expectations.
The plots include the overflow bin.
[GeV]
miss
ET
0 50 100 150 200 250 300
Events / 20 GeV
10-1
1 10 102
103
104
Data 2011 SM Background
*+jets γ Z/
top dibosons
H=120
=300, m~
~g
GGM m
H=290
=300, m~
~g
GGM m
=7 TeV s
-1, L dt ~ 1.04 fb
∫
ee channelATLAS Preliminary
[GeV]
miss
ET
0 50 100 150 200 250 300
Data / SM
0 1 2 3
[GeV]
miss
ET
0 50 100 150 200 250 300
Events / 20 GeV
10-1
1 10 102
103
104
Data 2011 SM Background
*+jets γ Z/
top dibosons
H=120
=300, m~ g~
GGM m
H=290
=300, m~ g~
GGM m
=7 TeV s
-1, L dt ~ 1.04 fb
∫
µ channel µATLAS Preliminary
[GeV]
miss
ET
0 50 100 150 200 250 300
Data / SM
0 1 2 3
Figure 5: Distributions of E
Tmissfor data and MC events after SR2 selection without the E
missTrequirement for the ee (left) and µµ (right) channels. Two GGM signal points are included. The first point was produced with m( ˜ g)
=300 GeV and m( ˜ H)
=120 GeV, and the second with m( ˜ g)
=300 GeV and m( ˜ H)
=
290 GeV. The hatched grey band represents the total systematic uncertainties on the MC expectations.
The plots include the overflow bin.
In the SRs, the expectation and observation agree within uncertainties. Given a lack of excess in the observed data, the results of the analysis are interpreted as 95% confidence level (CL) exclusion limits on m( ˜ g) and m( ˜ H) in the higgsino-like NLSP scenario defined for the GGM model grid. The expected and observed 95% CL upper limits are computed using the CL
smethod combining the ee and µµ channels.
Systematic uncertainties are treated as nuisance parameters, and their correlations are taken into account.
Limits are computed for each signal region, and the final exclusion uses the values from the signal region corresponding to the strongest expected limit.
Figure
6shows the observed and expected 95% CL limits on m( ˜ g) and m( ˜ H) for the GGM models with higgsino-like NLSP considered. For higgsino masses in the range 200
−640 GeV, gluino masses of 600
−700 GeV are excluded at 95% CL.
8 Conclusions
A search for events with large E
Tmissand a Z boson that decays to a pair of electrons or muons has been performed using 1.04 fb
−1of ATLAS data collected in 2011. With no excess observed in the selected signal regions, limits on m( ˜ g) and m( ˜ H) have been derived in the context of GGM, when the lightest neutralino NLSP is higgsino-like. Assuming tan β
=1.5, M
1 =M
2=1 TeV, and cτ
NLSP< 0.1 mm, we exclude gluino masses up to 600
−700 GeV at 95% CL for higgsino masses in the range 200
−640 GeV.
References
[1] H. Miyazawa, Prog. Theor. Phys.
36 (6)(1966) 1266–1276.
200 300 400 500 600 700 800 900
) [GeV]g~m(
300 400 500 600 700 800 900
H~
< m
g~
m
) = 1.5 TeV q~
= 1 TeV, m(
= M2
= 1.5, M1
β , tan
1
χ∼0
GGM: higgsino-like
Ldt = 1.04 fb-1
∫
s=7 TeV ATLAS Preliminary95% CL Observed CLs
95% CL Expected CLs
σ
±1 95% CL Expected CLs
200 300 400 500 600 700
) [GeV]
H~ m(
) [GeV]
1
χ∼0
m(