ATLAS-CONF-2013-109 21/02/2014
ATLAS NOTE
ATLAS-CONF-2013-109
December 26, 2013 Minor revision: February 7, 2014
Calibration of the b-tagging e ffi ciency for c jets with the ATLAS detector using events with a W boson produced in association with a single c quark
The ATLAS Collaboration
Abstract
A novel method is used to measure the
b-jet tagging efficiency ofcjets of the standard MV1 tagging algorithm in proton-proton collisions at
√s =
7 TeV using data collected by the ATLAS experiment at the LHC in the year 2011, corresponding to an integrated lu- minosity of about 4.6 fb
−1. The measurement is based on a sample of
cjets produced in association with a
Wboson. The
Wboson is reconstructed via its decay into an electron and a neutrino, and the
cjet is identified via a soft muon stemming from a semileptonic
c-hadrondecay. The charge correlation of the two leptons is exploited to extract a
c-jet sample withhigh purity. The results are presented in the form of data-to-simulation efficiency scale fac- tors. The total uncertainties range from 5% to 13%, increasing as the background rejection of the
b-tagging algorithm increases.Graphical correction of the error bars in Fig. 7(a) and typographical correction of the Evt- Gen 1-prong fraction (p. 13) with respect to the version of December 26, 2013.
c
Copyright 2014 CERN for the benefit of the ATLAS Collaboration.
Reproduction of this article or parts of it is allowed as specified in the CC-BY-3.0 license.
1 Introduction
The identification of jets originating from the fragmentation of b quarks, b-tagging, constitutes an im- portant instrument for the physics programme at the LHC. The background suppression by means of b-tagging is essential in precision measurements regarding top physics, in Higgs boson searches and measurements as well as in the search for new phenomena. In order to identify b jets and separate them from jets stemming from c quarks, light quarks or gluons, b-tagging algorithms exploit several distinct properties of the production and the decay of b hadrons e.g. their mass of about 5 GeV and their lifetime of about 1.5 ps. Their separation from c jets is particularly di
fficult since c hadrons have similar prop- erties, such as the mass and lifetime, as b hadrons. Since simulations are not expected to describe all effects that impact the performance of b-tagging algorithms accurately, the efficiency with which a jet originating from the fragmentation of a b quark is identified as a b jet needs to be evaluated on data. It is equally important to determine the probability of mistakenly tagging a jet as a b jet that originates from a c quark, the c-jet tagging efficiency, or from a light quark or gluon, the mistag rate.
This note presents a novel method to determine the c-jet tagging e
fficiency, based on data collected by the ATLAS detector during the year 2011 at
√s
=7 TeV. The measurement of the c-jet tagging efficiency and its calibration by means of data-to-simulation scale factors are presented for the MV1 b- tagging algorithm. The most commonly used tagging algorithm in ATLAS analyses is based on a neural network using the output information from the IP3D, SV1 and JetFitterCombNN b-tagging algorithms, described in Ref. [1]. Certain cuts on the output weights of the b-tagging algorithms define operating points that correspond to certain b-tagging e
fficiencies determined on a sample of simulated t¯ t events.
The operating points of the MV1 algorithm calibrated in this note correspond to b-tagging e
fficiencies of 85%, 75%, 70% and 60%.
Precisely measuring the tagging e
fficiency of a b-tagging algorithm for a certain jet flavour requires a sample of jets extracted from data that is dominated by that jet flavour. The first measurement of the c-jet tagging efficiency by the ATLAS collaboration [2] is based on a sample of D
∗+mesons reconstructed in the exclusive decay D
∗+ →D
0(→ K
−π+)π
+. In the present analysis an alternative approach to select a sample of c jets is chosen. A single c jet produced in association with a W boson is identified by a soft muon stemming from the semileptonic decay of a c hadron. The W boson is reconstructed via its decay into an electron and a neutrino. In proton-proton collisions at a centre-of-mass energy of
√s
=7 TeV, the dominant production mechanism is
gs →W
−c and
gs ¯
→W
+c, where the ¯ W boson is always accompanied by a c quark with an oppositely signed charge. Given that the soft muon carries a charge with the same sign as the c quark, requiring that the charge of the soft muon and the charge of the W boson (or its decay electron) to be of opposite sign selects W
+c events with very high e
fficiency. Most of the background processes are evenly populated with events where the charges of the decay leptons are of opposite sign (OS) or of same sign (SS). Therefore, a very pure sample of c jets is obtained by extracting the number of W
+c signal events as the di
fference between the number of events with opposite and with same charge (OS-SS). This fundamental strategy was already exploited in several W
+c production cross section measurements [3–7]. In the remainder of this note jets that are soft-muon tagged (SMT) are referred to as SMT jets and a sample composed of such jets extracted as the number of OS-SS events is referred to as the SMT jet sample.
As a first step the c-jet tagging efficiency is measured using the SMT c-jet sample in data and sim- ulation. The results are presented as data-to-simulation scale factors. Following that, an extrapolation procedure is performed to derive data-to-simulation scale factors that are applicable to an unbiased sam- ple of inclusive c jets.
The present note is organized as follows. Section 2 summarizes the data and Monte Carlo (MC)
samples used in the analysis. In Sec. 3 the object and event selection is detailed. The extraction of the
W
+c yield is discussed in Sec. 4. In Sec. 5 the measurement of the c-jet tagging efficiencies and data-
to-simulation scale factors for SMT c jets are presented. Section 6 describes the extrapolation procedure used to derive c-jet tagging e
fficiency scale factors for inclusive c jets. The systematic uncertainties are discussed in Sec. 7, while the final results are presented in Sec. 8. Conclusions are drawn in Sec. 9.
2 Data and simulated samples
This analysis is based on data collected with the ATLAS detector in the year 2011 during periods with stable pp collisions at
√s
=7 TeV and all relevant detector components operational. The resulting data sample corresponds to an integrated luminosity of 4.6 fb
−1with an uncertainty of 1.8% [8].
Simulated samples are used to compute e
fficiencies and model kinematic distributions of signal and background processes. The signal is defined to be the production of a W boson in association with a single charm quark. Background processes include the production of W
+jets containing charm or bottom quark pairs or no heavy flavour quarks, as well as the production of Z
+jets, top-quark pairs, single-top quarks, dibosons (WW , WZ and ZZ) and multijet events. The contribution from the production of a W boson in association with a single bottom quark is negligible.
W bosons produced in association with c jets, b jets and light jets are generated separately using A
lp-
gen2.13 [9]. The showering of the W
+c signal process is done with Pythia 6.423 [10], while for all other W
+jets processes H
erwig6.520 [11] is used for the parton shower and J
immy4.31 [12] for the underlying event. An additional signal sample produced with A
lpgenand H
erwig+Jimmy is used to study system- atic uncertainties. Exclusive samples with zero to four additional partons and an inclusive sample with five or more additional partons are used. Overlaps between di
fferent A
lpgensamples with heavy-flavour quarks originating from the matrix element and from the parton shower are removed. In addition, the MLM [13] matching scheme is applied to remove overlaps between events with a given parton multiplic- ity generated by the matrix element and the parton shower. The CTEQ6L1 parton distribution function (PDF) [14] is used for all leading order (LO) MC generators.
To improve on known shortcomings in the Alpgen+Pythia signal sample and to minimize systematic uncertainties, several c-quark fragmentation and c-hadron decay properties are corrected as explained in Sec. 6. While in the following this corrected sample is referred to as the P
ythia-corrected sample, the sample without any of the fragmentation and decay corrections applied is called the Pythia-default sam- ple. Additionally, signal samples generated with A
lpgenand P
ythia, where the E
vtG
en[15] program is used to model hadron decays, are produced to study the c-hadron decay properties.
Background from Z
+jets events is generated with Alpgeninterfaced to Herwig and Jimmy using the same configuration as for W
+jets events. For the diboson backgrounds, MC samples generatedwith H
erwigare used. The t¯ t background is obtained from MC@NLO 4.01 [16] with H
erwigused for the parton shower. The CT10 [17] PDF is used for the next-to-leading order (NLO) matrix element calculations, while showering is performed with the CTEQ6L1 PDF. Single-top production is based on the A
cerMC 3.7 [18] MC generator (interfaced to P
ythia) in the t-channel, and on the MC@NLO generator in the s-channel and for the associated production with a W boson. Tauola [19] and Photos [20]
are employed to model the decay of
τleptons and the QED radiation of photons, respectively.
The background processes are normalized to NNLO predictions in case of the inclusive W, Z and t¯ t productions [21, 22] and to NLO predictions for the other processes [23, 24]. The properties of the multijet background events are determined using data-driven techniques.
Multiple pp collisions per bunch crossing (pileup) are modelled by overlaying minimum-bias events generated using Pythia with the hard process.
The simulated events are passed through a detailed simulation of the ATLAS detector response [25]
based on GEANT4 [26].
3 Event selection
The data sample used for this analysis is triggered by a single-electron trigger with pseudorapidity cov- erage of
|ηe| <2.47 and a minimum threshold on the transverse momentum p
eTof 20 GeV to 22 GeV, depending on the data-taking period.
Events are required to have at least one primary-vertex candidate. The vertex with the highest sum of the squared transverse momenta of associated tracks is selected as the primary vertex.
W bosons are reconstructed in their leptonic decay channel to an electron and a neutrino. Electrons with p
eT >25 GeV and
|ηe| <2.47, excluding the calorimeter transition region 1.37
< |η| <1.52, are selected. Electrons are required to pass the “tight” identification criteria described in Ref. [27] and re-optimized for the 2011 data-taking conditions. Calorimeter-based isolation requirements are applied to electrons: the sum of transverse energies in the calorimeter cells within a cone of radius
∆R
<0.3 around the electron direction,
P∆R<0.3
E
cellsT, is required to be less than 3 GeV. Exactly one lepton fulfill- ing isolation requirements is allowed in each event. Events with additional electrons or isolated muons are rejected to suppress background from Z and t¯ t events. The selection applied to veto leptons is looser than that used for signal leptons to ensure higher background rejection. Scale factors are applied to the MC simulation to bring the trigger and reconstruction efficiencies in accordance with the performance measured in data. The presence of a neutrino is inferred from the presence of missing transverse momen- tum (E
missT). The magnitude and azimuthal direction of E
missTare measured from the vector sum of the transverse momenta of calibrated physics objects [28]. Low-p
Ttracks are used to recover soft particles which are missed in the calorimeters. A minimum E
missTof 25 GeV is required. In addition the W-boson transverse mass
1, m
WT, is required to be larger than 40 GeV.
Jets are reconstructed with the FastJet package [29] which uses the infrared- and collinear-safe anti- k
talgorithm [30] with radius parameter R
=0.4. The detector input is based on topological clusters of calorimeter cells [31]. The jet energy is calibrated to account for the di
fferent response of the calorime- ters to electrons and hadrons, for energy losses in un-instrumented regions, and for the energy offset introduced by pileup, by applying jet calibration factors dependent on p
T,
ηand pileup conditions [32].
Jets with p
T>25 GeV and
|η|<2.5 are selected. Furthermore, it is required that the ratio of the p
Tsum of tracks inside the jet associated with the primary vertex divided by the p
Tsum of all tracks inside the jet is larger than 0.75, in order to remove jets reconstructed from energy deposits stemming from particles produced in pileup interactions. Events are required to have exactly one jet fulfilling these requirements.
The selected jet is moreover required to contain a muon with p
T >4 GeV and
|η| <2.5. Muon can- didates are formed from pairs of standalone tracks in the inner detector (ID) and the muon spectrometer that are combined using a
χ2-matching procedure [33,34]. The reduced
χ2value is required to be smaller than 3.2. In addition, two impact parameter requirements need to be fulfilled: a transverse impact pa- rameter requirement,
|d0|<3 mm, and a longitudinal impact parameter requirement,
|z0·sin
θ|<3 mm.
The impact parameters d
0and z
0are defined at the point of closest approach to the primary vertex in the transverse plane and
θis the polar angle of the muon with respect to the beam axis. A set of ID hit requirements [35] is applied to select high quality tracks also demanding at least one hit in the first pixel layer. Exactly one muon is required to be associated with the jet; the small fraction of events with jets containing more than one muon is discarded. The soft-muon tagging efficiency and mistag rate are measured in data [36]. The overall soft-muon c-jet tagging efficiency is about 4 %, mainly due to the low semimuonic branching ratio of c hadrons (approximately 10 %). The light-jet mistag rate is around 0.2 % depending on the jet kinematics. Scale factors are applied to correct the e
fficiencies in MC simulation to those measured in data.
1mWT is defined asmWT = q
2plTEmissT (1−cos∆φ) where∆φis the azimuthal separation between the directions of the lepton and the missing momentum in the transverse plane.
4 Determination of the W + c yield
In order to enhance the signal contribution the charge correlation of the W
+c signal process is exploited by measuring the number of OS-SS events, N
OS−SS =N
OS−N
SS. The remaining background after the OS-SS subtraction consists predominantly of W
+light events in which the OS/SS asymmetry is due tothe correlation of the charge of the W boson and the fragmentation products of the associated light quark.
Multijet production is also an important background afflicted with large cross section uncertainties. The background from W
+light and multijet events is estimated using data-driven methods. Smaller back-grounds from Z/γ
∗+jets, top and diboson production are estimated from MC simulations. Backgrounds from W
+b b ¯ and W
+c¯ c events are negligible since they are symmetric regarding the number of OS and SS events.
Since the SS sample is mainly composed of W
+light and multijet events, their sum is constrained by the number of data events in the SS sample. The number of OS-SS events of the W
+light and multijet backgrounds are therefore obtained from a constrained
χ2fit to the number of data events in the SS sample and a subsequent propagation using the following equation
N
OS−SSbkg =A
bkg·N
bkgOS+SS=2
·A
bkg1
−A
bkgN
bkgSS.(1)
Here N
bkgOS+SSis the sum of the number of background events in the OS (N
OSbkg) and SS (N
bkgSS) samples and A
bkgthe OS/SS asymmetry defined as
A
bkg=N
bkgOS−SSN
bkgOS+SS.(2)
In the fit, the sum of the W
+light and multijet backgrounds plus the remaining backgrounds and a small W
+c signal contribution is required to be equal to the total data count in the SS sample. The relative contributions of W
+light and multijet events are allowed to vary in the fit, while all other backgroundsand the signal contribution are fixed to their values expected from simulations.
The OS/SS asymmetry of the multijet background, A
multijet, is determined by performing a binned maximum likelihood fit of templates to the E
missTdistribution in data separately for the OS and SS sam- ples. The fit is carried out in a control sample where the E
missTselection requirement is released. Two templates are used: one representing the multijet background and the other representing the contributions from all other sources. The multijet template is extracted from a data control region selected by inverting the electron isolation and some of the electron identification requirements. A residual contamination from W/Z and top quark events is estimated from simulations and subtracted. The non-multijet template representing all other processes, including the W
+c signal, W/Z, diboson and top quark production, is obtained from simulations where the relative contributions of the individual processes are fixed accord- ing to their cross sections predictions. A
multijetderived according to Eq. 2 using the fit results in the signal region (E
missT >25 GeV) is consistent with zero within the assigned total uncertainties. The uncertainties are dominated by the statistical component. The systematic uncertainties estimated by varying the fit range and using alternative multijet and non-multijet templates are found to be small.
The OS/SS asymmetry of the W
+light background,A
W+light, is obtained from MC simulation and corrected by the asymmetry measured in a data control region using the relation:
A
W+light=A
MCW+lightA
data,tracks W+lightA
MC,tracksW+light .(3)
A
MCW+lightis the OS/SS asymmetry in the MC simulation for the signal region and A
MC,tracksW+light(A
data,tracks W+light)
is the OS/SS asymmetry in MC (data) estimated using the charges of the W boson and generic tracks
[GeV]
jet
pT
30 40 50 60 70 80 90 100
OS-SS Events / 5 GeV
0 200 400 600 800 1000 1200 1400 1600
Data W+c W+light Multijet Others
ATLAS Preliminary
= 7 TeV s Data 2011,
L dt = 4.6 fb-1
∫
[GeV]
µ
pT
5 10 15 20 25 30
OS-SS Events / 2 GeV
0 200 400 600 800 1000 1200 1400 1600 1800 2000
Data W+c W+light Multijet Others
ATLAS Preliminary
= 7 TeV s Data 2011,
L dt = 4.6 fb-1
∫
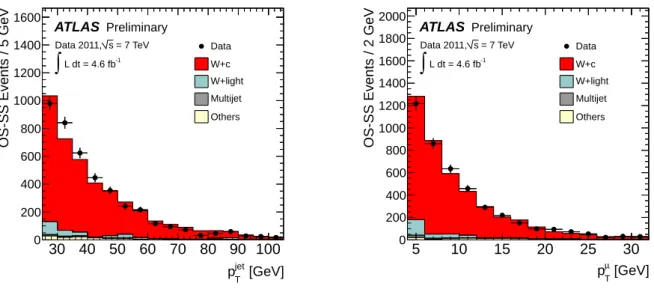
Figure 1: The p
Tdistributions of the SMT jet (left) and the soft muon (right) in OS-SS candidate events.
The normalization of the W
+light background and the shape and normalization of the multijet back-ground are obtained using data-driven methods. All other backgrounds are estimated with MC simula- tions and normalized to their theoretical cross sections. The W
+c signal contributions are normalized to the measured yield and the shapes are extracted from the Alpgen+Pythia-corrected sample.
that are associated with the selected jet and pass the soft muon kinematic requirements. A
MC,tracksW+lightand A
data,tracksW+light
are derived from a control sample that is selected by relaxing the soft muon requirements.
A
W+lightis found to be approximately 10%. The uncertainty on A
W+lightis dominated by the statistical uncertainty on A
MCW+light. The sub-leading systematic uncertainty contains contributions from uncertainties on the background contamination in the control sample and the modelling of track properties.
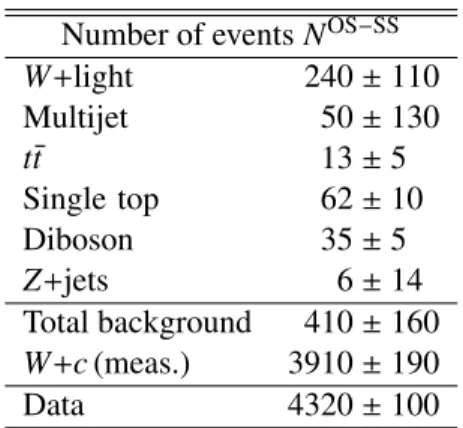
The selected numbers of OS and SS events in the data SMT jet sample are 7445 and 3125. This results in a number of OS-SS data events of 4320
±100 and an extracted number of SMT W
+c events of 3910
±100 (stat.)
±160 (syst.). The estimated number of background events, the number of data events and the measured W
+c yield are summarized in Table 1.
Figure 1 shows the p
Tdistributions of the selected SMT jet (left) and the associated soft muon (right) in OS-SS events. The signal contribution is normalized to the measured yield, the background contributions to the values listed in Table 1. The W
+c signal shapes are derived from the Alpgen+Pythia- corrected simulated signal sample. The multijet shapes are extracted from the data control region used to determine A
multijet. The predictions are in reasonable agreement with data.
5 Measurement of the c-jet tagging e ffi ciency of SMT c jets
The selected OS-SS events have a high c-jet purity (approximately 90 %) and are therefore well suited to
perform a measurement of the c-jet tagging efficiency of SMT c jets. The output weight of the MV1 tag-
ging algorithm for which the c-jet tagging efficiency is measured is shown in Fig. 2. The W
+c signal
contribution is normalized to the measured yield while its shape is extracted from the A
lpgen+P
ythia-
corrected sample. The MV1 output weight is designed as such that real b jets tend to have high values
close to one and light jets low values close to zero. The operating points calibrated in this note are de-
fined by cuts on the MV1 output weight, namely 0.07, 0.40, 0.60 and 0.91, corresponding to b-tagging
efficiencies of 85 %, 75 %, 70 % and 60 %, respectively, in simulated t¯ t events. The distribution of the
Number of events N
OS−SSW
+light 240
±110
Multijet 50
±130
t¯ t 13
±5
Single top 62
±10
Diboson 35
±5
Z
+jets6
±14
Total background 410
±160 W
+c (meas.) 3910
±190
Data 4320
±100
Table 1: Number of OS-SS events for different backgrounds and for the selected data sample. The measured W
+c yields are also shown. The uncertainties on the yields include statistical and systematic uncertainties. Correlations between the uncertainties due to the constraint in the SS sample are taken into account when computing the total background uncertainties.
MV1 weight 0 0.1 0.2 0.3 0.4 0.5 0.6 0.7 0.8 0.9 1
OS-SS Events / 0.1
0 500 1000 1500 2000 2500 3000 3500
Data W+c W+light Multijet Others
ATLAS Preliminary
= 7 TeV s Data 2011,
L dt = 4.6 fb-1
∫
Figure 2: Output weight of the MV1 tagging algorithm for the SMT c-jet sample selected in data and
simulation. The W
+c signal contribution is normalized to the measured yield and the shape is extracted
from the Alpgen+Pythia-corrected sample.
jet
Ntrk
1 2 3 4 5 6 7 8 9 10
OS-SS Events
0 200 400 600 800 1000 1200 1400
Data W+c W+light Multijet Others
ATLAS Preliminary
= 7 TeV s Data 2011,
L dt = 4.6 fb-1
∫
SV
Ntrk
0 2 4 6 8 10
OS-SS Events
0 1000 2000 3000 4000 5000
Data W+c W+light Multijet Others
ATLAS Preliminary
= 7 TeV s Data 2011,
L dt = 4.6 fb-1
∫
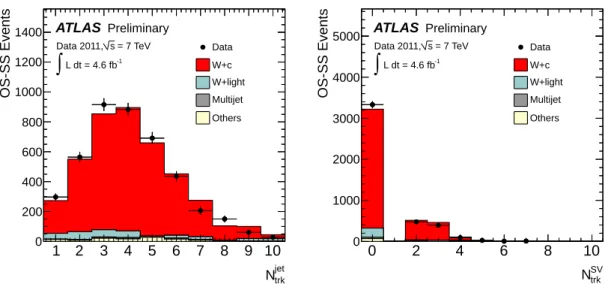
Figure 3: Track and secondary vertex (SV) properties of the selected SMT c jets: the number of tracks associated with the selected jet, N
trkjet, used by the impact parameter (IP) based tagging algorithms (left);
the number of tracks associated with a reconstructed SV, N
trkSV, exploited by the SV1 tagging algorithm (right). The events with zero tracks correspond to the case of no SV being reconstructed.The W
+c signal contributions are normalized to the measured yield and the shapes are extracted from the Alpgen+Pythia- corrected sample.
number of tracks inside the selected SMT jets as well as of the number of tracks that are furthermore associated with a secondary decay vertex (SV) that serve as important discriminants when identifying b jets are shown in Fig. 3. It should be noted that in what follows the number of events refers to the number of OS-SS subtracted events unless indicated otherwise.
The c-jet tagging e
fficiency of SMT c jets ,
εdatac(µ), is derived as the fraction of W
+c events selected in data that pass a certain b-tagging requirement
εdatac(µ) =
N
Wcb-tagN
Wc,
(4)
where N
Wcis the number of W
+c events before applying the b-tagging requirement (hereinafter referred to as pretag level or sample) and N
Wcb-tagis the number of W
+c events passing the b-tagging requirement.
2N
Wcis derived as described in Sec. 4. The number of b-tagged signal events N
Wcb-tagis determined from
N
Wcb-tag=N
datab−tag−Xbkg
N
bkgb−tag,(5)
where the number of events in data that pass the b-tagging requirement is denoted N
datab−tagand the sum runs over all considered backgrounds. The number of b-tagged events of a given background, N
bkgb−tag, is computed using the following expression
N
bkgb−tag=εbkg·N
bkg,(6)
2The selectedW+csample has a small contamination of about 1 % of non-cjets at pretag level and less than 0.2 % after applyingb-tagging requirements, which is estimated using MC simulation and subtracted.
[GeV]
miss
ET
0 20 40 60 80 100 120
Events / 5 GeV
0 500 1000 1500 2000 2500 3000 3500
Data EWK+top Multijet
ATLAS Preliminary
= 7 TeV s Data 2011,
L dt = 4.6 fb-1
∫
(a)
[GeV]
miss
ET
0 20 40 60 80 100 120
Events / 5 GeV
0 200 400 600 800
1000 Data
EWK+top Multijet
ATLAS Preliminary
= 7 TeV s Data 2011,
L dt = 4.6 fb-1
∫
(b)
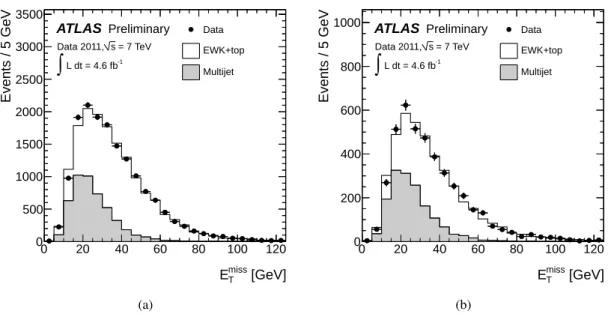
Figure 4: Fits to the E
missTdistribution in the sum of the OS and SS samples used to determine the number of multijet events (a) before and (b) after applying a cut on the MV1 weight corresponding to the
εb =70 % operating point. “EWK+top” corresponds to the production of W and Z bosons, the production of single top and top quark pairs and the productions of dibosons.
where N
bkgis the number of background events in the pretag sample listed in Table 1 and
εbkgdenotes the tagging rate of the considered background sample. The tagging rate, i.e. the fraction of events that pass the applied b-tagging requirement, depends both on the individual jet flavour composition of the considered background and on the tagging e
fficiencies or mistag rates of the di
fferent jet flavours.
The tagging rates of the W
+light,t¯ t, single top, diboson and Z
+jets backgrounds are extracted usingMC simulation. The tagging e
fficiencies of the di
fferently flavoured jets are corrected to match those in data by applying b-tagging scale factors [1, 37]. The corresponding systematic uncertainties are taken into account. The total uncertainties on the tagging rates are dominated by the statistical uncertainties due to the limited size of the simulated samples.
The tagging rate of the multijet background is estimated using a data-driven method. A binned maxi-
mum likelihood fit of templates to the E
missTdistribution in data is performed both before and after apply-
ing the b-tagging requirement. The procedure follows closely the extraction of the OS
/SS asymmetry at
pretag level described in Sec. 4. Accordingly, the non-multijet templates are built using MC simulations
and the multijet templates are extracted from a data control sample selected by inverting some of the
electron identification criteria as well as the electron isolation requirement. The templates used to derive
the number of b-tagged multijet events are obtained from control samples that are additionally required
to pass the b-tagging requirement. Since the multijet-template shapes in the OS and SS control samples
are found to be consistent, the multijet templates are derived from the sum of the number of OS and SS
events to reduce the statistical uncertainties. The multijet tagging rates computed using the fit results for
the OS and SS samples lead to compatible results. Therefore, the final multijet tagging rate is obtained
from the fit results derived for the sum of the OS and SS samples. The fit results before and after applying
the MV1 b-tagging requirement corresponding to the
εb=70 % operating point are shown in Fig. 4. The
multijet tagging rates for the different operating points vary between 26 % and 55 % indicating that the
multijet sample has a large heavy flavour component. The assigned total uncertainties range between
15 % and 23 % accounting for the dominating statistical uncertainties of the E
Tmissfits, the choice of the
fit range and the shapes of the multijet and non-multijet templates.
Operating points (ε
b) of the MV1 tagging algorithm
85 % 75 % 70 % 60 %
0.99
±0.03
±0.03 0.96
±0.04
±0.04 0.92
±0.05
±0.05 0.87
±0.07
±0.06
Table 2: Data-to-simulation c-jet tagging e
fficiency scale factors for SMT c jets derived for the MV1 tag- ging algorithm with respect to a W
+c sample simulated with Alpgen+Pythia. The first uncertainty is the statistical uncertainty, the second is the systematic uncertainty due to the background determination, the event reconstruction and the simulated sample size.
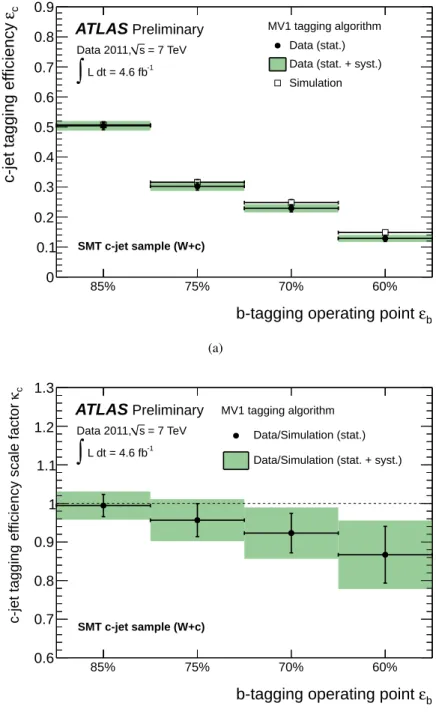
The c-jet tagging e
fficiencies for the MV1 tagging algorithm derived for SMT c jets according to Eq. 4 are shown in Fig. 5(a). They vary between 13 % and 50 % with total uncertainties of 3-10 % that increase with the tightness of the operating point. The systematic uncertainties are dominated by the precision on the W
+light and multijet background yields at pretag level, in particular on the data-drivenOS
/SS asymmetry estimates as discussed in Sec. 4, and on the W
+light tagging rate. The statistical uncertainties are of the same order as the systematic uncertainties.
The expected c-jet tagging efficiency,
εsimc(µ), is defined as the fraction of SMT c jets selected in sim- ulated A
lpgen+Pythia-default W
+c events that pass the b-tagging requirement. In Figure 5(a)
εsimc(µ)is compared to
εdatac(µ)for the different b-tagging operating points.
The data-to-simulation scale factor for SMT c jets
κc(µ) =εdatac(µ)/εsimc(µ)is shown for different operating points in Fig. 5(b) and summarized in Table 2. The quoted systematic uncertainties arise from the pre- viously discussed background determinations as well as from the W boson reconstruction and the SMT c-jets identification-efficiencies. A detailed discussion and a breakdown of the systematic uncertainties can be found in Sec. 7. For looser operating points
κc(µ)is found to be compatible with unity within the total uncertainty, but for tighter operating points
κc(µ)shows a trend towards lower values inconsistent with unity.
6 Calibration of the c-jet tagging e ffi ciency for inclusive c-jet samples
Due to several differences between an inclusive sample of c jets and a sample of SMT c jets the de- rived c-jet tagging efficiency scale factors need to be extrapolated in order to be applicable to samples of inclusive c jets. Selecting a sample of c jets via the semimuonic decays of c hadrons results in a di
ffer- ent composition of c-hadron types with regard to an inclusive sample due to the different semileptonic branching ratios of the c hadrons. Since the c-hadron types differ in several characteristics relevant for the performance of b-tagging algorithms, e.g. the lifetime or the charged decay multiplicity, their tag- ging efficiencies also differ. For the
εb=70 % operating point of the MV1 tagging algorithm the taggingefficiencies of the most prominent weakly decaying c-hadron types are for instance
D
0: 0.157
±0.001, D
+: 0.280
±0.002, D
s: 0.152
±0.003,
Λ+c: 0.041
±0.002
as estimated from the A
lpgen+P
ythia-corrected sample, where the quoted uncertainties are statistical only. Therefore, the overall c-jet tagging e
fficiency of a c-jet sample strongly depends on the sample composition.
The c-jet tagging efficiency of an inclusive sample of c jets,
εc, can be obtained from the c-jet tagging e
fficiency of SMT c jets,
εc(µ), by applying an extrapolation factor
α:εc=α·εc(µ).
(7)
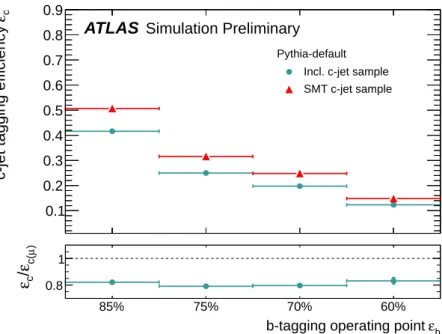
A comparison of the expected
εsimcand
εsimc(µ)for several operating points of the MV1 tagging algorithm
derived using a W
+c sample simulated with A
lpgen+Pythia-default is shown in Fig. 6.
εsimcis sys-
εb
b-tagging operating point
85% 75% 70% 60%
cεc-jet tagging efficiency
0 0.1 0.2 0.3 0.4 0.5 0.6 0.7 0.8 0.9
MV1 tagging algorithm Data (stat.) Data (stat. + syst.) Simulation
ATLASPreliminary
= 7 TeV s Data 2011,
L dt = 4.6 fb-1
∫
SMT c-jet sample (W+c)
(a)
εb
b-tagging operating point
85% 75% 70% 60%
cκc-jet tagging efficiency scale factor
0.6 0.7 0.8 0.9 1 1.1 1.2 1.3
MV1 tagging algorithm Data/Simulation (stat.) Data/Simulation (stat. + syst.)
ATLASPreliminary
= 7 TeV s Data 2011,
L dt = 4.6 fb-1
∫
SMT c-jet sample (W+c)
(b)
Figure 5: (a) Comparison of the c-jet tagging e
fficiencies of SMT c jets in data and the A
lpgen+P
ythia-
default simulation, derived for the MV1 tagging algorithm using W
+c events. (b) Data-to-simulation
c-jet tagging efficiency scale factors for SMT c jets derived for the MV1 tagging algorithm using
W
+c events.
εb
b-tagging operating point
cεc-jet tagging efficiency
0.1 0.2 0.3 0.4 0.5 0.6 0.7 0.8 0.9
Pythia-default Incl. c-jet sample SMT c-jet sample
ATLAS Simulation Preliminary
εb
b-tagging operating point
85% 75% 70% 60%
)µc(ε/cε 0.8
1
Figure 6: Comparison of the c-tagging efficiencies of SMT c jets and inclusive c jets predicted from the A
lpgen+Pythia-default signal sample. The ratio
εsimc /εsimc(µ)corresponds to the efficiency extrapolation factor
αsim.
tematically lower than
εsimc(µ)resulting in a correction factor
αsimof about 0.8 for the different operating points.
Similarly, the c-jet tagging e
fficiency scale factor
κcfor inclusive c jets can be computed from the measured c-jet tagging efficiency scale factor
κc(µ)by applying a correction factor
δκc = εdatac εsimc
Eq.7
= αdata·εdatac(µ)
αsim·εsimc(µ) = αdata
αsim ·κc(µ)=δ·κc(µ),
(8)
where
δis expressed as the ratio of the efficiency extrapolation factors in data,
αdata, and simulation,
αsim. Mismodelling of the di
fferences between SMT c jets and inclusive c-jet samples in MC simulation leads to di
fferent extrapolation factors
αand thus to a ratio
δdeviating from one.
The efficiency extrapolation factor
αdatais estimated using the simulated Alpgen+Pythia-corrected sample that has several corrections applied to minimize c-quark fragmentation and c-hadron decay dif- ferences between data and simulation. The scale factor extrapolation factor
δis thus estimated by
δ≈ αcorrsim
αsim.
(9)
In order to correctly describe the c-hadron composition of the inclusive c-jet sample the fragmentation fractions of the relevant weakly decaying c-hadron types in the Pythia-default sample are re-weighted to those obtained by combining the results of measurements in e
+e
−and e
±p collisions [38]. The frag- mentation fractions implemented in the P
ythia-default simulation are compared to the data results in Fig. 7(a). By correcting the semileptonic branching ratios of c hadrons to match the world average val- ues [39], also the modelling of the c-hadron composition of the simulated SMT c-jet sample is improved.
The c-hadron fractions in the SMT c-jet sample predicted by the P
ythia-default simulation are compared
to those expected by combining the fragmentation fractions determined in e
+e
−and e
±p collisions with
the measured semimuonic branching ratios of c hadrons in Fig. 7(b). While the dominant c-hadron type
c hadron
D+ D0 Ds Λc+
Fragmentation fraction
0 0.1 0.2 0.3 0.4 0.5 0.6 0.7 0.8 0.9 1
p data /e±
e-
e+
Pythia Herwig
ATLASSimulation Preliminary
(a)
c hadron
D+ D0 Ds Λc+
Fraction
0 0.1 0.2 0.3 0.4 0.5 0.6 0.7 0.8 0.9 1
p data + PDG /e±
e-
e+
Pythia Herwig
ATLASSimulation Preliminary
(b)
Figure 7: (a) Fragmentation fractions of the most relevant weakly decaying c hadrons. The fractions in the P
ythia-default and H
erwigsamples are compared to combined results of e
+e
−and e
±p measure- ments [38]. (b) Fractions of the different c-hadron types in a sample of c jets associated with semilep- tonically decaying c hadrons. The fractions in the P
ythia-default and H
erwigsamples are compared to the results expected from independent measurements of the c-hadron fractions [38] combined with the corresponding semimuonic branching ratios [39].
of the inclusive c-jet sample is the D
0meson (∼ 60 %), the D
+-meson fraction is strongly enhanced in the SMT c-jet sample due to the relatively large semileptonic branching ratio of the D
+meson. Therefore, the SMT c-jet sample consists of a similar amount (∼ 43 %) of D
0and D
+mesons.
Given that the main input variables to the b-tagging algorithms exploit track and vertex properties that can specifically be associated with b- and c-hadron decays, it is important that the charged decay multiplicity of c-hadron decays is well modelled by the MC simulation. In order to improve its descrip- tion the relative branching fractions of the dominant semileptonic decay channels of the abundant D
+and D
0mesons are corrected in the simulation to match the world average values [39]. The less frequent de- cay channels, which are known to a lower precision, are adjusted to maintain the overall normalization.
Since both of the dominant semileptonic D
0decays (D
0→K
−µ+νµ, D
0→K ¯
0π−µ+νµ) have two charged
decay products, referred to as 2-prong decays, the impact of the correction on the predicted c-jet tag-
ging efficiency of SMT c jets is small. In case of the D
+meson the most dominant semileptonic decay
(D
+→K ¯
0µ+νµ) is a 1-prong decay, while the second dominant (D
+→K
−π+µ+νµ) and most of the less
frequent decay channels are 3-prong decays. Therefore, a mismodelling of the relative fractions in case
of the D
+meson has a noticeable impact on the c-jet tagging efficiency of SMT c jets. Furthermore,
the hadronic n-prong branching ratios of c hadrons in the P
ythia-default sample are corrected with a
significant impact on the c-jet tagging e
fficiency of samples of inclusive c jets. The corrections in case
of the D
0meson have been inferred from the measured inclusive n-prong branching ratios [39]. The
hadronic n-prong branching ratios of the D
+and D
smesons as well as the
Λ+cbaryon in the P
ythia-
default sample are re-weighted to the predictions of the E
vtG
ensimulation. A comparison between the
Pythia-default and EvtGen predictions, as well as the measured values in case of the D
0meson, reveals
large differences in the hadronic n-prong distributions. Especially, the 2-to-0-prong ratio of the D
0me-
son and the 3-to-1-prong ratio of the D
+meson have a significant impact on the predicted inclusive c-jet
MV1 weight
Fraction of total events / 0.05
0.1 0.2 0.3 0.4 0.5 0.6 0.7
ATLASSimulation Preliminary
Incl. c-jet sample (W+c) Pythia-default Pythia-corrected
MV1 weight 0 0.1 0.2 0.3 0.4 0.5 0.6 0.7 0.8 0.9 1
corr./default
0.8 1 1.2
(a)
MV1 weight
Fraction of total events / 0.05
0.1 0.2 0.3 0.4 0.5 0.6 0.7
ATLASSimulation Preliminary
SMT c-jet sample (W+c) Pythia-default Pythia-corrected
MV1 weight 0 0.1 0.2 0.3 0.4 0.5 0.6 0.7 0.8 0.9 1
corr./default
0.8 1 1.2
(b)
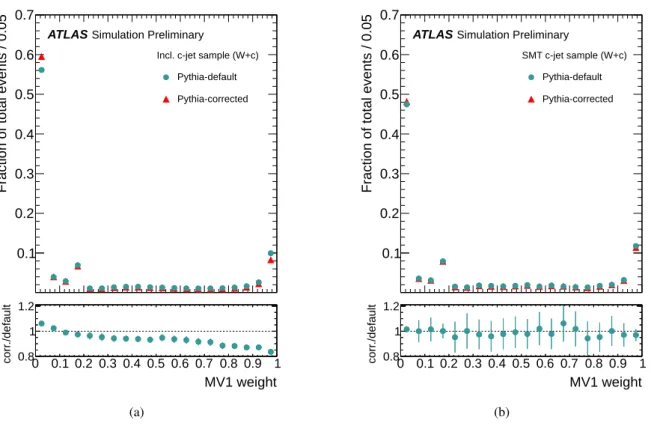
Figure 8: Comparison of the output weight of the MV1 tagging algorithm for (a) inclusive c jets and (b) SMT c jets derived with the A
lpgen+Pythiasignal sample before (P
ythia-default) and after applying all corrections regarding the c-quark fragmentation and c-hadron decay properties (P
ythia-corrected).
tagging efficiency.
3The b-tagging performance is also dependent on the kinematic distributions of the c-hadron decay products: first the e
ffect of any mismodelling of the momentum fraction of the c hadron ( p
cThadron/p
cTjet) - which is sensitive to the c-quark fragmentation function - is evaluated by comparing different simulations;
second the momentum of the decay muon in the rest frame of the c hadron ( p
∗) is re-weighted to agree with the E
vtG
enprediction.
The effect of these corrections on the output weight of the MV1 tagging algorithm for the Alp-
gen+Pythiasignal sample is shown in Fig. 8. The higher values in the tail of the output weight distribu- tion of the inclusive c-jet sample (Fig. 8(a)) indicate that the A
lpgen+P
ythia-default simulation predicts a higher b-tagging efficiency for c jets than the Alpgen+Pythia-corrected simulation. This is largely ex- plained by the significant correction of the hadronic n-prong decay branching ratios in the P
ythia-default sample. The impact of the corrections on the output weight of the SMT c-jet sample (Fig. 8(b)) is less pronounced.
Computing the efficiency correction factor using the A
lpgen+Pythia-corrected sample leads to a re- sults of
αcorrsim(0.69-0.76) that is systematically lower than
αsim(0.79-0.83). Moreover a dependence on the operating point is observed: the values decrease with an increase of the tightness of the operating point.
3For theD0meson, Pythia-default predicts a fraction of hadronic 2-prong decays of (75.72±0.17) % compared to (65±7) % inferred from what is reported by the PDG; the respective 0-prong fractions are (5.03±0.04) % and (17±7) %. Thus the 2-to- 0-prong ratio in Pythia-default is much larger. For theD+meson Pythia-default predicts a fraction of hadronic 3-prong decays of (61.7±0.3) %, while EvtGenpredicts (50.5±0.2) %; the respective 1-prong fractions are (36.1±0.2) % and (47.2±0.2) %.
Hence the 3-to-1-prong ratio predicted by Pythia-default is higher. The uncertainties on the predicted fractions are statistical only.
εb
b-tagging operating point
85% 75% 70% 60%
δScale factor extrapolation factor
0.6 0.7 0.8 0.9 1 1.1 1.2 1.3 1.4
MV1 tagging algorithm
µ)
κc(
c/ κ
(syst.)
µ)
κc(
c/ κ
ATLASPreliminary
= 7 TeV s Data 2011,
L dt = 4.6 fb-1
∫
W+c calibration
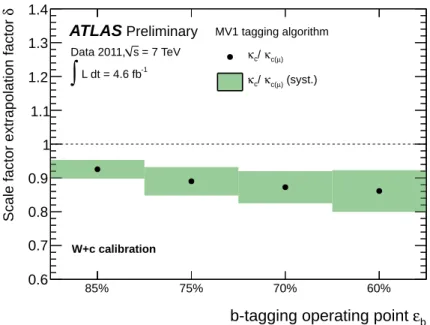
Figure 9: Scale factor extrapolation factor
δbetween the c-jet tagging efficiency scale factors derived for SMT c jets and inclusive c jets for the MV1 tagging algorithm. The systematic uncertainties due to the correction procedure are indicated by the error bands. Statistical uncertainties are omitted since the numerator and the denominator of
δare computed using the same events.
Therefore, the resulting scale factor extrapolation factors
δ, shown in Fig. 9, are systematically lowerthan unity with a decreasing trend towards tighter operating points. The total systematic uncertainties are due to the before-mentioned corrections and are discussed in detail in Sec. 7. Statistical uncertainties can be neglected since the numerator and the denominator of
δare computed using approximately the same simulated events.
7 Systematic uncertainties
Systematic uncertainties on the c-jet tagging e
fficiency scale factors arise from the W boson reconstruc- tion and SMT c jet identification, the pretag yield and tagging rate determination of the backgrounds as well as from the extrapolation procedure to correct the measured c-jet tagging efficiency scale factors for SMT c jets. The di
fferent contributions are summarized in Table 3 and discussed below.
7.1 Event reconstruction
The W boson reconstruction uncertainty arises from the electron trigger and reconstruction e
fficiencies,
the electron energy scale and resolution as well as the E
Tmissreconstruction. There are two main sources
for the uncertainty on the c-jet identification, namely the determination of the jet energy scale (JES) and
resolution (JER) as well as the reconstruction and tagging e
fficiencies and energy resolution of the soft
muon. The electron uncertainties are assessed by varying the electron efficiencies, energy scale and res-
olution in simulation independently within the range of their uncertainties as determined from data and
re-calculating the resulting c-jet tagging e
fficiency. The soft muon uncertainties are determined accord-
ingly: the reconstruction efficiency is varied within its measured precision, as are the soft muon tagging
efficiency and mistag rate. The effect of the JES and JER uncertainties [40] is estimated by varying the
jet four-momentum in the simulation and re-computing the c-jet tagging e
fficiency. The uncertainties
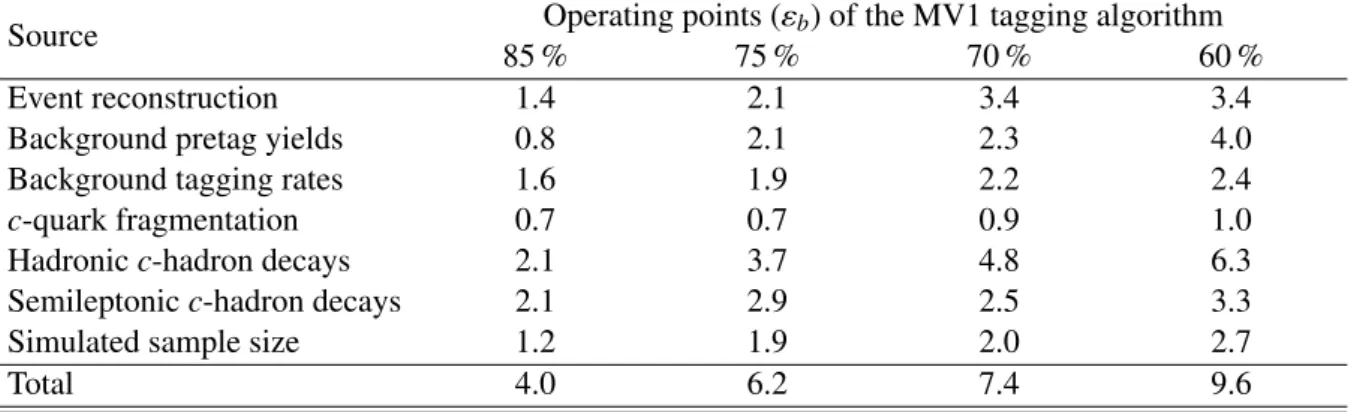
Source
Source Operating points (ε
b) of the MV1 tagging algorithm
85 % 75 % 70 % 60 %
Event reconstruction 1.4 2.1 3.4 3.4
Background pretag yields 0.8 2.1 2.3 4.0
Background tagging rates 1.6 1.9 2.2 2.4
c-quark fragmentation 0.7 0.7 0.9 1.0
Hadronic c-hadron decays 2.1 3.7 4.8 6.3
Semileptonic c-hadron decays 2.1 2.9 2.5 3.3
Simulated sample size 1.2 1.9 2.0 2.7
Total 4.0 6.2 7.4 9.6
Table 3: Summary of the systematic uncertainties on the c-jet tagging e
fficiency scale factor for inclusive c jets
κc. The values are listed in percent.
on the lepton and jet energy scale and resolution are additionally propagated to the reconstruction of the missing transverse energy. Further systematic uncertainties due to the calibration of the soft jet energy scale (7 GeV
<p
jetT <20 GeV) and the calorimeter cells not associated with reconstructed objects that also affect the E
missTreconstruction are accounted for.
The systematic uncertainties due to the JES and JER calibrations are dominating the event reconstruction uncertainties, but are of the same order as the uncertainty due to the limited size of the simulated signal sample on which they are assessed.
7.2 Pretag yields and background tagging rates
The determination of the OS-SS background yields at pretag level and the assessment of the correspond- ing uncertainties is discussed in detail in Sec. 4. The main source of systematic uncertainties is the data-driven estimation of the OS/SS asymmetries of the W
+light and multijet backgrounds. The un-certainty due to the background tagging rates is dominated by the uncertainty on the W
+light taggingrate mainly because of the limited size of the simulated sample used to derive it, as discussed in Sec. 5.
The systematic uncertainty due to the small contamination of non-c-jets in the W
+c sample is marginal.
7.3 Fragmentation and decay modelling
The c-quark fragmentation and c-hadron decay properties are corrected to improve the modelling of
the A
lpgen+P
ythiasignal sample as described in Sec. 6. Whenever results from independent measure-
ments are used to correct the MC description, the uncertainties assigned to those results are propagated
to the extrapolated scale factors. This is done for the fragmentation fractions and the semileptonic de-
cay branching ratios of the prominent weakly decaying c-hadrons as well as for the hadronic n-prong
decay branching ratios of the D
0meson. Where corrections are derived from MC simulations because
no measurements are available, the corresponding systematic uncertainties are assessed by comparing
predictions from di
fferent MC generators. Therefore, the di
fference between the P
ythiaand H
erwigsim-
ulations is used to estimate the uncertainty due to the fragmentation function of c quarks. The systematic
uncertainty due to a possible mismodelling of the p
∗distribution is evaluated from the difference be-
tween the E
vtG
enand P
ythiasimulations. The largest di
fference between the E
vtG
enand either the
P
ythiaor H
erwigsimulations is used to estimate the uncertainties due to the hadronic n-prong decay
branching ratios of the D
+and D
smesons as well as the
Λ+cbaryon. The largest effect on the final scale
factors computed for inclusive c jets arises from the correction of the n-prong decay branching ratios of
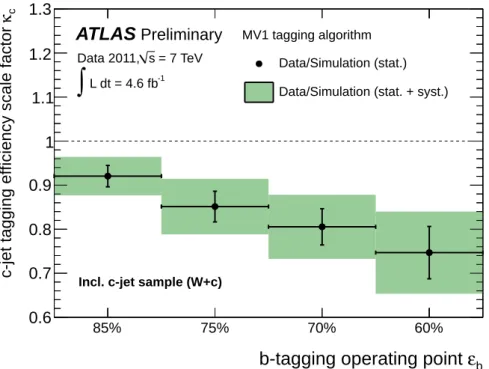
ε
bb-tagging operating point
85% 75% 70% 60%
cκc-jet tagging efficiency scale factor
0.6 0.7 0.8 0.9 1 1.1 1.2 1.3
MV1 tagging algorithm Data/Simulation (stat.) Data/Simulation (stat. + syst.)
ATLAS
Preliminary= 7 TeV s Data 2011,
L dt = 4.6 fb-1
∫
Incl. c-jet sample (W+c)
Figure 10: Data-to-simulation c-jet tagging e
fficiency scale factors for inclusive c jets derived for the MV1 tagging algorithm with respect to an Alpgen+Pythia sample.
Operating points (εb) of the MV1 tagging algorithm
85 % 75 % 70 % 60 %
0.92±0.02±0.02±0.03 0.85±0.03±0.03±0.04 0.81±0.04±0.04±0.04 0.75±0.06±0.05±0.05
Table 4: Data-to-simulation c-jet tagging efficiency scale factors for inclusive c jets,
κc, derived for the MV1 tagging algorithm with respect to an A
lpgen+Pythiasample. The given uncertainties are in order of appearance: statistical uncertainty due to the number of events in the data sample, the systematic uncertainty on the measured scale factors for the SMT c-jet sample and finally the systematic uncertainty due to the extrapolation procedure.
hadronically decaying c hadrons. Since only semileptonically decaying c hadrons to muons are used in the data measurement, a mismodelling of the properties of hadronically decaying c hadrons propagates fully to the scale factors for inclusive c jets.
8 Results
The data-to-simulation c-jet tagging efficiency scale factors for the MV1 tagging algorithm with respect
to a W
+c sample simulated with A
lpgen+P
ythia-default are shown in Fig. 10 and listed in Table 4. Being
applicable to inclusive samples of c jets, they are derived from the measured c-jet tagging efficiency scale
factors for SMT c jets (see Sec. 5) by a simulation-based extrapolation procedure. Their values range
between 0.75 and 0.92 with total relative uncertainties of 13 % to 5 %. Three sources of uncertainties
are distinguished that are of the same order: the statistical uncertainty, the systematic uncertainty on the
measured scale factors for the SMT c-jet sample and the systematic uncertainty due to the extrapola-
tion procedure. The scale factors decrease and the corresponding uncertainties increase with increasing
tightness of the operating point. The modelling of the charged particle multiplicity in c-hadron decays
is found to have a significant impact on the c-jet tagging efficiency. In particular the large differences observed between the reference A
lpgen+P
ythiasample and the best knowledge from independent mea- surements [39] or an alternative signal sample simulated with the EvtGen program lead to the low values of the scale factors for inclusive c-jet samples.
9 Conclusion
The b-tagging efficiency for c jets is measured with the ATLAS detector using data collected in proton- proton collisions at
√s
=7 TeV at the LHC, corresponding to an integrated luminosity of about 4.6 fb
−1. The c-jet tagging e
fficiency calibration is performed on a sample where a single c jet is produced in association with a W boson. The W boson is reconstructed via its decay into an electron and a neutrino and the c jet is identified via a soft muon stemming from the semileptonic decay of the c hadron. Ex- ploiting the charge correlation of the two decay leptons allows to extract a c-jet sample with very high purity of about 90 %.
The tagging e
fficiencies for c jets containing a muon are measured for several operating points of the MV1 tagging algorithm and are compared to predictions from A
lpgen+P
ythia. The corresponding data-to-simulation c-jet tagging efficiency scale factors vary between 0.87 and 0.99 with total relative uncertainties of 10 % to 4 % depending on the operating point. The statistical uncertainty is either of the same order as or larger than the systematic uncertainty.
A second set of data-to-simulation c-jet tagging efficiency scale factors that is applicable to an in-
clusive sample of c jets is presented. This second set is derived from the scale factors measured for c
jets containing a muon by a simulation-based extrapolation procedure. The relative systematic uncer-
tainties due to this extrapolation amount to 4-10 % depending on the considered operating point. The
resulting inclusive c-jet tagging e
fficiency scale factors range between 0.75 and 0.92 with total uncer-
tainties of 13 % to 5 %, where the scale factors decrease and the uncertainties increase with the tightness
of the operating point. The three main contributions to the total uncertainties, the statistical uncertainties,
the systematic uncertainties on the measured scale factors for the SMT c-jet sample and the systematic
uncertainties due to the extrapolation procedure, are of the same order. The main source for the sys-
tematic uncertainties due to the performed extrapolation is the limited knowledge of the charged particle
multiplicity of c-hadron decays which has a significant impact on the c-jet tagging efficiency.
References
[1] ATLAS Collaboration, Commissioning of the ATLAS high-performance b-tagging algorithms in the 7 TeV collision data, ATLAS-CONF-2011-102 (2011).
https://cds.cern.ch/record/1369219.
[2] ATLAS Collaboration, b-jet tagging calibration on c-jets containing D
∗+mesons, ATLAS-CONF-2012-039 (2012). http://cdsweb.cern.ch/record/1435193.
[3] CDF Collaboration, T. Aaltonen et al., First Measurement of the Production of a W Boson in Association with a Single Charm Quark in p p Collisions at ¯
√s
=1.96 TeV, Phys. Rev. Lett.
100(2008) 091803, arXiv:0711.2901 [hep-ex].
[4] CDF Collaboration, T. Aaltonen et al., Observation of the Production of a W Boson in Association with a Single Charm Quark, Phys. Rev. Lett.
110(2013) 071801, arXiv:1209.1921 [hep-ex].
[5] D0 Collaboration, V. Abazov et al., Measurement of the ratio of the p p ¯
→W
+c-jet cross section to the inclusive p p ¯
→W
+jets cross section, Phys. Lett.
B666(2008), arXiv:0803.2259 [hep-ex].
[6] CMS Collaboration, Measurement of associated W
+charm production in pp collisions at
√