ATLAS NOTE
ATLAS-CONF-2012-111
August 14, 2012
Search for direct chargino production in anomaly-mediated supersymmetry breaking models based on a disappearing-track signature, in pp collisions at √
s = 7 TeV with the ATLAS detector at the LHC
The ATLAS Collaboration
Abstract
A search for direct chargino production in anomaly-mediated supersymme- try breaking (AMSB) scenarios is performed using 4.7 fb
−1of pp collision data at
√ s = 7 TeV with the ATLAS experiment. In AMSB models, the lightest chargino is predicted to have a lifetime long enough to be detected in the tracking detectors of collider experiments. This analysis explores AMSB models by searching for decay- ing charginos that result in tracks with few associated hits in the outer region of the tracking system. The p
Tspectrum of candidate tracks is found to be consistent with the expectation from the Standard Model background processes, and constraints on the chargino properties are obtained.
⃝ c Copyright 2012 CERN for the benefit of the ATLAS Collaboration.
Reproduction of this article or parts of it is allowed as specified in the CC-BY-3.0 license.
1 Introduction
Anomaly-mediated supersymmetry breaking (AMSB) models [1,2], where soft supersymmetry (SUSY) breaking is caused by loop e ff ects, provides a constrained mass spectrum of SUSY particles. In particular, the ratios of the three gaugino masses are given approximately as M
1: M
2: M
3≈ 3 : 1 : 7 , where M
i(i = 1, 2, 3) are the bino, wino and gluino masses, respectively. The lightest gaugino is the wino, and the lightest chargino ( ˜ χ
±1) and neutralino ( ˜ χ
01) are the charged and neutral winos. The ˜ χ
±1becomes slightly heavier than the ˜ χ
01due to radiative corrections involving electroweak gauge bosons. The typical mass splitting between the charged and neutral winos ( ∆m
χ˜1) is 160–170 MeV. This phenomenological feature of the nearly degenerate ˜ χ
±1and ˜ χ
01has the important implication that the ˜ χ
±1has a considerable lifetime and predominantly decays into ˜ χ
01plus a low-momentum (∼ 100 MeV) π
±. The lifetime of the ˜ χ
±1is expected to be typically a few times 10
−1ns. Therefore, some charginos will have decay lengths over a few tens of centimeters at the energies of the Large Hadron Collider (LHC) and their tracks may have no or few associated hits in the outer region of the tracking system, causing them to be classified as “disappearing tracks”.
This paper describes a search for the production of long-lived AMSB charginos, via elec- troweak processes in pp collisions at √
s = 7 TeV, with their subsequent decays:
pp → χ ˜
±1χ ˜
01j, pp → χ ˜
+1χ ˜
−1j. (1) where j denotes an energetic jet from initial state radiation used to trigger the signal event. Since the ˜ χ
±1decays before reaching the muon spectrometer and the ˜ χ
01escapes from the detector, the resulting signal topology is characterized by a high-p
Tjet, large missing transverse momentum (its magnitude is denoted by E
missTin this paper), and a high-p
Tdisappearing track. The previous search [3] by the ATLAS collaboration was based on signal production via the strong interaction, resulting in final states with multiple high-p
Tjets and large E
missT. Given the ratio M
3/M
2∼7, the masses of colored particles are comparably large and thus the cross sections are small compared to the electroweak production.
2 The ATLAS detector
ATLAS is a multi-purpose detector [4], covering nearly the entire solid angle
1around the collision point with layers of tracking devices surrounded by a superconducting solenoid providing a 2 Tesla magnetic field, a calorimeter system, and a muon spectrometer. The inner detector (ID) provides track reconstruction in the region |η| < 2 . 5 and consists of pixel and silicon microstrip (SCT) detectors inside a transition radiation tracker (TRT). Of particular importance to this analysis is the TRT detector. The barrel TRT covers the region |z| < 780 mm and is divided into inner, middle, and outer concentric rings of 32 modules each, comprising a stack in azimuthal angle. They cover the radial ranges 563 mm to 694 mm (inner), 697 mm to 860 mm (middle), and 863 mm to 1066 mm (outer). A module consists of a carbon-fiber laminate shell and an array of straw tubes. The average numbers of pixel, SCT and TRT hits on a track going through the inner detector in the central region are about 3, 8 and 34, respectively. The
1
ATLAS uses a right-handed coordinate system with its origin at the nominal interaction point (IP) in the center
of the detector and the
z-axis coinciding with the axis of the beam pipe. Thex-axis points from the IP to the centerof the LHC ring, and the
y-axis points upward. Cylindrical coordinates (r, ϕ) are used in the transverse plane, ϕbeing the azimuthal angle around the beam pipe. Pseudorapidity is defined in terms of the polar angle
θas
η=−ln tan(θ/2).
calorimeter system covers the range |η| < 4.9. The electromagnetic calorimeter is a lead/liquid- argon (LAr) detector in the barrel ( |η| < 1 . 475) and endcap (1 . 375 < |η| < 3 . 2) regions. The hadronic calorimeters are composed of a steel and scintillator barrel (|η| < 1.7), a LAr/copper endcap (1.5 < |η| < 3.2), and a LAr forward system (3.1 < |η| < 4.9) with copper and tungsten absorbers. The muon spectrometer consists of three large superconducting toroids, trigger chambers, and precision tracking chambers which provide muon momentum measurements up to |η| of 2.7.
3 Data and simulated event samples
This search is based on pp collision data at √
s = 7 TeV recorded by the ATLAS detector in 2011, corresponding to an integrated luminosity of 4.7 fb
−1after the application of beam, detector, and data quality requirements.
The jet p
Tspectrum of signal events is steeply falling and the signal trigger rate is over- whelmed by the large cross section of QCD di-jet events. In order to achieve an acceptable event rate, candidate events are selected at the trigger level by requiring at least one jet with p
T> 55 GeV, E
missT> 55 GeV, and ∆ϕ
jetmin−EmissT> 1, where ∆ϕ
jetmin−EmissTindicates the smallest az- imuthal separation between a jet and missing transverse momentum, of either of the two highest-p
Tjets with p
T> 30 GeV. The jet p
Tand E
missTfor the trigger are based on calorimeter information and measured at the electromagnetic scale. For background events E
missTis usually aligned with the leading jet (∆ϕ
jetmin−EmissT≈ 0) since it is due to jet mis-measurements while for the signal ∆ϕ
jet−minEmissT≈ π as it arises from the outgoing neutralinos.
Simulated Monte Carlo (MC) events are used to assess the experimental sensitivity to given models. The minimal AMSB model is characterized by four parameters: the gravitino mass (m
3/2), the universal scalar mass (m
0), the ratio of Higgs vacuum expectation values at the electroweak scale (tan β ), and the sign of the higgsino mass term ( µ ). I sasusy from I sajet v7.80 [5]
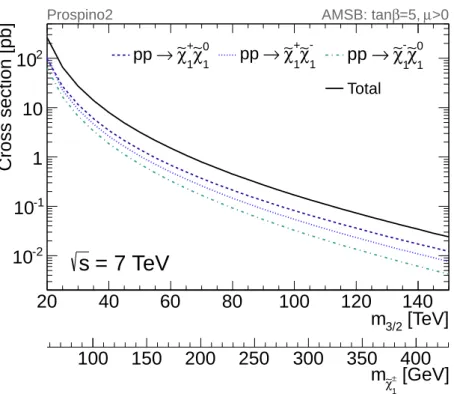
is used to calculate the SUSY mass spectrum and the decay tables. The MC signal samples are produced using H erwig++ [6] with MRST2007 LO* [7] parton distribution functions (PDFs). All simulated samples used in this paper are produced using the underlying-event parameter tune described in [8] and a detector simulation based on G eant 4 [9, 10] with multiple pp interactions per event (pile-up) to model that observed in data. Signal cross sections are calculated at next-to-leading order in the strong coupling constant (NLO) using P rospino 2 [11], as shown in Fig. 1. The nominal cross section and the uncertainty are taken from an envelope of cross section predictions using different PDF sets and factorization and renormalization scales, as described in Ref. [12]. Simulated points with chargino masses ranging from 70–300 GeV are studied, and in particular two reference points with m
χ˜±1
∼ 100 and 200 GeV are illustrated in this paper.
A large value of 1 TeV is used for m
0in order to prevent the existence of a tachyonic slepton.
However, the production cross section is determined only by the wino mass ( ∝ m
3/2), and
the results presented in this paper are largely independent of these parameters. The chargino
lifetime (τ
χ˜±1) is set to 1 ns, the value for which this analysis has the highest sensitivity. Samples
with di ff erent lifetimes are obtained by applying event weights to the original one, such that
the distribution of the proper lifetime follows that for a given lifetime value. The branching
fraction for the decay ˜ χ
±1→ χ ˜
01π
±is set to 100%.
[TeV]
m
3/220 40 60 80 100 120 140
Cross section [pb]
10
-210
-11 10 10
2[GeV]
±
χ∼1
100 150 200 250 300 350 m 400
0
χ∼
1 +χ∼
1→
pp
-χ∼
1 +χ∼
1→
pp
0χ∼
1 -χ∼
1→ pp Total
Prospino2 AMSB: tan β =5, µ >0
= 7 TeV s
Figure 1: The cross section of direct chargino production at √
s = 7 TeV as a function of m
3/2. The corresponding m
χ˜±1
values for each m
3/2are also indicated.
4 Event selection
This section describes the definitions of objects such as jets and leptons, and selection criteria for candidate tracks. Kinematic selection criteria ensure high trigger e ffi ciency while reducing Standard Model (SM) background arising from non-identifiable charged leptons. The vast majority of background events are removed by the TRT-based selection criteria that are used to identify the decay of the chargino.
4.1 Object definitions
Jets are reconstructed using the anti-k
talgorithm [13] with a distance parameter of 0.4. The inputs to the jet reconstruction algorithm are topological calorimeter energy clusters [14]. The measurement of jet transverse momentum at the electromagnetic scale (p
jetT ,EM) underestimates hadron-level jets due to the nature of the non-compensating calorimeters and dead material.
Thus, an average correction is applied to obtain the correct transverse momentum depending on η and p
jet,EMT. The details of the jet calibration procedure are given in Ref. [15]. In the analysis, requirements of p
T> 20 GeV and |η| < 2.8 are applied. Electron candidates are selected with loose identification requirements, as described in Ref. [16] and required to fulfill the requirements of E
T> 10 GeV, |η| < 2 . 47. Muon candidates are identified by an algorithm which combines a track reconstructed in the muon spectrometer with an ID track or an ID track with a track segment in the innermost muon station [4, 17]. Furthermore, muons are required to have at least one hit in the innermost layer of the pixel detector (N
b−layer) if crossing an active module of that layer, more than one pixel hit (N
pixel), at least six SCT hits (N
SCT), p
T> 10 GeV and |η| < 2.4.
Following the object reconstruction described above, overlaps between jets and leptons are
resolved. First, any jet candidate lying within a distance of ∆R ≡ √( ∆η )
2+ (
∆ϕ )
2< 0.2 of an electron is discarded. Then, any lepton candidate within a distance of ∆R < 0.4 of any surviving jet is discarded.
The calculation of E
missTis based on the transverse momenta of jets and lepton candidates described above and all calorimeter energy clusters that are not associated to such objects [18].
4.2 Kinematic selection criteria
Following the trigger decision, selection requirements to suppress non-collision background events, given in Ref. [15], are applied to jets. Candidate events are then required to have no electron or muon candidates (lepton veto) to suppress the background events from W/Z + jets and top-pair production processes. The candidates are also required to have E
missT> 90 GeV and at least one jet with p
T> 90 GeV. In order to further suppress the QCD background, ∆ϕ
jet−Emin missT> 1.5 for the two highest p
Tjets with p
T> 50 GeV is also required. The trigger selection is 98%
e ffi cient for signal events satisfying these selection requirements.
4.3 Disappearing track selection criteria
The TRT detector provides a substantial discrimination between penetrating and decaying charged particles: the average number of hits on a track going through the TRT in the barrel region is about 34 and consecutive hits can be observed along the track with small radial spacing between adjacent hits, while a smaller number is expected for charged particles that decay in the TRT volume. If a chargino decays in the TRT volume, the track is still found with a high efficiency based on its hits in the Pixel and SCT detectors. Such a chargino track candidate can be fully reconstructed by the ATLAS standard track reconstruction algorithm.
The tracks originating from decaying charginos are expected to have high-p
Tand to be isolated. Therefore, chargino candidate tracks are required to fulfill the following criteria:
(I) The track should have N
pixel≥ 1, N
b−layer≥ 1 if crossing an active module of the innermost pixel layer, N
SCT≥ 6, |d
0| < 1.5 mm and |z
0sin θ| < 1.5 mm, where d
0and z
0are the transverse and longitudinal impact parameters with respect to the primary vertex [19].
(II) The track should be isolated: there should be no tracks having p
Tabove 0.4 GeV within a cone of ∆R < 0 . 1 around the candidate track, where ∆R is the radial distance between two tracks. There should be also no jets having p
Tabove 50 GeV within a cone of ∆R < 0.4.
(III) The candidate track should have p
Tabove 10 GeV, and should be the highest p
Tisolated track in the event.
(IV) The relative uncertainty on the momentum measurement should be below 20%.
(V) The candidate track should point to the TRT barrel layers with |η| < 0 . 63 and not point to the region |η| < 0.1.
(VI) The number of hits in the TRT outer module associated to the track (N
outerTRT) should be fewer than five.
Criterion (I) is applied to all tracks in order to ensure well-reconstructed primary tracks. Criteria (II) and (III) are employed to select chargino tracks that are isolated and have the highest p
Tin most cases. Tracks seeded from an incorrect combination of SCT space-points could have
anomalously high values of p
Tand worse momentum resolution; criterion (IV) suppresses
such tracks. Criterion (V) is based on the extrapolated track position and is set to avoid inactive regions of the TRT and reject muons failing identification due to a small gap in acceptance around η = 0. For criterion (VI), N
outerTRTis calculated by counting TRT hits lying on the extrapolated track.
This criterion selects charginos decaying within the volume between the SCT outer layers and the TRT outer modules. Hereafter, unless explicitly stated otherwise, “high-p
Tisolated track selection” and “disappearing-track selection” indicate criteria (I)–(V) and (I)–(VI), respectively.
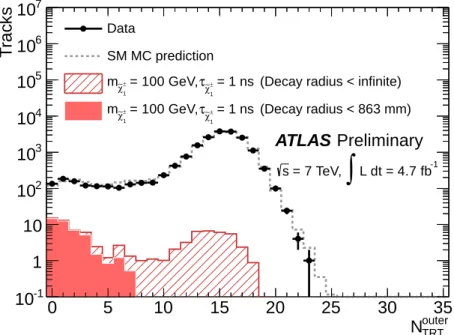
Figure 2 shows the N
TRTouterdistributions with the high-p
Tisolated track selection requirements for data, simulated signal MC, and simulated MC SM background events. The details of SM background MC samples are described in Ref. [20]. When charginos decay before reaching the TRT outer module, N
TRTouteris expected to have a value near zero; conversely, charginos that reach the calorimeters and SM charged particles traversing the TRT typically have N
TRTouter≃ 15. The purity of chargino tracks in the signal MC events, defined as the fraction of candidate tracks matched to generated charginos, is almost 100% at this stage; criterion (VI) removes the vast majority of background events. Although it also reduces the signal e ffi ciency, it strongly enhances the expected signal to background ratio. A summary of kinematic selection criteria, disappearing track requirements, and the data reduction are given in Table 1. After the application of all selection criteria, 710 candidate events are selected.
outer
N
TRT0 5 10 15 20 25 30 35
T ra c k s
10
-11 10 10
210
310
410
510
610
7Data
SM MC prediction = 1 ns
1
χ∼±
τ = 100 GeV,
1
χ∼±
m
= 1 ns
1
χ∼±
τ = 100 GeV,
1
χ∼±
m
(Decay radius < infinite) (Decay radius < 863 mm)
ATLAS Preliminary
L dt = 4.7 fb-1
∫
= 7 TeV, s
Figure 2: The N
outerTRTdistribution for data and signal events (m
χ˜±1
= 100 GeV, τ
χ˜±1= 1 ns) with the high-p
Tisolated track selection. The expectation from SM MC normalized to the number of observed events, is also shown. When charginos decay before reaching the TRT outer module, N
outerTRTis expected to have a value near zero; conversely, through-going charginos without decay and SM charged particles traversing the TRT typically have N
outerTRT≃ 15.
5 Estimate of the p T spectrum of the background contributions
According to MC simulation, the background contribution after the high-p
Tisolated track
selection comes predominantly from the W(→ τν)+jets production in which τ decay products
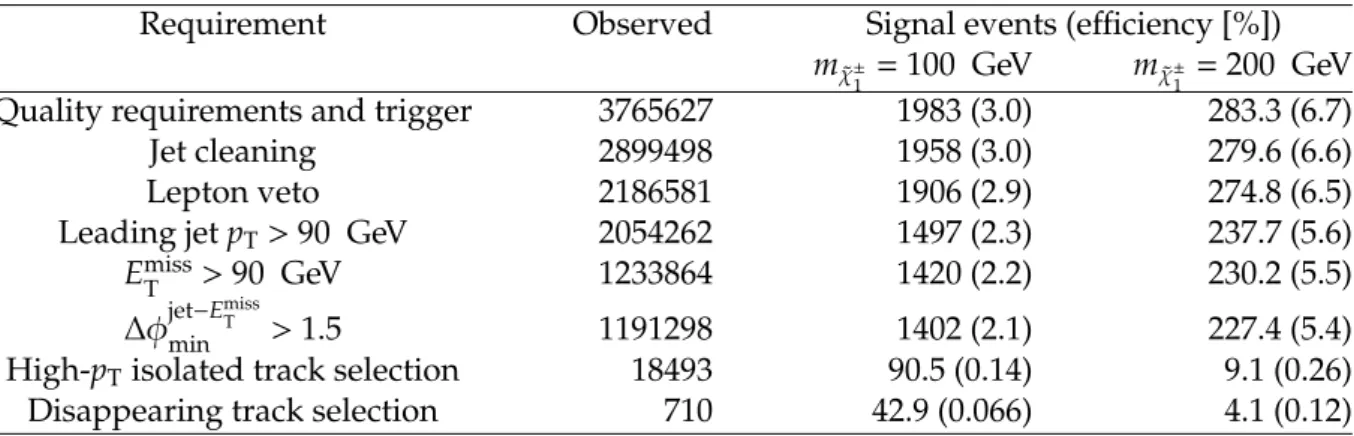
Requirement Observed Signal events (efficiency [%]) m
χ˜±1
= 100 GeV m
χ˜±1
= 200 GeV Quality requirements and trigger 3765627 1983 (3.0) 283.3 (6.7)
Jet cleaning 2899498 1958 (3.0) 279.6 (6.6)
Lepton veto 2186581 1906 (2.9) 274.8 (6.5)
Leading jet p
T> 90 GeV 2054262 1497 (2.3) 237.7 (5.6)
E
missT> 90 GeV 1233864 1420 (2.2) 230.2 (5.5)
∆ϕ
jet−Emin missT> 1.5 1191298 1402 (2.1) 227.4 (5.4)
High-p
Tisolated track selection 18493 90.5 (0.14) 9.1 (0.26)
Disappearing track selection 710 42.9 (0.066) 4.1 (0.12)
Table 1: Summary of selection requirements and data reduction for data and expected signal events ( τ
χ˜±1= 1 ns). The signal selection e ffi ciencies are also shown in parentheses. Signal efficiencies are low at the first stage due to the trigger based on initial state radiation.
fulfill the selection criteria. Sub-leading contributions to the background come from prompt electrons or muons failing to satisfy their identification criteria. A background estimation based on the MC simulation su ff ers from large uncertainties due to poor statistics after all the selection requirements and has difficulty simulating the properties of these background tracks. Therefore, an approach using data-driven control samples enriched in these background categories is employed to estimate the background track p
Tspectrum. A simultaneously fit is then performed for signal and background yields using the p
Tspectrum of observed tracks.
5.1 Interacting charged hadrons
High-p
Tcharged hadrons (mostly charged pions) can interact with material in the TRT detector and some tracks can be labeled as disappearing tracks; according to MC simulation, they are responsible for more than 80% of the background in the signal search sample. The p
Tspectrum of interacting hadron tracks is obtained from that of non-interacting hadron tracks, in the same way as in Ref. [3]. In the p
Trange above 10 GeV, where inelastic interactions dominate, the interaction rate has nearly no p
T-dependence [21]. By adopting the same kinematic selection criteria as those for the signal and ensuring a penetration through the TRT detector by requiring N
outerTRT> 10, a sample of high-p
Tnon-interacting hadron tracks is obtained. The contamination from electron tracks and any chargino signal is removed by requiring the associated calorimeter activity, E
cone20T/p
trackT, to be larger than 0.2, where E
cone20Tis the transverse calorimeter energy deposited in a cone of ∆R < 0 . 2 around the track excluding E
Tof its corresponding calorimeter cluster and p
trackTis the track p
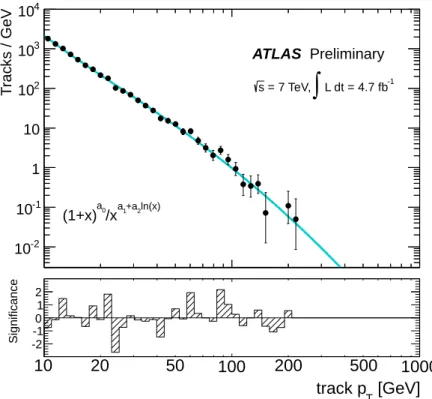
T. According to MC simulation, the purity of non-interacting hadron tracks is > 99% after these requirements. These hadron tracks show a steeply falling p
Tspectrum, as shown in Fig. 3. An ansatz functional form
(1+x)a0xa1+a2 ln(x)
is then fitted to the p
Tspectrum of the control sample, where x ≡ p
trackTand a
i(i = 0, 1, 2) are the fitted parameters. The data distribution is well described by this functional form; a χ
2per degree of freedom (DOF) of 39 / 50 is calculated from the di ff erence between the data and the best-fit form.
5.2 Electrons failing to satisfy identification criteria
The charged lepton background is mostly due to large bremsstrahlung, and predominantly low-
p
Telectrons contribute to this background. Muons failing to satisfy the identification criteria
100 1000
T ra c k s / G e V
10
-210
-11 10 10
210
310
4ATLAS Preliminary
L dt = 4.7 fb-1
∫
= 7 TeV, s
ln(x) +a2
a1 0
/x (1+x)
a[GeV]
track p
T100 1000
Significance -2
-1 0 1 2
10 20 50 200 500
Figure 3: The p
Tdistribution of the hadron-track background control sample. The data and the fitted shape are shown by solid circles and a line, respectively. The significance of the di ff erence between the data and the fit model on a bin-by-bin basis is also shown at the bottom of the figure.
could be also classified as disappearing tracks, however, the contribution of these tracks is negligibly small because the probability of bremsstrahlung photon emission is proportional to 1 /m
2l, where m
lis the lepton mass.
In order to estimate the electron background, first a control sample is defined by requiring the same kinematic selection requirements as for the signal search sample, but requiring one electron that fulfills medium identification criteria [16] and the isolated track selection criteria;
the purity of electrons is close to 100% according to MC simulation. The p
Tspectrum of electrons without any identification requirements is obtained by applying the correction for the medium identification e ffi ciency [16]. This correction depends on p
Tand η , with an average value around 0.8. The p
Tdistribution of electron background tracks is then estimated by multiplying the corrected distribution (described above) by the probability of failing to satisfy the loose identification criteria (hence being retained in the signal search sample) and passing the disappearing track selection criteria for electrons (P
dise). For the measurement of P
dise, a “tag-and- probe” method is applied to Z → ee events collected with unprescaled single-electron triggers.
In order to ensure a very pure sample of Z → ee events, tag-electrons should be well-isolated from jet activities and also required to fulfill tight identification criteria [16] and have p
T>
25 GeV. First, the Z → ee sample is selected by requiring no identified muons, at least one
tag-electron, one high-p
Tisolated track. Probe-electrons are selected without any identification
requirements but requiring the high-p
Tisolated track selection criteria that are exactly the same
as chargino candidate tracks. Then, the reconstructed invariant mass is required to be within the range from 85–95 GeV; its value is calculated using the calorimeter energy and the track momentum for the tag and probe electrons, respectively. The track momentum is used for the probe electron, since in the absence of any electron identification, the precise calorimeter energy is not well defined. The probability P
diseis finally given by the fraction of events in which the probe-electron passes the disappearing track selection criteria; it ranges from 10
−2–10
−4for 10 GeV
< p
T< 50 GeV. Due to the lack of sufficient statistics, the nominal values of P
diseare derived using MC events; no visible dependence on p
Tis found, and the overall ratios for data and MC events are in agreement with an uncertainty of 13%.
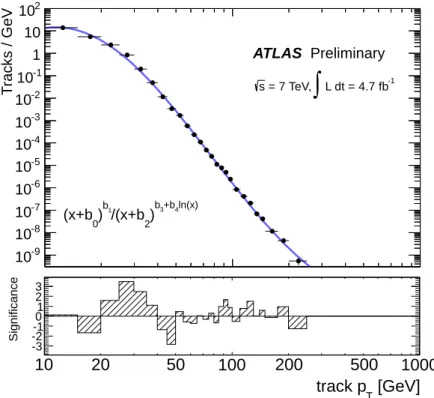
Figure 4 shows the resulting p
Tspectrum of electron background tracks; the systematic uncertainties of the identification e ffi ciency are incorporated in the p
Tspectrum. The p
T- dependent identification efficiency and P
disemake up a complicated spectrum, therefore, the electron background shape is determined by the fit with an extended functional form
(x+b0)b1(x+b2)b3+b4 ln(x)
where x ≡ p
trackTand b
i(i = 0, 1, 2, 3, 4) are the fitted parameters. A χ
2per DOF is calculated to be 47 / 26. The number of electron background tracks in the signal search sample is estimated to be 115 ± 15. Statistical errors, uncertainties on the identification efficiency and P
diseare considered.
100 1000
T ra c k s / G e V
10
-910
-810
-710
-610
-510
-410
-310
-210
-11 10 10
2ATLAS Preliminary
L dt = 4.7 fb-1
∫
= 7 TeV, s
ln(x) +b4
b3
2
) /(x+b
b1
0
) (x+b
[GeV]
track p
T100 1000
Significance
-3-2-10231
10 20 50 200 500
Figure 4: The estimated p
Tdistribution of electron background tracks. The data and the fitted
shape are shown by solid circles and a line, respectively. The significance of the difference
between the data and the fit model on a bin-by-bin basis is also shown at the bottom of the
figure.
6 Estimate of systematic uncertainties
The following sources of systematic uncertainty on the signal acceptance have been considered:
the theoretical cross section, the parton radiation model, the jet energy scale (JES) and resolution (JER), the trigger efficiency, the pile-up modeling, the track reconstruction efficiency, and the integrated luminosity.
Theoretical uncertainties on the signal cross section, already described in Sec. 3, range from 6 to 8 % depending on m
χ˜±1. High-p
Tjets originating from initial and final state radiation alter the signal acceptance. The uncertainties on these processes are estimated by varying generator tunes in the simulation as well as by generator-level studies with an additional jet in the matrix element method with M ad G raph 5 [22]+P ythia 6 [23], after applying the kinematic selection.
By adopting the PDF tunes that provide less and more radiation and taking the maximum deviation from the nominal one, the uncertainty on jet radiation is evaluated. The uncertainty arising from the matching parameter [24] between matrix elements and parton showers is also assigned by changing its default value by a factor of two. The resulting uncertainty, 10–15%
depending on m
χ˜±1
, is obtained by combining them in quadrature. The uncertainties on JES and JER result in a variation of the signal selection efficiency; the variation of the signal selection efficiency arising from these uncertainties is assessed according to Ref. [15], and an uncertainty of 5–10% is assigned. An uncertainty of 3% on the trigger e ffi ciency is assigned by taking the difference between data and MC W → µν samples. The uncertainty originating from the pile-up modeling in the simulation is evaluated by weighting simulated samples so that the average number of pile-up interactions is increased or decreased by 10%; an uncertainty of ± 0 . 5% is assigned. The ID material affects the track reconstruction efficiency. An uncertainty of 2% on the tracking efficiency due to the material description in the MC simulation, in particular for tracks in the region of |η| < 0 . 63, is quoted as given in Ref. [25]. The absolute luminosity of pp collisions is known with a precision of ±3.9% [26, 27].
Contributions of each systematic uncertainty in the signal expectation are summarized in Table 2 for two reference signal samples.
Systematic uncertainties on the background are determined from the statistical uncertain- ties on the fit parameters and their full correlation. In addition, the 13% uncertainty on the disappearing track probability of electrons is considered (see Sec. 5.2). Alternative fit functions for the p
Tshapes of the interacting hadron and electron tracks are also checked, showing that the given shapes agree with each other and with the original form within the fit uncertainties.
The effect on the sensitivity to the signals due to the choice of functional forms is also found to be negligible.
7 Statistical analysis
In order to evaluate how well the observed data agree with a given signal model, a statistical test is performed based on maximizing a likelihood. The likelihood function for the track p
Tin a sample of observed events (n
obs) is defined as
nobs
∏ n
sF
s(p
T) + n
hF
h(p
T) + n
eF
e(p
T)
n
s+ n
h+ n
e× L
sys, (2)
where n
s, n
hand n
eare the number of signal events for a given value of the chargino mass
and lifetime, the number of interacting hadron track events, and the number of electron track
events, respectively. The probability density function of the signal (F
s) is defined for a given
value of the chargino mass and lifetime and that of interacting hadron (electron) tracks, F
h(F
e),
Source m
χ˜±1
= 100 GeV m
χ˜±1
= 200 GeV (Theoretical uncertainty)
Cross section ±7 ±7
(Uncertainty on the acceptance)
Modeling of initial/final state radiation ±10 ±13
JES/JER ±10 ±6
Trigger e ffi ciency ± 3 ± 3
Pile-up modeling ±0.5 ±0.5
Track reconstruction efficiency ±2 ±2
Luminosity ± 3.9 ± 3.9
Sub-total ±15 ±15
Table 2: Summary of systematic uncertainties [%] on the expectation of signal events.
is shown in Fig. 3 (4). In the fit, n
eis constrained to be its estimated value (see Sec. 5.2). The e ff ects of systematic uncertainties on the normalizations and the shape parameters describing the two p
Tdistributions of the background tracks are incorporated via the constraining terms, L
sys, representing the product of normal and multivariate-normal distributions in which the variances are set to their uncertainties.
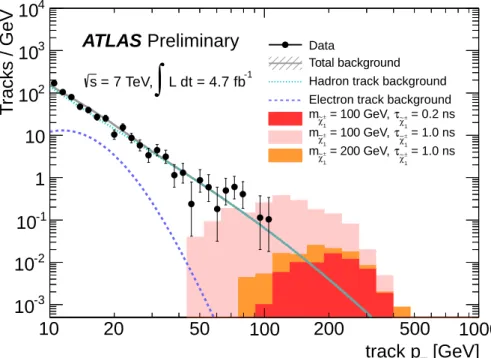
Figure 5 shows the p
Tdistribution for the selected data events compared to the background model obtained by the “background-only” fit in the p
Trange over 10 GeV. The best-fit values of n
hand n
eare 610 ± 30 and 105 ± 13, respectively. The probability of the fit to describe the data is found to be 0.54. The numbers of expected background and observed tracks in the region p
T> 50 (100) GeV are 14.8 ± 0.3 (2.20 ± 0.05) and 19 (1), respectively, exhibiting no significant excess in the data. The selected examples for the signal are also shown in Fig. 5. The values of n
sfor them, derived by the “signal + background“ fit, are found to be consistent with zero.
8 Results
In the absence of a signal, constraints on m
χ˜±1
and τ
χ˜1are set. The upper limit on the production cross section for a given m
χ˜±1and τ
χ˜1at 95% confidence level (CL) is set by a point where the CL of the “signal+background” hypothesis, based on the profile likelihood ratio [28] and the CLs prescription [29], falls below 5% when scanning CL along various values of signal strength.
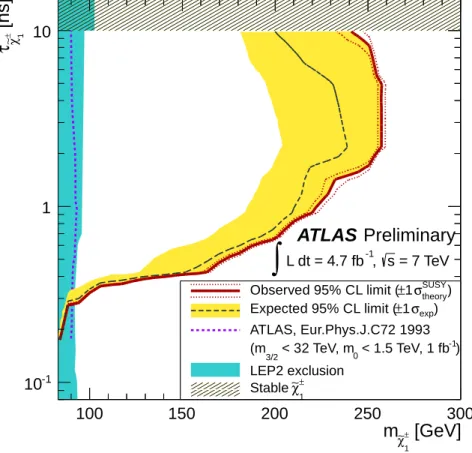
The constraint on the τ
χ˜±1-m
χ˜±1parameter space is shown in Fig. 6. The expected limit is set by the median of the distribution of 95% CL limits calculated by the pseudo-experiments with the expected background and no signal. The expected number of background events is derived by the background-only fit in the region 10 < p
T< 50 GeV; the systematic parameters are also varied according to their systematic uncertainties when performing pseudo-experiments.
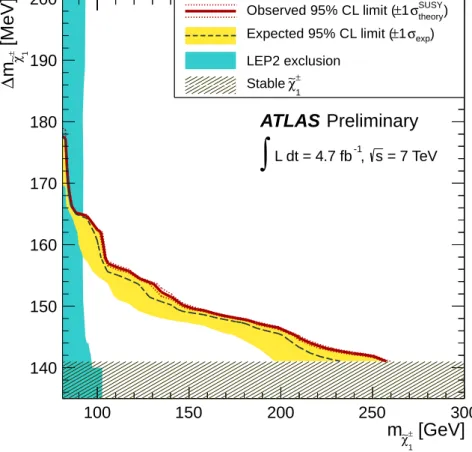
Figure 7 shows the constraint on the ∆m
χ˜1-m
χ˜±1
parameter space of the minimal AMSB model. The limits on τ
χ˜±1are converted into limits on ∆m
χ˜1by following Ref. [30]. The region excluded by the LEP2 searches [31–34] is also indicated. For ∆m
χ˜1= 160 (170) MeV (τ
χ˜±1
∼ a few times 10
−1ns), the value most probable in the model, a new limit of m
χ˜±1
> 103 (85) GeV at 95%
CL is obtained. For ∆m
χ˜1∼ 140 MeV, the stringent limit of m
χ˜±1
> 260 GeV is set.
The analysis is not performed for signals having τ
χ˜1> 10 ns ( corresponding ∆m
χ˜1is below
the charged pion mass ) because charginos could have significantly longer lifetime values over
a few tens ns for which this analysis has poor e ffi ciencies due to the fact that they are identified
most likely as muons and E
missTis then diluted.
[GeV]
track p
T100 1000
T ra c k s / G e V
10
-310
-210
-11 10 10
210
310
4Data
Total background Hadron track background Electron track background
= 0.2 ns
1
χ∼±
τ = 100 GeV,
1
χ∼±
m
= 1.0 ns
1
χ∼±
τ = 100 GeV,
1
χ∼±
m
= 1.0 ns
1
χ∼±
τ = 200 GeV,
1
χ∼±
m
ATLAS Preliminary
L dt = 4.7 fb
-1∫
= 7 TeV, s
10 20 50 200 500
Figure 5: The p
Tdistribution of candidate tracks. The solid circles show data and lines show background shapes obtained using the “background-only” fit. The contributions of two back- ground components and the signal expectations are also shown.
9 Conclusions
The results of a search for the direct production of long-lived charginos in pp collisions with the ATLAS detector using 4.7 fb
−1of data have been presented in the context of AMSB scenarios.
The search is based on a signature of high-p
Tisolated tracks with few associated hits in the
outer part of the ATLAS tracking system, arising from a chargino decay into a neutralino and
a very low-p
Tpion. The p
Tspectrum of observed candidate tracks is found to be consistent
with the expectation from SM background processes. Constraints on the chargino mass and
the mass splitting between the lightest chargino and neutralino are set. A chargino having a
mass below 103 (85) GeV with the mass splitting of 160 (170) MeV, the most favored scenario
in the AMSB model, is excluded at 95% CL. This analysis provides a complementary result
to the previous search based on the strong production processes [3]. The analysis reported
in this paper shows much better sensitivity and provides a largely AMSB-model-independent
constraint on the chargino properties.
[GeV]
1
χ∼±
m
100 150 200 250 300
[ns]
1± χ∼τ
10
-11 10
ATLAS Preliminary
= 7 TeV s
-1
, L dt = 4.7 fb
∫
theory) σSUSY
±1 Observed 95% CL limit (
exp) σ
±1 Expected 95% CL limit ( ATLAS, Eur.Phys.J.C72 1993
-1) < 1.5 TeV, 1 fb < 32 TeV, m0
(m3/2
LEP2 exclusion
±
χ∼1
Stable
Figure 6: The constraint on the τ
χ˜±1-m
χ˜±1
space for tan β = 5 and µ > 0. The black dashed line
shows the expected limits at 95% CL, with the yellow bands indicating the 1σ excursions due
to experimental uncertainties. Observed limits are indicated by red curves, where the solid
contour represents the nominal limit, and the dotted lines are obtained by varying the cross
section by the theoretical scale and PDF uncertainties. The previous result from Ref. [3] and
the combined LEP2 exclusion at 95% CL are also shown by the blue dotted line and the region
filled in cyan, respectively.
[GeV]
1
χ∼±
m
100 150 200 250 300
[MeV]
1± χ∼m ∆
140 150 160 170 180 190 200
ATLAS Preliminary
= 7 TeV s
-1
, L dt = 4.7 fb
∫
theory) σSUSY
±1 Observed 95% CL limit (
exp) σ
±1 Expected 95% CL limit ( LEP2 exclusion
±
χ∼1
Stable
Figure 7: The constraint on the ∆m
χ˜1-m
χ˜±1
![Table 2: Summary of systematic uncertainties [%] on the expectation of signal events.](https://thumb-eu.123doks.com/thumbv2/1library_info/4027845.1542223/11.892.106.783.112.341/table-summary-systematic-uncertainties-expectation-signal-events.webp)