Contents lists available atScienceDirect
Physics Letters B
www.elsevier.com/locate/physletb
Search for quark contact interactions in dijet angular distributions in pp collisions at √
s = 7 TeV measured with the ATLAS detector
✩.ATLAS Collaboration
a r t i c l e i n f o a b s t r a c t
Article history:
Received 27 September 2010
Received in revised form 12 October 2010 Accepted 13 October 2010
Available online 16 October 2010 Editor: H. Weerts
Keywords:
ATLAS LHC 7 TeV
Dijets angular distributions Quark compositeness Contact interactions
Dijet angular distributions from the first LHCppcollisions at center-of-mass energy√
s=7 TeV have been measured with the ATLAS detector. The dataset used for this analysis represents an integrated luminosity of 3.1 pb−1. Dijetχdistributions and centrality ratios have been measured up to dijet masses of 2.8 TeV, and found to be in good agreement with Standard Model predictions. Analysis of the χ distributions excludes quark contact interactions with a compositeness scaleΛbelow 3.4 TeV, at 95% confidence level, significantly exceeding previous limits.
©2010 CERN. Published by Elsevier B.V. All rights reserved.
1. Introduction
At hadron colliders, most events with large transverse momen- tum (pT) transfer occur when a constituent parton from one of the incoming hadrons scatters from a parton in the other. At high pT, these ‘2→2’ scattering processes are well described within the Standard Model by perturbative Quantum Chromodynamics (QCD), the quantum field theory of strong interactions. As each high-momentum parton emerges from the collision, the subse- quent parton shower and hadronization create a collimated jet of particles aligned with the direction of the original parton. In most of these collisions, two high-pT jets emerge from the interaction.
These ‘dijet’ events are particularly useful for measuring quantities associated with the initial interaction, such as the polar scattering angle in the two-parton center-of-mass (CM) frame,θ∗, and the di- jet invariant mass,mj j. Precise tests of QCD may be carried out by comparing the theoretical predictions to the experimental distribu- tions. If discrepancies between data and QCD are found to be well beyond experimental and theoretical uncertainties, this would in- dicate that the QCD description needs improvement, or that a new process, not included in the Standard Model, has appeared.
This analysis focuses on dijet angular distributions, which have been shown by previous experiments[1–4] to be sensitive mea- sures for testing the predictions of QCD and searching for new processes. Dijet angular distributions are well suited to the analysis
✩ © CERN, for the benefit of the ATLAS Collaboration.
E-mail address:atlas.publications@cern.ch.
of early LHC data, since they are little affected by the main sys- tematic uncertainties associated with the jet energy scale (JES) and the luminosity. QCD calculations predict that high-pT dijet produc- tion is dominated byt-channel gluon exchange, leading to angular distributions that are peaked at |cosθ∗| close to 1. By contrast, models of new processes characteristically predict angular distri- butions that would be more isotropic than those of QCD.
This Letter reports on the first search with the ATLAS detec- tor for quark contact interactions leading to modifications of dijet angular distributions in proton–proton (pp) collisions at a center- of-mass energy of√
s=7 TeV at the LHC. The data sample repre- sents an integrated luminosity of 3.1 pb−1, recorded in periods of stable collisions, through August 2010. The two distributions under study – dijetχdistributions, and dijet centrality ratios – have been used repeatedly as benchmark measures, and will be described in detail below.
The highest exclusion limits on quark contact interactions set by any previous experiment [4], for several statistical analyses, ranged from 2.8 to 3.1 TeV at 95% confidence level (CL) for the compositeness scaleΛ.
2. Kinematics and angular distributions
The θ∗ distribution for 2→2 parton scattering is predicted by QCD in the partonic CM frame of reference. Event by event, the momentum fraction (Bjorken x) of one incoming parton dif- fers from that of the other, causing the partonic reference frame to be boosted relative to the detector frame by an amount which can be determined from the dijet kinematics. A natural variable 0370-2693/©2010 CERN. Published by Elsevier B.V. All rights reserved.
doi:10.1016/j.physletb.2010.10.021
for analysis of parton–parton interactions is therefore the rapidity, y=12ln(EE+−ppz
z), whereEis the energy and pz, thez-component of momentum, of the given particle. The variable y transforms un- der Lorentz boosts along the z-direction as y→y− yB =y− tanh−1(βB), where βB is the velocity of the boosted frame, and yB is its rapidity boost.
The ATLAS coordinate system is a right-handed Cartesian sys- tem with the x-axis pointing to the center of the LHC ring, the z-axis following the counter-clockwise beam direction, and the y- axis going upwards. The polar angleθis referred to thez-axis, and φis the azimuthal angle about thez-axis.
Rapidity differences are boost invariant, so that under Lorentz boosts jets retain their shapes in (y, φ) coordinates. The pseudora- pidity,η= −ln(tan(θ2)), approaches rapidity in the massless limit and can be used as an approximation to rapidity. The variables η
andφare employed in the reconstruction of jets.
The variableχ, used in the first angular distributions consid- ered in this study, is derived from the rapidities of the two jets defining the dijet topology (y1 and y2). For a given scattering an- gleθ∗, the corresponding rapidity in the CM frame (in the massless particle limit) is y∗=12ln(11+|−|coscosθθ∗∗||). The variables y∗and yB can be found from the rapidities of the two jets using y∗=12(y1−y2) andyB=12(y1+y2). Then y∗may be used to determine the par- tonic CM angle θ∗. Additionally, y∗ is the basis for the definition ofχ:χ=exp(|y1−y2|)=exp(2|y∗|).
The utility of the χ variable becomes apparent when mak- ing comparisons of angular distributions predicted for new pro- cesses to those of QCD. In QCD, gluon (massless, spin-1) exchange diagrams have approximately the same angular dependence as Rutherford scattering: dN/d cosθ∗∝1/sin4(θ∗/2). Evaluation of dN/dχ shows that this distribution is constant inχ. By contrast, the angular distributions characteristic of new processes are more isotropic, leading to additional dijet events at lowχ. In QCD, sub- dominant diagrams also cause χ distributions to rise slightly at lowχ.
The other important kinematic variable derivable from jet ob- servables is the dijet invariant mass, mj j, which is also the CM energy of the partonic system. In reconstruction, mj j is found from the two jet four-vectors:mj j≡
(Ej1+Ej2)2−(pj1+ pj2)2, where E and p are the energy and momentum of the jets. Both distributions used in this Letter are binned in this variable.
The second angular distribution considered is the dijet central- ity ratio, RC. For this analysis, the detector is divided into two pseudorapidity regions: central and non-central. RC is defined as the ratio of the number of events in which the two highestpT jets both fall into the central region to the number of events in which the two highest pT jets both fall into the non-central region. For the current study, the central region is defined as|η1,2|<0.7, and the non-central region as 0.7<|η1,2|<1.3. Since new processes are expected to produce more central activity than QCD, their sig- nal would appear as an increase inRC above somemj j threshold, with the increase being directly related to the cross section of the new signal.
RC distributions are complementary to χ distributions by be- ing sensitive to different regions of phase space. χ distributions are fine measures of θ∗ and coarse measures of mj j, while the opposite is true for RC distributions as they can be binned more finely inmj j for the given amount of data. This gives RC distribu- tions greater discrimination in determining mass scales associated with hypothetical signals. Ideally, when a signal is present, the two distributions together can be used to narrow the list of viable hy- potheses and to establish the associated scale parameters.
The measured RC and χ distributions include corrections for the jet energy scale but are not unfolded to account for resolution
effects. They are compared to theoretical predictions processed through the detector simulation software that, similarly, includes the jet energy corrections but not resolution unfolding.
3. The ATLAS detector
The ATLAS detector [5] covers almost the whole solid an- gle around the collision point with layers of tracking detectors, calorimeters, and muon chambers. Jet measurements depend most strongly on the calorimeter system. The ATLAS calorimeter is seg- mented in intervals of pseudorapidity and φ to exploit the prop- erty that jet shapes are nearly boost invariant in (η, φ) coordinates.
Liquid argon (LAr) technology is used in the electromagnetic sampling calorimeters, with excellent energy and position reso- lution, to cover the pseudorapidity range |η|<3.2. The hadronic calorimetry in the range |η|<1.7 is provided by a sampling calorimeter made of steel and scintillating tiles. In the end-caps (1.5<|η|<3.2), LAr technology is also used for the hadronic calorimeters, matching the outer |η| limits of the electromag- netic calorimeters. To complete the η coverage, the LAr forward calorimeters provide both electromagnetic and hadronic energy measurements, extending the coverage to |η| =4.9. In ATLAS, the calorimeter (η, φ) granularities are 0.1×0.1 for the hadronic calorimeters up to|η|<2.5 (except for the third layer of the tile calorimeter, which has a segmentation of 0.2×0.1 up to|η| =1.7), and then 0.2×0.2 up to |η|<5.0. The EM calorimeters feature a much finer readout granularity varying by layer, with cells as small as 0.025×0.025 extending to|η|<2.5. This segmentation of the calorimeter is sufficiently fine to assure that angular resolution un- certainties in dijet analyses are negligible. In the data taking period considered approximately 187,000 calorimeter cells (98% of the to- tal) were active for event reconstruction.
ATLAS has a three-level trigger system, with the first level (L1) being custom built hardware. The two higher level triggers (HLT) are realized in software. The HLT was not set to reject events ac- cepted by the L1 single-jet triggers chosen for this analysis.
4. Event selection and reconstruction
In the current 3.1 pb−1 data sample, specific L1 jet trigger se- lections have been exploited for optimal analysis of the angular observables. For both observables, bins ofmj j are associated with distinct L1 jet trigger requirements selected to provide maximal statistics while being fully efficient, as will be detailed for χ in Section7.
Jets have been reconstructed using the infrared-safe anti-kt jet clustering algorithm [6]with the radius parameter R=0.6. The inputs to this algorithm are clusters of calorimeter cells seeded by energy depositions significantly above the measured noise. Jet four-vectors are constructed by the vectorial addition of cell clus- ters, treating each cluster as an (E, p) four-vector with zero mass.
The jet four-vectors are then corrected, as a function ofηandpT, for the effects of hadronic shower response and detector material distributions by using a calibration scheme based on Monte Carlo (MC) studies including full detector simulation, and validated with extensive test-beam studies[7]and collision data[8].
In order to suppress cosmic-ray and beam-related backgrounds, events are required to contain at least one primary collision vertex with a position of|z|<30 cm and reconstructed from at least five charged-particle tracks. Events with at least two jets are retained if the highestpT jet (the ‘leading’ jet) satisfiespTj1>60 GeV and the next-to-leading jet satisfies pTj2>30 GeV. The asymmetric thresh- olds are required so as to avoid suppression of events where a third jet has been radiated, while the 30 GeV threshold ensures
that reconstruction is fully efficient for both leading jets. Those events containing a poorly measured jet [9] with pT >15 GeV are vetoed to avoid cases where such a jet would cause incorrect identification of the two leading jets. This criterion results in a re- jection rate of 0.5% in the current data sample. The two leading jets are required to satisfy quality criteria, such as being associated with in-time energy deposits in the calorimeter. To be considered as one of the two leading jets, a jet is required to be found within the pseudorapidity region|η|<2.8, where the jet energy scale is known to highest precision.
5. Monte Carlo simulations
The Monte Carlo simulation used for the analysis presented in this Letter has the following components. The MC samples have been produced with the PYTHIA 6.4.21 event generator[10] and the ATLAS MC09 parameter tune[11], using the modified leading- order MRST2007[12]parton distribution functions (PDF). The gen- erated events are passed through the detailed simulation of the ATLAS detector [13], which uses GEANT4 [14] for simulation of particle transport, interactions, and decays. This yields QCD MC samples that have been smeared by detector effects for compar- ison with collision data. These simulated events are then subjected to the same reconstruction process as the data to produce dijet angular distributions.
As the next step, bin-by-bin correction factors (K-factors) have been applied to the angular distributions derived from MC events to account for next-to-leading order (NLO) contributions. The K- factors are derived from dedicated samples generated separately, and are defined as the ratioNLOME/PYTSHOW. The NLOM E sample is produced using matrix elements in NLOJET++ [15–17] and the NLO PDF from CTEQ6.6[18]. ThePYTSHOWsample is produced with PYTHIA restricted to leading-order (LO) matrix elements and par- ton showering using the modified leading order MRST2007 PDF.
The angular distributions generated with full PYTHIA already contain various non-perturbative effects modeled by this event generator (such as multiple parton interactions and hadronization).
The K-factors defined above are designed to retain these effects while adjusting for differences in the perturbative sector. Multiply- ing the full PYTHIA predictions of angular distributions by these bin-wise K-factors results in a reshaped spectrum which includes corrections originating from NLO matrix elements.
Over the full range ofχ, the K-factors change the normalized distributions by up to 6%, with little variability from one mass bin to the other. In the case of RC, the K-factors change the distribu- tion by less than 1%.
The QCD predictions used for comparison to data in this Letter are the end product of the two-step procedure described above.
Other ATLAS jet studies[19] have shown that the use of dif- ferent event generators and different sets of parameters for non- perturbative effects has a negligible effect on the studied observ- ables in the phase space being considered. For the high-pT dijet shape observables studied here, χ and RC, differences between PDF sets were found to be consistently smaller than the uncer- tainty associated with the CTEQ6.6 PDF set, and are not taken into account.
6. Quark contact interaction term
The benchmark beyond-the-Standard-Model process considered in this Letter is a quark contact interaction, which may be used to model the onset of kinematic properties that would characterize quark compositeness: the hypothesis that quarks are composed of more fundamental particles. The model Lagrangian for this bench- mark process is a four-fermion contact interaction [20–22], the
analog of the Fermi four-fermion interaction used to describe ef- fects of the weak interaction. The effects of the contact interaction would be expected to appear below or near a characteristic en- ergy scale Λ. If Λ is much larger than the partonic CM energy, these interactions are suppressed by inverse powers ofΛand the quarks would appear to be point-like. The dominant effect would then come from the lowest dimensional four-fermion interactions (contact terms).
While a number of contact terms are possible, the Lagrangian in standard use since 1984 [20] is the single (isoscalar) term:
Lqqqq(Λ) = 2ξΛg22 q
Ψ¯qLγμΨqLΨ¯qLγμΨqL, where g2/4π = 1 and the quark fields ΨqL are left-handed. The full Lagrangian used for hypothesis testing is then the sum ofLqqqq(Λ) and the QCD La- grangian. The relative phase of these terms is controlled by the interference parameter,ξ, which is set for destructive interference (ξ= +1) in the current analysis. Previous analyses[4]showed that the choice of constructive (ξ= −1) or destructive (ξ= +1) inter- ference changed exclusion limits by∼1%.
MC samples are calculated in PYTHIA 6.4.21 using this La- grangian, with each sample corresponding to a distinct value ofΛ. Angular distributions of these samples are processed in the same fashion as QCD distributions, including the application of bin-wise K-factors.
Notably, in addition to quark compositeness, this same La- grangian could be applied to a number of other beyond-the- Standard-Model theories (albeit with different coupling constants), so that it serves as a template for models of new processes with similar scattering distributions.
7. Kinematic criteria for angular distributions
Theχdistributions described here are normalized to unit area, (1/Nev)dNev/dχ where Nev is the number of observed events, to reduce the effects of uncertainties associated with absolute nor- malization.
Detector resolution effects smear the χ distributions, causing events to migrate between neighboring bins. This effect is reduced by configuring the χ bins to match the natural segmentation of the calorimeter, by making them intervals of constant η, ap- proximatingy. This is achieved by placing theχ bin boundaries at positions χn=e(0.3×n), wheren is the index for the lower χ
boundary of the nth bin, starting with n=0. In doing this, not only is the migration reduced, it is also equalized across the span ofχ.
The χ distributions are divided, in turn, into intervals of dijet invariant mass, mj j. For massless partons, the following approx- imate form shows the dependence of mj j on pT and χ: mj j=
√p
T1pT2·
χ+1/χ−2 cos(φ). Since mj j is the CM energy of the partonic system, new processes would be expected to appear in the high mass bins. Severalmj j intervals are analyzed to exploit the fact that theχdistributions in low mass bins would be similar to the QCD prediction, while these distributions would be modified by new physics processes acting in high mj j bins. The sensitivity to these processes depends strongly on their cross sections relative to QCD and on the number of events in the highest mass bin.
Forχ distributions, events are rejected if|yB|>0.75 or|y∗|>
1.7. The combined criteria limit the rapidity range of both jets to |y1,2|<2.45. The |y∗| criterion determines the maximum χ, which is 30 for this analysis. Taken together, these two criteria de- fine a region within the space of accessible y1 and y2 where the acceptance is uniform to better than 1% in χ, for all mass bins.
This ensures that the expected shapes of the distributions are not significantly changed by the acceptance. Also, in low mass bins, the|yB|criterion emphasizes the contribution from the matrix el-
ements and reduces the influence of the effects of PDF convolution.
In the highest mj j bin, used for limit setting, the |yB| criterion reduces the sample by 16%. These kinematic cuts have been opti- mized through full MC simulation to assure high acceptance in all dijet mass bins.
Since event migration also occurs between bins ofmj j, studies of fully simulated jets are used to ensure that migration is small.
This criterion, along with the requirement of a sufficient number of events, lead tomj j bin boundaries of 340, 520, 800, and 1200 GeV, with no upper bound on the highest bin. As noted earlier, single- jet triggers are carefully selected for each bin to be 100% efficient.
Prescaling of triggers leads to a different effective integrated lu- minosity in each mass bin, with the corresponding numbers being 0.12, 0.56, 2.0, and 3.1 pb−1in the current data sample for the bins listed above.
Like theχ distributions, theRC distribution has reduced sen- sitivity to the absolute JES. However, relative differences in jet response in η could have a significant impact on the sensitivity.
Hence, for these early studies, the η range is restricted to the more central regions of the calorimeter where the JES is uniform to within 1% as determined from cross-calibration studies[8]. The RC region has been chosen to end at a maximum of |η| =1.3, just before the transition region between the central and end-cap calorimeters.
8. Convolution of systematic uncertainties
As mentioned before, the angular distributions have a reduced sensitivity to the JES uncertainties compared to other dijet mea- surements. Nevertheless, the JES still represents the dominant un- certainty for this analysis. The ATLAS JES has been determined by extensive studies [23], and its uncertainty has been tabulated in the variablesη, pT, and NV, the number of vertices in the event.
The average NV over the full current data sample is 1.7. Typi- cal values of the JES uncertainty in the considered phase space are between 5% and 7%. The resulting bin-wise uncertainties are up to 9% for the χ observable, and up to 7% for the RC observ- able.
The dominant sources of theoretical uncertainty are NLO QCD renormalization and factorization scales, and the PDF uncertainties.
The corresponding bin-wise uncertainties for normalizedχ distri- butions are typically up to 3% for the combined NLO QCD scales and 1% for the PDF error.
Convolution of these experimental and theoretical uncertainties is done for all angular distributions through Monte Carlo pseudo- experiments (PE’s). For all events in the MC sample 1000 PE’s are performed, three random numbers being drawn from a Gaus- sian distribution for each PE. The first is applied to the absolute JES, obtained from the tabulation described above and assumed to be fully correlated across η. The second number is applied to the relative JES, extracted from the same tabulation, which de- pends only onη and restores the decorrelation due to ηdepen- dence of the energy scale. The third number is applied to the PDF uncertainty, provided by the CTEQ6.6 PDF error sets. In a fourth and final step, the uncertainty due to the NLO QCD renor- malization (μR) and factorization (μF) scales is found by letting
μR andμF vary independently between 0.5, 1 and 2 times the average transverse momentum of the two leading jets, resulting in nine samples drawn from a uniform distribution. In a given PE, the data dijet selection criteria described previously are ap- plied.
Other sources of uncertainty have been studied in separate sim- ulations, and have not been included in the PE’s described above.
As determined by in situ studies comparing data to detector sim- ulation[24], the jet energy resolution (JER) in ATLAS evolves from
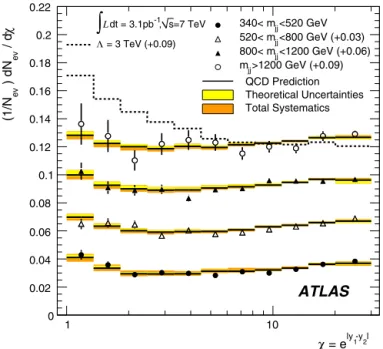
Fig. 1. The normalized χ distributions for 340<mj j<520 GeV, 520<mj j<
800 GeV, 800<mj j<1200 GeV, andmj j>1200 GeV, with plotting offsets shown in parentheses. Shown are the QCD predictions with systematic uncertainties (bands), and data points with statistical uncertainties. The prediction for QCD with an added quark contact term withΛ=3.0 TeV is shown for the highest mass bin mj j>1200 GeV.
Fig. 2.Dijet centrality ratio,RC, as a function ofmj j, with all events above a mass of 1400 GeV plotted in the last bin. Shown are the QCD prediction with systematic uncertainties (bands), and data points with statistical uncertainties. The prediction for QCD with an added quark contact term withΛ=2.0 TeV is also shown.
12% to 7% over the pT range from 60 GeV to 1 TeV. To estimate the effect of JER smearing, theχ andRC distributions were gen- erated with and without JER variation of this magnitude, and the differences were found to be negligible. Detector angular resolution effects in φandηwere studied in a similar fashion, with smear- ing functions specific to the ATLAS calorimeter segmentation, and also found to be negligible.
9. Comparison of data to theory
In Fig. 1 the measured dijet χ distributions are compared to the QCD predictions, along with 1σ systematic error bands deter- mined from the PE’s, and statistical errors on the data.Fig. 2shows the measured dijet-centrality distribution and QCD prediction. The statistical uncertainties are obtained using Poisson probabilities. In the highest mass bins, the numerator and denominator of the ratio typically contain 1 or 2 events each.
To evaluate the agreement between data and QCD in Figs. 1 and 2a statistical significance test was performed using p-values.
The p-value is the probability to obtain a fit to data further from the theoretical prediction than the observed fit, under the assump- tion that the QCD prediction is the correct description of physics.
A chi-square goodness-of-fit is used as the test statistic, and the p-values are derived from the ensemble of PE’s generated as de- scribed above, including bin-to-bin correlations due to systematic effects, but with additional statistical fluctuations. For theχdistri- butions shown inFig. 1, the resulting p-value for each dijet mass bin is (from lowest to highest) 0.19, 0.11, 0.27 and 0.54, indicating good agreement with the QCD prediction. Similarly, inFig. 2, the dijet RC comparison has a p-value equal to 0.85, also indicating good agreement with the QCD prediction.
The best fit of the RC distribution in Fig. 2 is obtained for a compositeness scale of 2.9 TeV. This is not statistically significant, as the QCD prediction lies within the shortest 68% confidence in- terval in 1/Λ4.
10. Determination of exclusion limits
Since no signal from new physics processes is apparent in these distributions, limits have been obtained on the compositeness scale Λof quark contact interactions, based on analyses of theχdistri- butions. The contact term hypothesis is tested in the highest dijet mass bin inFig. 1, which begins atmj j=1200 GeV. For theχdis- tribution in this mass bin, the parameterFχ is defined as the ratio of the number of events in the first fourχ bins to the number in all χ bins. The upper boundary of the fourth bin is at χ=3.32.
This choice of the bin boundary has been determined through a MC study that varies the number of bins in the numerator, as well as the dijet mass bin, and determines the setting that maximizes the sensitivity to quark contact interactions, given the current in- tegrated luminosity.
A frequentist analysis is employed as follows. Predictions ofFχ are obtained for a range of Λ by interpolation between distinct samples generated with different 1/Λ2 values. The QCD sample provides a bound with Λ= ∞, and additional samples are gen- erated with Λ values of 500, 750, 1000, 1500, and 3000 GeV. A full set of PE’s is made for each hypothesis to construct one-sided 95% CL intervals forFχ, and the Neyman construction[25]is then applied to obtain a limit onΛ.
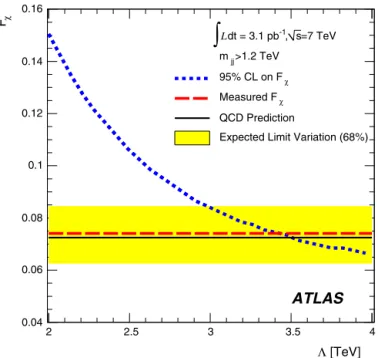
The result is shown in Fig. 3. The measured value of Fχ is shown by the dashed horizontal line. The value of Fχ expected from QCD is the solid horizontal line, and the band around it al- lows one to obtain the 1σ variation of the expected limit. The dotted line is the 95% CL contour of the Fχ prediction for quark contact interactions plus QCD, as a function ofΛand including all systematic uncertainties. This contour decreases as a function ofΛ since, for a smallΛscale, there would be more events at lowχ.
The observed limit onΛ is 3.4 TeV. This limit is found from the point where theFχ 95% CL contour crosses the measured Fχ value. All values ofΛless than this value are excluded with 95%
confidence. This corresponds to a distance scale of∼6·10−5fm, from conversion of the limit using hc. The expected limit, found¯ from the crossing at the QCD prediction, is 3.5 TeV.
Fig. 3.The dashed horizontal line is the measuredFχ (see text) and the solid hor- izontal line is the QCD prediction, with a band to illustrate a 1σ variation of the expected limit. The dotted curve is the 95% CL exclusion contour forFχ with quark contact interactions, used to set the exclusion limit onΛ.
The impact of systematic uncertainties is as follows. If all sys- tematic uncertainties were excluded, the observed limit reported above would increase by 6% to 3.6 TeV, mainly due to the JES uncertainty. Inclusion of NLO scales and PDF uncertainties does not change the limit measurably, as shape differences arising from these are well below the statistical uncertainties.
Confirming analyses have been done using a Bayesian approach with Poisson likelihoods for allχ bins, calculated using priors flat in 1/Λ2or 1/Λ4. These have resulted in observed exclusion limits on Λof 3.3 TeV and 3.2 TeV, respectively, very close to the limit found in the frequentist analysis.
Similarly, an analysis has been performed to establish 95% CL limits using the dijet centrality ratio shown in Fig. 2. The likeli- hood forRC is constructed as a product of likelihoods of inner and outer event counts for all mass bins, which is then analyzed with a Bayesian approach similar to that of theχ Bayesian analysis. Using priors flat in 1/Λ2 (1/Λ4) the observed exclusion limit is 2.0 TeV (also 2.0 TeV), with an expected limit of 2.6 TeV (2.4 TeV), pro- viding an additional benchmark for comparison with other exper- iments. A weaker limit than the one derived from the χ analysis is expected due to the lowerηacceptance associated with the RC observable.
11. Conclusion
Dijet angular distributions have been measured by the ATLAS experiment over a large angular range and spanning dijet masses up to 2.8 TeV. These distributions are in good agreement with QCD predictions. Using 3.1 pb−1of data, quark contact interactions with a scaleΛbelow 3.4 TeV are excluded at the 95% CL. The sensitiv- ity of this analysis extends significantly beyond that of previously published studies.
Acknowledgements
We are profoundly grateful to everyone at CERN involved in operating the LHC in such a superb way during this initial high-
energy data-taking period. We acknowledge equally warmly all the technical and administrative staff in the collaborating in- stitutions without whom ATLAS could not be operated so effi- ciently.
We acknowledge the support of ANPCyT, Argentina; Yerevan Physics Institute, Armenia; ARC and DEST, Australia; Bundesminis- terium für Wissenschaft und Forschung, Austria; National Academy of Sciences of Azerbaijan; State Committee on Science & Technolo- gies of the Republic of Belarus; CNPq and FINEP, Brazil; NSERC, NRC, and CFI, Canada; CERN; CONICYT, Chile; NSFC, China; COL- CIENCIAS, Colombia; Ministry of Education, Youth and Sports of the Czech Republic, Ministry of Industry and Trade of the Czech Repub- lic, and Committee for Collaboration of the Czech Republic with CERN; DNRF, DNSRC and the Lundbeck Foundation, Denmark; Eu- ropean Commission, through the ARTEMIS Research Training Net- work; IN2P3-CNRS and CEA-DSM/IRFU, France; Georgian Academy of Sciences; BMBF, DFG, HGF and MPG, Germany; Ministry of Ed- ucation and Religion, through the EPEAEK program PYTHAGORAS II and GSRT, Greece; ISF, MINERVA, GIF, DIP, and Benoziyo Center, Israel; INFN, Italy; MEXT, Japan; CNRST, Morocco; FOM and NWO, Netherlands; The Research Council of Norway; Ministry of Science and Higher Education, Poland; GRICES and FCT, Portugal; Ministry of Education and Research, Romania; Ministry of Education and Science of the Russian Federation and State Atomic Energy Corpo- ration ROSATOM; JINR; Ministry of Science, Serbia; Department of International Science and Technology Cooperation, Ministry of Edu- cation of the Slovak Republic; Slovenian Research Agency, Ministry of Higher Education, Science and Technology, Slovenia; Ministerio de Educación y Ciencia, Spain; The Swedish Research Council, The Knut and Alice Wallenberg Foundation, Sweden; State Secretariat for Education and Science, Swiss National Science Foundation, and Cantons of Bern and Geneva, Switzerland; National Science Coun- cil, Taiwan; TAEK, Turkey; The STFC, the Royal Society and The Leverhulme Trust, United Kingdom; DOE and NSF, United States of America.
Open Access
This article is published Open Access at sciencedirect.com. It is distributed under the terms of the Creative Commons Attribu- tion License 3.0, which permits unrestricted use, distribution, and reproduction in any medium, provided the original authors and source are credited.
References
[1] UA1 Collaboration, Physics Letters B 136 (1984) 294.
[2] UA2 Collaboration, Physics Letters B 144 (1984) 283.
[3] CDF Collaboration, Phys. Rev. Lett. 77 (1996) 5336.
[4] D0 Collaboration, Phys. Rev. Lett. 103 (2009) 191803.
[5] ATLAS Collaboration, JINST 3 (2008) S08003.
[6] M. Cacciari, G. Salam, G. Soyez, JHEP 0804 (2008) 063.
[7] P. Adragna, et al., Nucl. Instrum. Meth. A 615 (2010) 158.
[8] ATLAS Collaboration, ATLAS-CONF-2010-052, 2010.
[9] ATLAS Collaboration, ATLAS-CONF-2010-038, 2010.
[10] T. Sjostrand, S. Mrenna, P.Z. Skands, JHEP 0605 (2006) 026, arXiv:hep-ph/
0603175.
[11] ATLAS Collaboration, ATL-PHYS-PUB-2010-002, 2010.
[12] A. Sherstnev, R.S. Thorne, Eur. Phys. J. C 55 (2008) 553, arXiv:0711.2473 [hep- ph].
[13] ATLAS Collaboration, arXiv:1005.4568v1 [physics.ins-det] (Eur. Phys. J. C, 2010, in press).
[14] S. Agostinelli, et al., GEANT4, Nucl. Instrum. Meth. A 506 (2003) 250.
[15] Z. Nagy, Phys. Rev. Lett. 88 (2002) 122003.
[16] Z. Nagy, Phys. Rev. D 68 (2003) 094002.
[17] S. Catani, M.H. Seymour, Nucl. Phys. B 485 (1997) 291.
[18] P.M. Nadolsky, et al., Phys. Rev. D 78 (2008) 013004, arXiv:0802.0007 [hep-ph].
[19] ATLAS Collaboration, CERN-PH-EP-2010-034 arXiv:1009.5908v2 [hep-ex] (Eur.
Phys. J. C, 2010, submitted for publication).
[20] E. Eichten, I. Hinchliffe, K.D. Lane, C. Quigg, Rev. Mod. Phys. 56 (1984) 579.
[21] E. Eichten, I. Hinchliffe, K.D. Lane, C. Quigg, Rev. Mod. Phys. 58 (1986) 1065.
[22] P. Chiappetta, M. Perrottet, Phys. Lett. B 235 (1991) 489.
[23] ATLAS Collaboration, ATLAS-CONF-2010-056, 2010.
[24] ATLAS Collaboration, ATLAS-CONF-2010-054, 2010.
[25] J. Neyman, Philosophical Transactions of the Royal Society of London A 236 (1937) 333.
ATLAS Collaboration