ATLAS-CONF-2012-007 02March2012
ATLAS NOTE
ATLAS-CONF-2012-007
March 1, 2012
Search for high–mass dilepton resonances with 5 fb
−1of pp collisions at
√ s = 7 TeV with the ATLAS experiment
The ATLAS Collaboration
Abstract
This note reports on a search for narrow high-mass resonances decaying into dilepton final states. The data, recorded by the ATLAS experiment in ppcollisions at √
s = 7 TeV at the Large Hadron Collider, correspond to a total integrated luminosity of 4.9 (5.0) fb−1 in the e+e− (µ+µ−) channel. No statistically significant excess above the Standard Model expectation is observed, and upper limits are set at the 95% confidence level on the cross section times branching fraction ofZ0resonances and Randall-Sundrum gravitons decaying into dileptons as a function of the resonance mass. A lower limit of 2.21 TeV on the mass of the Sequential Standard ModelZ0boson is set. A Randall-Sundrum graviton with coupling k/MPl=0.1 is excluded at 95% confidence level for masses below 2.16 TeV.
1 Introduction
This note describes a search for narrow high-mass resonances decaying intoe+e− orµ+µ−pairs using 7 TeVppcollision data recorded with the ATLAS detector [1] at the Large Hadron Collider (LHC). Such resonances, which are predicted by several extensions of the Standard Model (SM), include new heavy spin-1 neutral gauge bosons such asZ0 [2, 3, 4] and Z∗[5], techni-mesons [6, 7, 8], as well as spin-2 Randall-Sundrum gravitons,G∗[9].
The benchmark models considered for the Z0 are the Sequential Standard Model (SSM) [3], with the same couplings to fermions as theZ boson, and the E6 Grand Unified symmetry group [2], broken into SU(5) and two additional U(1) groups, leading to new neutral gauge fields ψandχ. The particles associated with the additional fields can mix in a linear combination to form theZ0candidate: Z0(θE6)= Zψ0 cosθE6 +Zχ0sinθE6, where θE6 is the mixing angle between the two gauge bosons. The pattern of spontaneous symmetry breaking and the value ofθE6 determine theZ0couplings to fermions; six choices ofθE6 [2, 3] lead to the specificZ0states namedZψ0,Z0N,Z0η,Z0I,Z0S andZχ0.
Other models predict additional spatial dimensions as a possible explanation for the gap between the electroweak symmetry breaking scale and the gravitational energy scale. The Randall-Sundrum (RS) model [9] predicts excited Kaluza-Klein modes of the graviton, which appear as spin-2 resonances.
These modes have a narrow intrinsic width whenk/MPl<0.1, wherekis the spacetime curvature in the extra dimension, andMPl= MPl/√
8πis the reduced Planck scale.
Previous searches have set direct and indirect constraints on the mass of theZ0andG∗resonances [10, 11]. The Tevatron experiments [12, 13] excluded aZSSM0 with a mass lower than 1.071 TeV [13]. Recent measurements by the ATLAS and CMS collaborations based on 1 fb−1 of data excluded aZSSM0 with a mass lower than 1.83 TeV [14] and 1.94 TeV [15], respectively. In addition, indirect constraints from LEP [16, 17, 18, 19] have set a limit of 1.787 TeV [11] on the ZSSM0 . Constraints on the mass of the RS graviton have been set by the ATLAS [14, 20], CMS [15, 21], CDF [22] and D0 [23] collaborations.
Assumingk/MPl=0.1, CDF and D0 excluded graviton masses below 1.058 TeV and 1.050 TeV respec- tively, with the dielectron and diphoton channels combined; CMS excluded masses below 1.84 TeV with the diphoton channel only using 2 fb−1 of data, and masses below 1.78 TeV with the dielectron plus dimuon channels using 1 fb−1of data; the ATLAS lower limit was 1.95 TeV with the combination of the dielectron and dimuon channels (using 1 fb−1of data) and of the diphoton channel (using 2 fb−1of data).
2 ATLAS detector, data selection and trigger
The ATLAS detector consists of an inner detector surrounded by a 2 T superconducting solenoid, electro- magnetic and hadronic calorimeters, and a muon spectrometer with a toroidal magnetic field. Charged particle tracks in the pseudorapidity1 range |η| < 2.5 are reconstructed with the inner detector, which consists of silicon pixel, silicon strip, and transition radiation detectors. The superconducting solenoid is surrounded by a hermetic calorimeter that covers|η|<4.9. For|η|<2.5, the electromagnetic calorimeter is finely segmented and plays an important role in electron identification. Outside the calorimeter, air- core toroids provide the magnetic field for the muon spectrometer. Three stations of precision drift tubes (with cathode strip chambers for the innermost station for|η| > 2.0) provide an accurate measurement of the muon track curvature in the range|η| <2.7. Resistive-plate and thin-gap chambers provide muon triggering capability in the range|η|<2.4.
The data sample used in this analysis, recorded during 2011, corresponds to a total integrated lu- minosity of 4.9 (5.0) fb−1in the dielectron (dimuon) channel. The trigger used in the electron channel
1ATLAS uses a right-handed coordinate system with thez-axis along the beam pipe. Thex-axis points to the center of the LHC ring, and theyaxis points upward. Cylindrical coordinates (r, φ) are used in the transverse plane,φbeing the azimuthal angle. The pseudorapidity is defined in terms of the polar angleθasη=−ln tan(θ/2).
requires at least two electromagnetic clusters in the calorimeter, each with a transverse energy of at least 20 GeV. It was measured in data to be 99% efficient with respect to the event selection described below for dilepton masses above 100 GeV. For the muon channel, the trigger requires the presence of a single muon with a transverse momentum (pT) threshold of 22 GeV; the single-muon trigger efficiency was measured in data to be 85% in the barrel for most of the data-taking period, and 86% in the endcaps for the entire dataset. The muon trigger efficiency is lower than the electron trigger efficiency because of the lower geometrical acceptance of the muon trigger detectors.
3 Event selection
The triggered events are required to have a primary vertex with at least three associated charged particle tracks with pT >0.4 GeV.
In the dielectron channel, two electron candidates are required with transverse energyET > 25 GeV and|η| < 2.47; the transition region 1.37 ≤ |η| ≤ 1.52 between the barrel and the endcap calorimeters is excluded. Electron candidates are formed from clusters of cells reconstructed in the electromagnetic calorimeter associated with a charged particle track in the inner detector. Criteria on the transverse shower shape, the longitudinal leakage into the hadronic calorimeter, and the association with an inner detector track are applied to the cluster to define a so-calledMediumelectron [24]. The electron energy is obtained from the calorimeter measurement and its direction from the associated track. The calorimeter energy resolution is dominated at large ET by a constant term which is 1.2% in the barrel and 1.8%
in the endcaps. A hit in the first active pixel layer is required to suppress background from photon conversions. To further suppress background from QCD multijet production, the higherETelectron must be isolated, requiring thatΣET(∆R < 0.2) < 7 GeV, where∆R = p
(∆η)2+(∆φ)2andΣET(∆R < 0.2) is the sum of the transverse energy deposition in the calorimeter around the electron direction. The core of the electron energy deposition is excluded and the sum is corrected for transverse shower leakage and pile-up from additional pp collisions. Since the resolution on the dielectron mass is dominated by the calorimeter energy measurements, the two electron candidates are not required to have opposite charge, which to minimizes the losses due to charge mis-identification. For these selection criteria, the total signal acceptance for a Z0 → e+e− (G∗ → e+e−) of mass 2 TeV is 71% (72%), approximately independent of mass above 600 GeV. These numbers account for the acceptance of all selection criteria and efficiencies, and reflect the differences in lepton angular distributions due to spin.
In the dimuon channel, two muon candidates of opposite charge are required, each satisfying pT >
25 GeV. Muon tracks are reconstructed independently in both the inner detector and muon spectrometer, and their momenta are determined from a combined fit to these two measurements. To optimize the momentum resolution, each muon candidate is required to pass quality cuts in both the inner detector and the muon spectrometer. Most muons used in the analysis have at least three hits in each of the inner, middle, and outer layers of the muon spectrometer. To increase the reconstruction efficiency, muons reconstructed in only two layers of the muon spectrometer are also included in the search if they are in regions where the toroidal field is strong and the detector well aligned. Muons with hits in both the barrel and the endcap regions are discarded because of residual misalignment between these two parts of the muon spectrometer. The effects of misalignments and intrinsic position resolution are included in the simulation by applying a smearing toq/pT, which reproduces the momentum resolution of the data. The pT resolution at 1 TeV for muons reconstructed combining the measurements in the inner detector and muon spectrometer ranges from about 10% to 25%.
To suppress background from cosmic rays, the z position of the primary vertex is required to be within 200 mm of the centre of the detector, and the muon tracks are required to have a transverse impact parameter|d0|<0.2 mm and a distance along the beam-line to the primary vertex below 1 mm. To reduce background from jets, each muon is required to be isolated such that ΣpT(∆R < 0.3)/pT(µ) < 0.05,
where only tracks with pT >1 GeV, and not the muon track, enter the sum. The total signal acceptance is 43% (47%) for a Z0 → µ+µ− (G∗ → µ+µ−) of mass 2 TeV, including 4% from events with one muon reconstructed in only two layers of the muon spectrometer. The lower acceptance compared to the electron channel is due to the stringent requirements on the muon selection criteria to improve the pT resolution.
4 Signal and background simulation
For both channels, the dominant and irreducible background is due to the Z/γ∗ (Drell-Yan) process, characterized by the same final state as the signal. Small contributions fromt¯tand diboson (WW,WZand ZZ) production are also present in both channels. Semileptonic decays ofbandcquarks in the dimuon sample and a mixture of photon conversions, semileptonic heavy quark decays, and hadrons misidentified as electrons in thee+e−sample are backgrounds that are referred to below as QCD background or QCD multijet. Jets accompanyingWbosons (W+jets) may similarly produce lepton candidates in addition to the one fromW→`νdecay.
The expected signal and backgrounds, with the exception of the QCD multijet background, are evalu- ated with simulated samples and rescaled using the most precise available cross-section predictions. The Z0,G∗signal andZ/γ∗processes are generated with Pythia6.425 [25] using MRST2007lomod [26] par- ton distribution functions (PDFs). Interference between theZ/γ∗process and theZ0resonance is expected to be small and therefore neglected. The diboson processes are generated with HERWIG 6.510 [27] using MRST2007lomod PDFs. TheW+jets background is generated with ALPGEN [28] using CTEQ6L1 [29]
PDFs and thet¯t background with MC@NLO 3.41 [30] using CTEQ66 [31] PDFs. JIMMY 4.31 [32] is used for both processes to describe multiple parton interactions and HERWIG to describe the remaining underlying event and parton showers. Final-state photon radiation is handled with PHOTOS [33]. The samples are processed through a full ATLAS detector simulation [34] based on GEANT4 [35].
TheZ/γ∗ cross section is calculated at next-to-next-to-leading order (NNLO) using PHOZPR [36]
with MSTW2008 PDFs [37]. The ratio of this cross section to the leading-order cross section is used to determine a mass-dependent QCD K-factor which is applied to the results of the leading-order simula- tions. The same QCD K-factor is applied to theZ0signal. It is 0.91 at 2 TeV and slowly increases towards lower masses. A different K-factor is applied to theG∗signal. The calculated values vary between 1.6 and 1.8, depending on the graviton mass and onk/MPl[38]; in practice, 1.75 is used above 750 GeV. Elec- troweak corrections including virtual heavy gauge-boson loops are calculated using HORACE [39, 40], yielding an effective electroweak K-factor which is only applied to the Drell-Yan background.
Thet¯tcross section is predicted at approximately NNLO, with 10% uncertainty [41, 42]. The diboson cross sections are calculated at next-to-leading order (NLO) using MCFM [43]; theW inclusive cross section from ALPGEN, including all possible final states with and without jets, is renormalised to the NNLO calculation of FEWZ [44]; these cross sections are assigned a 5% uncertainty each, from scale, PDF andαsvariations. In the dimuon channel, theW +jets Monte Carlo yield is assigned an overall 30% systematic uncertainty from the sum of the cross sections of the ALPGEN samples with at least one parton with ET > 20 GeV accompanying theW boson. In the electron channel, this uncertainty is replaced by a data-driven uncertainty, as explained below.
The QCD multijet background in the dielectron sample is estimated from data using a “reversed electron identification” technique. Data with both electron candidates failing a subset of identification criteria (chosen not to affect kinematic distributions) are used to determine the QCD background dis- tribution versusmee. Contributions from other backgrounds are estimated from simulated samples and subtracted. An empirical function, f(x) = p1xp2+p3logx, fitted in the 110 - 800 GeV range, extrapo- lates the distribution to high mee. This QCD background shape and the sum of theZ/γ∗, diboson, t¯t andW+jets backgrounds are fitted to the observedmeedistribution in a control region to determine the
normalization of the QCD contribution. This method provides the central QCD multijet estimate, and two other techniques are used to assign a systematic uncertainty. One is another shape-fitting procedure, this time on two-dimensional (leading and sub-leading electron) isolation distributions in bins ofmee. A third independent data-driven QCD multijet estimate is based on fake rates computed from jet-enriched samples obtained from jet triggers or from the electromagnetic-cluster trigger used for the signal. These estimates are compatible with the central method. Since these alternative methods provide combined es- timates of the QCD andW+jets contributions, the central QCD multijet determination is summed with the Monte Carlo predictedW+jets yield for the comparison. The largest difference with the alternative methods is assigned as the global systematic uncertainty to the QCD plusW+jets yield in the dielectron channel.
The QCD background in the dimuon sample is evaluated from data using the reversed isolation method described in [45], based on the track isolation variableΣpT(∆R<0.3)/pT.
The QCD andW+jets backgrounds are small for the electron channel and very small for the muon channel. Backgrounds from cosmic rays are negligible.
5 Results
The observed invariant mass distributions are compared to the SM expectation, given by the Monte Carlo simulation for all components except QCD multijet, which is taken from the data. For this pur- pose, the Drell-Yan, t¯t, diboson and W + jets backgrounds from Monte Carlo simulation are scaled according to their respective cross sections and added to the data-driven QCD background. The sim- ulated backgrounds are then rescaled so that the sum matches the observed number of data events in the normalization region, defined as the 70 - 110 GeV mass interval. The scaling factor is within 1.6%
of unity. The number of events in the normalization region is 1237292 in the dielectron channel, and 985004 in the dimuon channel; the Drell-Yan component amounts to more than 99% of the total in both cases. The advantage of this approach is that the uncertainty on the integrated luminosity, and any mass-independent uncertainties on efficiencies, cancel between theZ0 (G∗) and theZboson in the limit computation presented below.
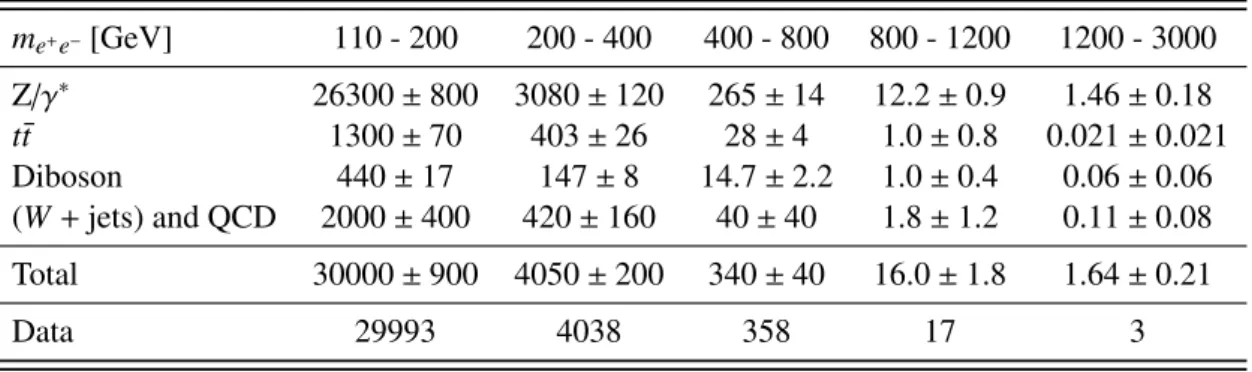
Table 1: The expected and observed numbers of events in the dielectron channel for variousmeebins.
The expected numbers are shown separately for each of the background components discussed in the text. The errors quoted include both statistical and systematic uncertainties.
me+e−[GeV] 110 - 200 200 - 400 400 - 800 800 - 1200 1200 - 3000 Z/γ∗ 26300±800 3080±120 265±14 12.2±0.9 1.46±0.18
t¯t 1300±70 403±26 28±4 1.0±0.8 0.021±0.021
Diboson 440±17 147±8 14.7±2.2 1.0±0.4 0.06±0.06
(W+jets) and QCD 2000±400 420±160 40±40 1.8±1.2 0.11±0.08 Total 30000±900 4050±200 340±40 16.0±1.8 1.64±0.21
Data 29993 4038 358 17 3
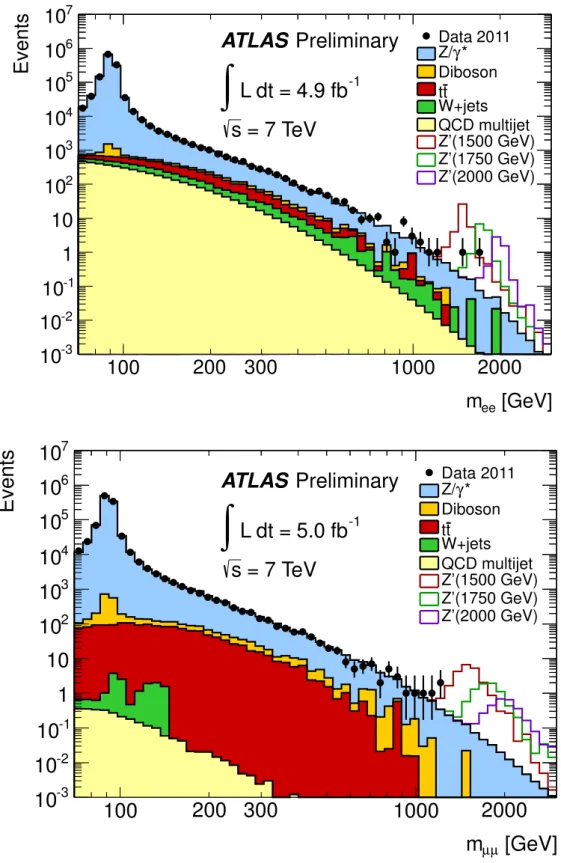
Figure 1 presents the invariant mass (m``) distribution for the dielectron (top) and dimuon (bottom) fi- nal states after final selection. Figure 1 also displays the expectedZSSM0 signal for three mass hypotheses.
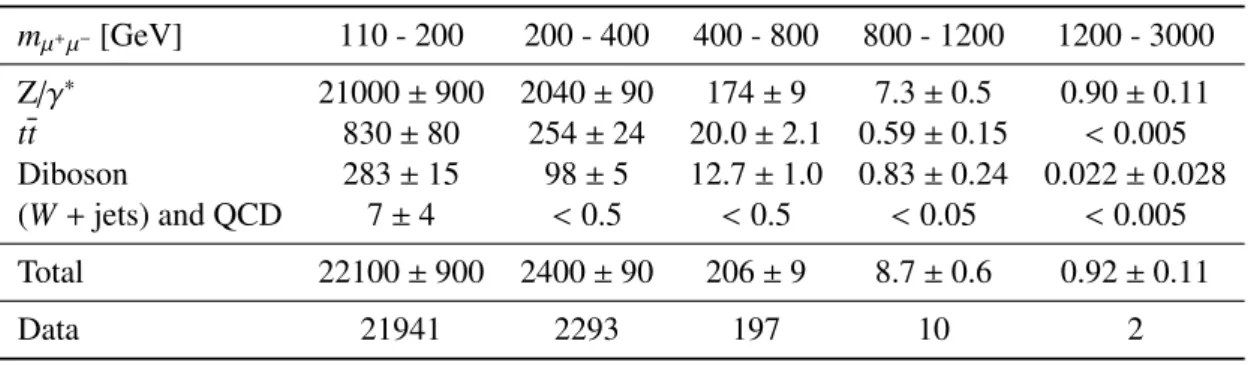
Tables 1 and 2 show the number of data events and the estimated backgrounds in bins of reconstructed dielectron and dimuon invariant mass above 110 GeV. The dilepton invariant mass distributions are well
Table 2: The expected and observed numbers of events in the dimuon channel for various mµ+µ− bins.
The expected numbers are shown separately for each of the background components discussed in the text. The errors quoted include both statistical and systematic uncertainties.
mµ+µ−[GeV] 110 - 200 200 - 400 400 - 800 800 - 1200 1200 - 3000 Z/γ∗ 21000±900 2040±90 174±9 7.3±0.5 0.90±0.11
tt 830±80 254±24 20.0±2.1 0.59±0.15 <0.005
Diboson 283±15 98±5 12.7±1.0 0.83±0.24 0.022±0.028 (W+jets) and QCD 7±4 <0.5 <0.5 <0.05 <0.005
Total 22100±900 2400±90 206±9 8.7±0.6 0.92±0.11
Data 21941 2293 197 10 2
described by the prediction from SM processes.
The invariant mass distribution of the data is compared to templates of the background and of signals with pole masses in the search region, which extends from 0.13 to 3.0 TeV [14, 45]. A likelihood function is defined as the product of the Poisson probabilities over all mass bins in the search region. The Poisson probability in each bin is evaluated for the observed number of data events given the background and signal template expectation. The total signal acceptance as a function of mass is propagated into the expectation, and systematic uncertainties are incorporated in the likelihood via nuisance parameters [46].
The significance of a signal is summarized by a p-value, the probability of observing an excess at least as signal-like as the one observed in data, in the absence of signal. The outcome of the search is ranked against pseudo-experiments using a likelihood ratio, which is scanned as a function ofZ0 cross section and mZ0 over the full considered mass range. The data are consistent with the SM hypothesis, with global p-values of 13% and 82% for the dielectron and dimuon channels respectively.
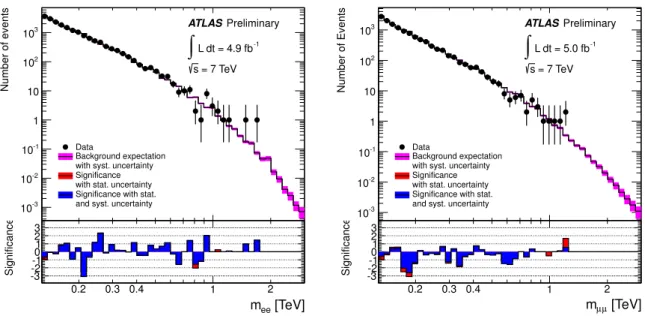
In addition, the agreement between data and expectation is studied by computing the significance of the difference in each mass bin, with statistical and systematic errors taken into account [47]; the result is displayed in Figure 2. The largest positive local significance is∼2.5σin the electron channel and less than 2σin the muon channel, and the largest negative significance is about−3σin both channels.
Given the absence of any significant signal, an upper limit on the number of signal events is deter- mined at the 95% confidence level (C.L.) using a Bayesian approach [46] with a flat, positive prior on the signal cross section.
6 Systematic uncertainties
Systematic uncertainties include the normalization to the Z-peak, PDF, QCD and electroweak correc- tions, as well as the trigger, reconstruction and identification efficiencies. For each source of uncertainty, the correlations across bins, as well as the correlations between signal and background, are taken into account.
Since the total background is normalized to the data in the region of theZ → `+`−mass peak, the residual systematic uncertainties (with the exception of the Z cross section uncertainty) are small at theZ pole and grow at higher mass. The dominant uncertainties are theoretical. The overall uncertainty due to PDF,αS, and scale variations is estimated to be 20% at 2 TeV, where the PDF contribution is dominant.
TheαS and PDF uncertainties are evaluated using the MSTW2008NNLO eigenvector PDF sets and the PDF sets corresponding to variations of αS, at the 90% C.L. The spread of the variations covers the
[GeV]
mee
100 200 300 1000 2000
Events
10-3
10-2
10-1
1 10 102
103
104
105
106
107
Preliminary ATLAS
L dt = 4.9 fb-1
∫
= 7 TeV s
Data 2011 γ*
Z/
Diboson t tW+jets QCD multijet Z’(1500 GeV) Z’(1750 GeV) Z’(2000 GeV)
[GeV]
µ
mµ
100 200 300 1000 2000
Events
10-3
10-2
10-1
1 10 102
103
104
105
106
107
Data 2011 γ*
Z/
Diboson t tW+jets QCD multijet Z’(1500 GeV) Z’(1750 GeV) Z’(2000 GeV)
Preliminary ATLAS
L dt = 5.0 fb-1
∫
= 7 TeV s
Figure 1: The dielectron (top) and dimuon (bottom) invariant mass (m``) distribution after final selection, compared to the stacked sum of all expected backgrounds, with three exampleZSSM0 signals overlaid. The bin width is constant in logm``.
Number of events
10-3
10-2
10-1
1 10 102
103
Data
Background expectation with syst. uncertainty Significance with stat. uncertainty Significance with stat.
and syst. uncertainty
Preliminary ATLAS
L dt = 4.9 fb-1
∫
= 7 TeV s
[TeV]
mee
0.2 0.3 0.4 1 2
Significance -3-2-10123
Number of Events
10-3
10-2
10-1
1 10 102
103
Data
Background expectation with syst. uncertainty Significance with stat. uncertainty Significance with stat.
and syst. uncertainty
Preliminary ATLAS
L dt = 5.0 fb-1
∫
= 7 TeV s
[TeV]
µ
mµ
0.2 0.3 0.4 1 2
Significance -3-2-10123
Figure 2: The dielectron (left) and dimuon (right) invariant mass (m``) distributions after final selection, compared to the expected background. The bin width is the same as in Figure 1. The bottom part of each histogram shows the significance of the difference between data and expectation in each bin.
difference between the central values obtained with the CTEQ and MSTW PDF sets. The scale uncer- tainties are estimated by varying the renormalization (µR) and factorization (µF) scales independently up and down by a factor of two, but with the constraint 0.5≤µF/µR≤2. The resulting maximum variations are taken as the uncertainties. Additionally, a systematic uncertainty of 4.5% is attributed to electroweak corrections [45].
The uncertainty on theZ/γ∗cross section is 5%, which is applied as a systematic uncertainty on the signal yield. It replaces the uncertainty on the integrated luminosity due to the normalization to the data under theZ→`+`−mass peak.
The experimental systematic effects due to resolution and inefficiencies at high mass were also stud- ied. The uncertainty on the energy resolution is measured to be negligible in the electron channel. In the muon channel, the uncertainty on the momentum resolution is due to residual misalignments and in- trinsic position uncertainties in the muon spectrometer that propagate to a change in the observed width of theZ0(G∗) line-shape. The simulation was adjusted to reproduce the data at high muon momentum.
The residual uncertainty translates into an event yield uncertainty of less than 3%. The combined uncer- tainty on the muon trigger and reconstruction efficiency is estimated to be 6% at 2 TeV. This uncertainty is dominated by a conservative estimate of the impact of large energy loss from muon bremsstrahlung in the calorimeter on the muon reconstruction performance in the muon spectrometer. In the electron channel, a systematic uncertainty of 2% at 2 TeV is estimated for a possible identification inefficiency caused by the isolation requirement.
The dominant systematic uncertainties are summarized in Table 3. Uncertainties of 3% and less are neglected in the limit setting procedure described below, and no theory uncertainties are applied to the Z0orG∗signal.
7 Interpretation
The limit on the number of produced Z0 (G∗) events is converted into a limit on cross section times branching fractionσBby scaling with the observed number ofZ boson events and the theoretical value
Table 3: Summary of systematic uncertainties on the expected numbers of events at m`+`− = 2 TeV.
NA indicates that the uncertainty is not applicable, and “-” denotes a negligible entry.
Source Dielectrons Dimuons
Signal Background Signal Background
Normalization 5% NA 5% NA
PDF/αs/scale NA 20% NA 20%
Electroweak corrections NA 4.5% NA 4.5%
Efficiency - - 6% 6%
W+jets and QCD background NA 3.5% NA -
Total 5% 21% 8% 21%
m [TeV]
0.5 1 1.5 2 2.5 3
B [pb]σ
10-4
10-3
10-2
10-1
1 Expected limit
σ
± 1 Expected
σ
± 2 Expected Observed limit Z’SSM
Z’χ
Z’ψ
Preliminary ATLAS
→ ee Z’
= 7 TeV s
L dt = 4.9 fb-1
∫
m [TeV]
0.5 1 1.5 2 2.5 3
B [pb]σ
10-4
10-3
10-2
10-1
1 Expected limit
σ
± 1 Expected
σ
± 2 Expected Observed limit
= 0.1 MPl
k/
= 0.05 MPl
k/
= 0.03 MPl
k/
= 0.01 MPl
k/
Preliminary ATLAS
→ ee G*
= 7 TeV s
L dt = 4.9 fb-1
∫
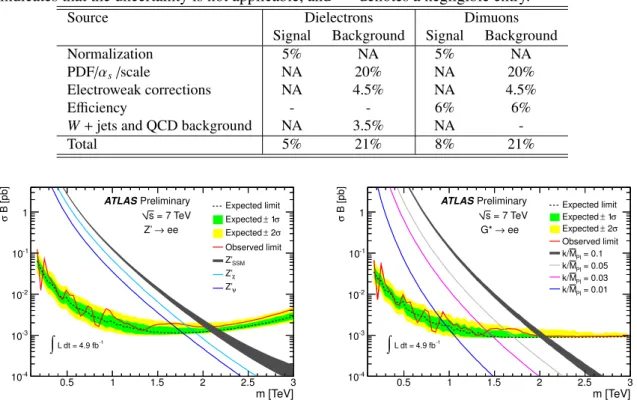
Figure 3: The expected and observed 95% C.L. upper limits onσBas a function of mass forZ0(left) and G∗(right) models for the electron channel. The thickness of the ZSSM0 (left) and theG∗fork/MPl=0.1 (right) theory curves illustrate the theoretical uncertainties.
ofσB(Z→ll). The expected exclusion limits are determined using pseudo-experiments containing only SM processes, by evaluating the 95% C.L. upper limits for each pseudo-experiment for each fixed value ofmZ0 (mG∗). The median of the distribution of limits represents the expected limit. The ensemble of limits is used to find the 68% and 95% envelopes of the expected limits as a function ofmZ0 (mG∗).
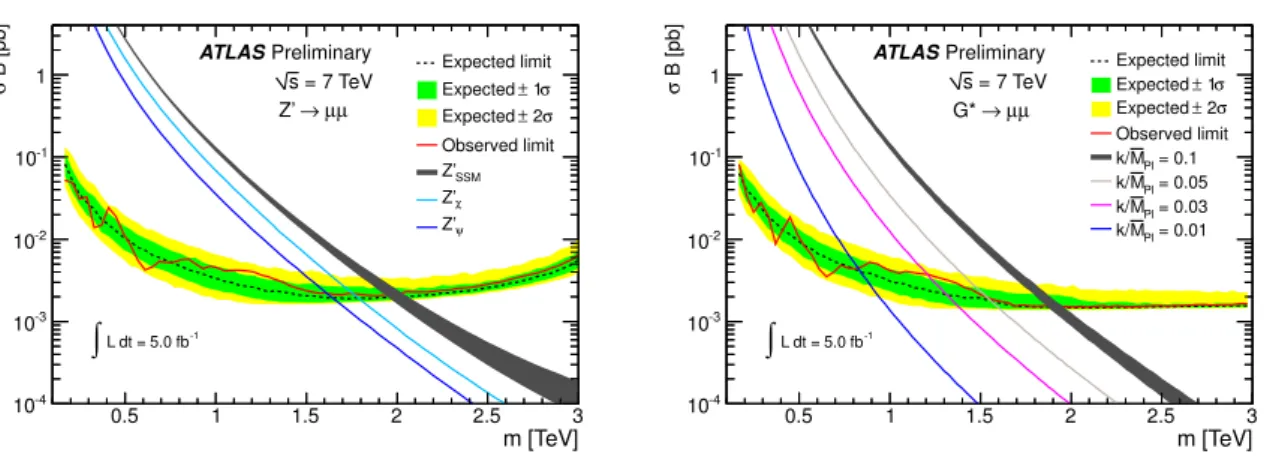
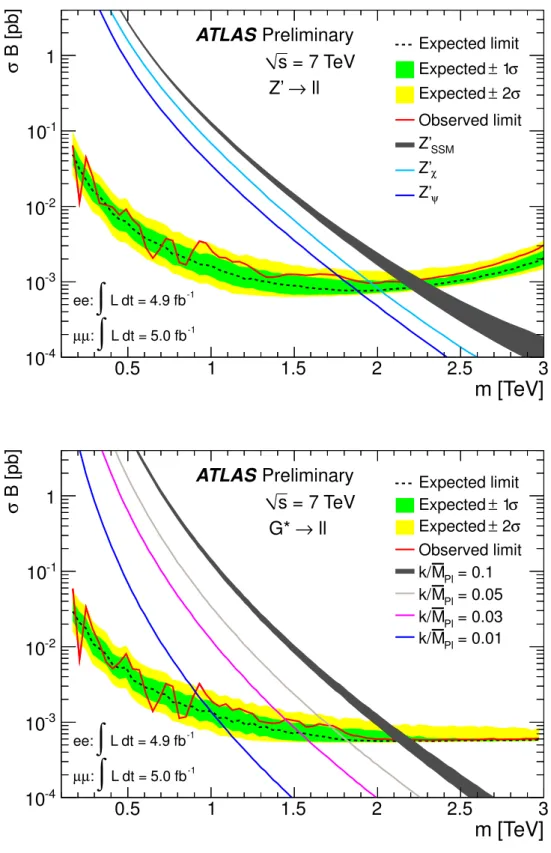
Figure 3 shows the 95% C.L. observed and expected exclusion limits onσB(Z0 → e+e−) and on σB(G∗→e+e−). It also shows the theoretical cross section times branching fraction for theZSSM0 and for E6-motivatedZ0models with the lowest and highestσB. The same information is shown in Figure 4 for the muon channel. Figure 5 shows the combined dielectron and dimuon 95% C.L. observed and expected exclusion limits onσB(Z0→ll) and onσB(G∗→ll).
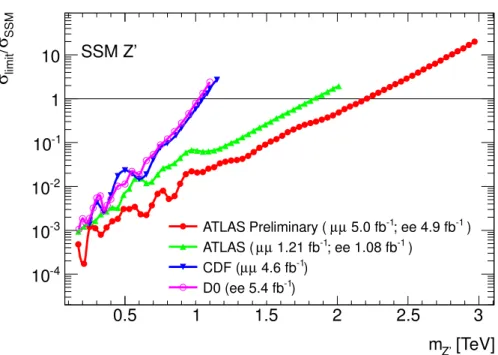
Figure 6 shows the ratio between the observed limit and the expected cross section times branch- ing fraction as a function of the Z0 mass for the SSM model, for previous results at the Tevatron and in ATLAS, together with the results presented here. Mass limits obtained for theZ0SSM andG∗ (with k/MPl=0.1) are displayed in Table 4. The combined mass limits on the E6-motivated models and theG∗ with various couplings are given in Table 5.
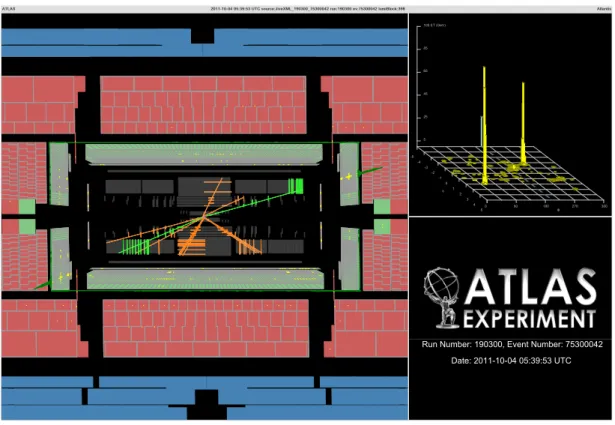
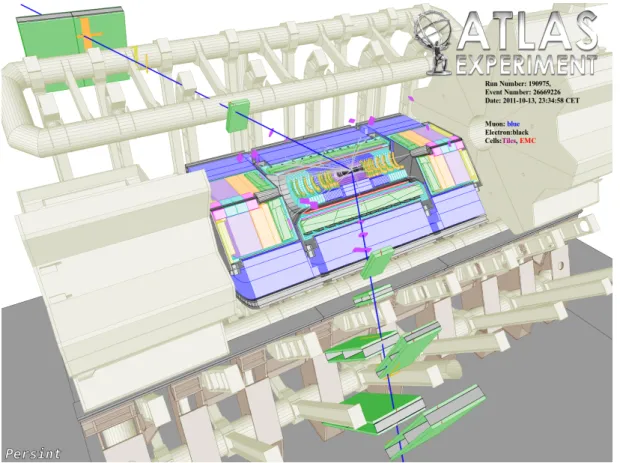
Figures 7 and 8 show event displays of the dielectron and dimuon candidates reconstructed with the highest invariant mass.
m [TeV]
0.5 1 1.5 2 2.5 3
B [pb]σ
10-4
10-3
10-2
10-1
1 Expected limit
σ
± 1 Expected
σ
± 2 Expected Observed limit Z’SSM
Z’χ
Z’ψ
Preliminary ATLAS
µ µ Z’ →
= 7 TeV s
L dt = 5.0 fb-1
∫
m [TeV]
0.5 1 1.5 2 2.5 3
B [pb]σ
10-4
10-3
10-2
10-1
1 Expected limit
σ
± 1 Expected
σ
± 2 Expected Observed limit
= 0.1 MPl
k/
= 0.05 MPl
k/
= 0.03 MPl
k/
= 0.01 MPl
k/
Preliminary ATLAS
µ µ G* →
= 7 TeV s
L dt = 5.0 fb-1
∫
Figure 4: The expected and observed 95% C.L. upper limits on σBas a function of mass for Z0 (left) andG∗(right) models for the muon channel. The thickness of theZSSM0 (left) and theG∗fork/MPl=0.1 (right) theory curves illustrate the theoretical uncertainties.
Table 4: The observed (expected) 95% C.L. mass lower limits in TeV onZ0SSMresonance andG∗graviton (withk/MPl=0.1), for the dielectron and dimuon channels separately and for their combination.
Model Mass limit [TeV]
e+e− µ+µ− `+`− ZSSM0 2.07 (2.14) 1.99 (2.01) 2.21 (2.26) G∗ 2.03 (2.05) 1.90 (1.92) 2.16 (2.17)
Table 5: The observed 95% C.L. lower limits on the masses of E6-motivatedZ0bosons and RS gravitons G∗for various values of the couplingk/MPl. Both lepton channels are combined.
E6 Z0 models RS graviton
Model/Coupling Zψ0 Z0N Zη0 ZI0 ZS0 Zχ0 0.01 0.03 0.05 0.1 Mass limit [TeV] 1.76 1.78 1.84 1.84 1.90 1.96 0.91 1.45 1.71 2.16
8 Conclusion
The ATLAS detector has been used to search for narrow, high-mass resonances in the dilepton invariant mass spectrum. Proton-proton collision data with integrated luminosities of 4.9 (5.0) fb−1 in the dielec- tron (dimuon) channel have been used. The observed invariant mass spectra are consistent with the SM expectations. Limits are set on the cross section times branching fractionσB. The resulting lower limits on the mass of a new resonance are 2.21 TeV for a Sequential Standard Model Z0, 1.76−1.96 TeV for various E6-motivatedZ0bosons and 0.91 TeV−2.16 TeV for a Randall-Sundrum graviton with couplings (k/MPl) in the range 0.01−0.1.
m [TeV]
0.5 1 1.5 2 2.5 3
B [pb]σ
10-4
10-3
10-2
10-1
1 Expected limit
σ
± 1 Expected
σ
± 2 Expected Observed limit
Z’SSM
Z’χ
Z’ψ
Preliminary ATLAS
→ ll Z’
= 7 TeV s
L dt = 5.0 fb-1
∫
µ: µ
L dt = 4.9 fb-1
∫
ee:
m [TeV]
0.5 1 1.5 2 2.5 3
B [pb]σ
10-4
10-3
10-2
10-1
1 Expected limit
σ
± 1 Expected
σ
± 2 Expected Observed limit
= 0.1 MPl
k/
= 0.05 MPl
k/
= 0.03 MPl
k/
= 0.01 MPl
k/
Preliminary ATLAS
→ ll G*
= 7 TeV s
L dt = 5.0 fb-1
∫
µ: µ
L dt = 4.9 fb-1
∫
ee:
Figure 5: The expected and observed 95% C.L. upper limits onσBas a function of mass forZ0 (top) andG∗ (bottom) models. Both results show the combination of the electron and muon channels. The thickness of the ZSSM0 (top) and theG∗ fork/MPl=0.1 (bottom) theory curves illustrate the theoretical uncertainties.
[TeV]
mZ’
0.5 1 1.5 2 2.5 3
SSMσ/ limitσ
10-4
10-3
10-2
10-1
1 10
-1 )
; ee 4.9 fb 5.0 fb-1
µ ATLAS Preliminary (µ
-1 )
; ee 1.08 fb 1.21 fb-1
µ ATLAS (µ
-1) 4.6 fb µ CDF (µ
-1) D0 (ee 5.4 fb
SSM Z’
Figure 6: The ratio between the observed limit and the predicted cross section times branching ratio as a function of theZ0 mass for the SSM model. The results are shown for the most recent limits from the Tevatron [13, 12], the latest ATLAS published data [14] and the analysis presented here. No uncertainties on the theoretical prediction are applied.
References
[1] ATLAS Collaboration,The ATLAS Experiment at the Large Hadron Collider, JINST3(2008) S08003.
[2] D. London and J. L. Rosner,Extra Gauge Bosons in E(6), Phys. Rev.D34(1986) 1530.
[3] P. Langacker,The Physics of Heavy Z0Gauge Bosons, Rev. Mod. Phys.81(2009) 1199–1228.
[4] J. Erler, P. Langacker, S. Munir, and E. R. Pena,Improved constraints on Z0bosons from electroweak precision data, JHEP0908(2009) 017.
[5] M. Chizhov, V. Bednyakov, and J. Budagov,Proposal for chiral-boson search at LHC via their unique new signature, Physics of Atomic Nuclei71(2008) 2096–2100.
[6] K. D. Lane and E. Eichten,Two Scale Technicolor, Phys. Lett.B222(1989) 274.
[7] K. Lane and S. Mrenna,Collider phenomenology of technihadrons in the technicolor straw man model, Phys. Rev.D67(2003) 115011.
[8] A. Belyaev et al.,Technicolor Walks at the LHC, Phys. Rev.D79(2009) 035006.
[9] L. Randall and R. Sundrum,A large mass hierarchy from a small extra dimension, Phys. Rev. Lett.
83(1999) 3370–3373.
[10] C. Hays, A. V. Kotwal, and O. Stelzer-Chilton,New Techniques in the Search for Z0Bosons and Other Neutral Resonances, Modern Physics LettersA24(2009) 2387, and references therein.
Figure 7: Event display for the dielectron candidate with the highest reconstructed invariant mass (mee=1.66 TeV). Both electrons are in the calorimeter end-caps; their tracks are shown in green. The electron with highest transverse energy has anETof 329 GeV and an (η,φ) of (2.00, 1.02). The sublead- ing electron has an ET of 217 GeV and an (η,φ) of (-1.60, -1.83). The event missing transverse energy is 26 GeV.
Figure 8: Event display for the dimuon candidate with the highest reconstructed invariant mass (mµµ=1.25 TeV). The muon with highest momentum has apT of 648 GeV and an (η,φ) of (-0.75, 0.49).
The subleading muon has apTof 583 GeV and an (η,φ) of (-0.36, -2.60). The event missing transverse energy is 67 GeV, with aφMET of -2.83.
[11] P. Langacker,Z’ Physics at the LHC, hep-ph/0911.4294 (2009) .
[12] D0 Collaboration,Search for a heavy neutral gauge boson in the dielectron channel with 5.4 fb−1 of pp collisions at¯ √
s=1.96TeV, Phys. Lett.B695(2011) 88–94.
[13] CDF Collaboration,Search for High Mass Resonances Decaying to Muon Pairs in √
s=1.96TeV pp Collisions, Phys. Rev. Lett.¯ 106(2011) 121801.
[14] ATLAS Collaboration,Search for dilepton resonances in pp collisions at √
s=7 TeV with the ATLAS detector, Phys. Rev. Lett.107(2011) 272002.
[15] CMS Collaboration,Search for Resonances in the Dilepton Mass Distribution in pp Collisions at
√s=7TeV, CMS-EXO-11-019, https://cdsweb.cern.ch/record/1369192/.
[16] OPAL Collaboration,Tests of the standard model and constraints on new physics from measurements of fermion pair production at 189 GeV to 209 GeV at LEP, Eur. Phys. J.C33 (2004) 173–212.
[17] DELPHI Collaboration,Measurement and interpretation of fermion-pair production at LEP energies above the Z resonance, Eur. Phys. J.C45(2006) 589–632.
[18] L3 Collaboration,Measurement of hadron and lepton-pair production in e+e−collisions at
√s=192GeV to 208 GeV at LEP, Eur. Phys. J.C47(2006) 1–19.
[19] ALEPH Collaboration,Fermion pair production in e+e−collisions at 189-209 GeV and constraints on physics beyond the standard model, Eur. Phys. J.C49(2007) 411–437.
[20] ATLAS Collaboration,Search for Extra Dimensions using diphoton events in 7 TeV proton-proton collisions with the ATLAS detector,arXiv:1112.2194 [hep-ex].
[21] CMS Collaboration,Search for Extra Dimensions in the Diphoton Final State at the Large Hadron Collider, CMS-EXO-11-038, http://cdsweb.cern.ch/record/1376706/.
[22] CDF Collaboration,Search for New Dielectron Resonances and Randall-Sundrum Gravitons at the Collider Detector at Fermilab, Phys. Rev. Lett.107(2011) 051801.
[23] D0 Collaboration,Search for Randall-Sundrum gravitons in the dielectron and diphoton final states with 5.4 fb−1of data from ppbar collisions at √
s=1.96TeV, Phys. Rev. Lett.104(2010) 241802.
[24] ATLAS Collaboration,Electron performance measurements with the ATLAS detector using the 2010 LHC proton-proton collision data,arXiv:1110.3174 [hep-ex].
[25] T. Sj¨ostrand, S. Mrenna, and P. Z. Skands,PYTHIA 6.4 Physics and Manual, JHEP0605(2006) 026.
[26] A. Sherstnev and R. S. Thorne,Parton Distributions for LO Generators, Eur. Phys. J.C55(2008) 553.
[27] G. Corcella et al.,HERWIG6: an event generator for hadron emission reactions with interfering gluons (including supersymmetric processes), JHEP0101(2001) 010.
[28] M. L. Mangano et al.,ALPGEN, a generator for hard multiparton processes in hadronic collisions, JHEP07(2003) 001.
[29] J. Pumplin et al.,New generation of parton distributions with uncertainties from global QCD analysis, JHEP0207(2002) 012.
[30] S. Frixione and B. R. Webber,Matching NLO QCD computations and parton shower simulations, JHEP0206(2002) 029.
[31] P. M. Nadolsky et al.,Implications of CTEQ global analysis for collider observables, Phys. Rev.
D78(2008) 013004.
[32] J. M. Butterworth, J. R. Forshaw, and M. H. Seymour,Multiparton interactions in photoproduction at HERA, Z. Phys.C72(1996) 637–646.
[33] P. Golonka and Z. Wa¸s,PHOTOS Monte Carlo: a precision tool for QED corrections in Z and W decays, Eur. Phys. J.C45(2006) 97–107.
[34] ATLAS Collaboration,The ATLAS Simulation Infrastructure, Eur. Phys. J.C70(2010) 823–874.
[35] GEANT4 Collaboration, S. Agostinelli et al.,GEANT4: A simulation toolkit, Nucl. Instrum. Meth.
A506(2003) 250.
[36] R. Hamberg, W. L. van Neerven, and T. Matsuura,A Complete calculation of the orderα2s
correction to the Drell-Yan K factor, Nucl. Phys.B359(1991) 343–405. Erratum-ibid.B644(2002) 403–404.
[37] A. Martin, W. Stirling, R. Thorne, and G. Watt,Parton Distributions for the LHC, Eur. Phys. J.
C63(2009) 189.
[38] M. C. Kumar, P. Mathews, and V. Ravindran - Private Communication.
[39] C. M. Carloni Calame, G. Montagna, O. Nicrosini, and A. Vicini,Precision electroweak calculation of the charged current Drell-Yan process, JHEP0612(2006) 016.
[40] C. M. Carloni Calame, G. Montagna, O. Nicrosini, and A. Vicini,Precision electroweak calculation of the production of a high transverse-momentum lepton pair at hadron colliders, JHEP0710(2007) 109.
[41] S. Moch and P. Uwer,Theoretical status and prospects for top-quark pair production at hadron colliders, Phys. Rev.D78(2008) 034003.
[42] U. Langenfeld, S. Moch, and P. Uwer,New results for t¯t production at hadron colliders, hep-ph/0907.2527 (2009) .
[43] J. M. Campbell and R. K. Ellis,An update on vector boson pair production at hadron colliders, Phys. Rev.D60(1999) 113006.
[44] K. Melnikov and F. Petriello,Electroweak gauge boson production at hadron colliders through O(α2s), Phys. Rev.D74(2006) 114017.
[45] ATLAS Collaboration,Search for high mass dilepton resonances in pp collisions at √
s=7 TeV with the ATLAS experiment, Phys. Lett.B700(2011) 163–180.
[46] A. Caldwell, D. Kollar, and K. Kr¨oninger,BAT - The Bayesian Analysis Toolkit, Comput. Phys. Commun.180(2009) 2197.
[47] G. Choudalakis and D. Casadei,Plotting the Differences Between Data and Expectation, arXiv:1111.2062 [physics.data-an].