ATLAS-CONF-2013-023 11March2013
ATLAS NOTE
ATLAS-CONF-2013-023
Dynamics of isolated-photon and jet production in pp collisions at √
s = 7 TeV with the ATLAS detector
The ATLAS Collaboration
Abstract
The dynamics of isolated-photon plus jet production in pp collisions at a centre-of-mass energy of 7 TeV has been studied with the ATLAS detector at the LHC using an integrated luminosity of 37 pb
−1. Measurements of isolated-photon plus jet differential cross sections are presented as functions of photon transverse energy, jet transverse momentum and jet rapidity. In addition, the differential cross sections as functions of the difference in azimuthal angle between the photon and the jet, the photon-jet invariant mass and the scattering angle in the photon-jet centre-of-mass frame have been measured. Next-to-leading-order QCD calculations are compared to the measurements and provide a good description of the data, except in the case of the azimuthal angle.
c Copyright 2013 CERN for the benefit of the ATLAS Collaboration.
Reproduction of this article or parts of it is allowed as specified in the CC-BY-3.0 license.
1 Introduction
The production of prompt photons in association with a jet in proton-proton collisions, pp
→γ
+jet
+X, provides a testing ground for perturbative QCD (pQCD) in a cleaner environment than jet production since the photon originates directly from the hard interaction and does not undergo hadronisation. In particular, measurements of angular correlations between the photon and the jet can be used to understand the dynamics of the hard-scattering process. The dominant production mechanism in pp collisions at the LHC is through the qg
→qγ process. Thus, measurements of prompt-photon plus jet production can help to constrain the gluon density in the proton [1, 2]. In addition, these events constitute one of the main backgrounds in searches for Higgs bosons decaying to a photon pair; therefore, precise measurements of photon plus jet production are useful to tune the description of this process in Monte Carlo (MC) models.
The dynamics of the underlying processes in 2
→2 hard collinear scattering can be investigated using the variable θ
∗, cos θ
∗ ≡tanh(∆y/2), where
∆yis the difference in rapidity of the two final-state particles, which coincides with the scattering angle in the centre-of-mass frame and whose distribution is sensitive to the spin of the exchanged particle. The dominant subprocess for dijet events in pp collisions at the LHC proceeds via t-channel gluon exchange and so the differential cross section behaves as (1
−|
cos θ
∗|)
−2when
|cos θ
∗| →1. In contrast, processes which proceed predominantly via t-channel quark exchange are expected to have an asymptotic (1
− |cos θ
∗|)
−1behaviour. This fundamental prediction of QCD can be tested in photon plus jet production at the large centre-of-mass energies available at the LHC.
At leading order (LO) in pQCD, the process pp
→γ
+jet
+X proceeds via two production mecha- nisms: direct photons (DP), which originate from the hard process, and fragmentation photons (F), which arise from the fragmentation of a coloured high transverse momentum, P
T, parton [3, 4]. The direct- photon contribution is expected to exhibit a (1
− |cos θ
∗|)
−1dependence when
|cos θ
∗| →1, whereas that of fragmentation processes is predicted to be the same as in dijet production, namely (1
−|cos θ
∗|)
−2. As a result, a measurement of the cross section for isolated-photon plus jet production as a function of
|cos θ
∗|provides a handle on the relative contributions of the direct-photon and fragmentation components as well as the possibility to test the dominance of t-channel quark exchange.
The production of inclusive isolated photons in pp collisions has been studied previously by AT- LAS [5, 6] and CMS [7, 8]. Recently, the differential cross sections for isolated photons in association with jets as functions of the photon transverse energy in different regions of rapidity of the leading- transverse momentum jet was published [9]. The analysis presented in this paper is based on the same data sample and similar selection criteria as in the previous publication, but extends the study by mea- suring also cross sections in terms of the leading-jet and photon-plus-jet properties. The goal of the analysis presented here is to study the kinematics and dynamics of the isolated-photon plus jet system by measuring the differential cross sections as functions of the leading-photon transverse energy
1(E
γT), the leading-jet transverse momentum (P
jetT) and rapidity (y
jet), the difference in azimuthal angle between the photon and the jet (∆φ
γj), the photon-jet invariant mass (M
γj) and cos θ
γj, where the variable θ
∗is referred to as θ
γjhere and henceforth. The photon was required to be isolated by using the same isolation criterion as in previous measurements [5, 6, 9]; it was based on the amount of transverse energy inside a cone of radius
p(η
−η
γ)
2+(φ
−φ
γ)
2 =0.4 centred around the photon direction (defined by η
γand φ
γ). The jets were defined using the anti-k
tjet algorithm [10] with distance parameter R
=0.6. The measurements were performed in the phase-space region of E
γT> 45 GeV,
|η
γ|< 2.37 (excluding the
1The ATLAS reference system is a Cartesian right-handed coordinate system, with the nominal collision point at the origin.
The anticlockwise beam direction defines the positive z-axis, while the positive x-axis is defined as pointing from the collision point to the centre of the LHC ring and the positivey-axis points upwards. The azimuthal angleφis measured around the beam axis, and the polar angleθis measured with respect to the z-axis. Pseudorapidity is defined asη=−ln tan(θ/2), and transverse energy is defined as ET =E sinθ.
region of 1.37 <
|η
γ|< 1.52), P
jetT> 40 GeV,
|y
jet|< 2.37 and
∆R2γj =(η
γ−η
jet)
2+(φ
γ−φ
jet)
2> 1. The measurements of dσ/dM
γjand dσ/d
|cos θ
γj|were performed for
|η
γ+y
jet|/2 < 1.185,
|cos θ
γj|< 0.83 and M
γj> 161 GeV; these additional requirements select a region where the M
γjand
|cos θ
γj|distribu- tions are not distorted by the restrictions on the transverse momenta and rapidities of the photon and the jet. Next-to-leading-order (NLO) QCD calculations were compared to the measurements.
The
|cos θ
∗|distribution in the di-photon channel has been used [11] to study the spin of the new
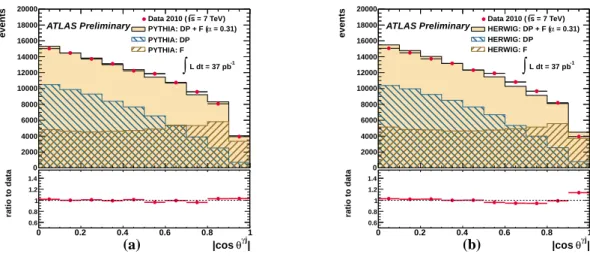
“Higgs-like” particle observed by ATLAS [12] and CMS [13]. To aid in better constraining the contribu- tions of direct-photon and fragmentation processes in the MC models, a measurement of the differential cross section as a function of
|cos θ
γj|was also performed without the restrictions on M
γjor on
|η
γ+y
jet|. Predictions from both leading-logarithm plus parton-shower MC models and NLO QCD calculations were compared to this measurement.
2 The ATLAS detector
The ATLAS experiment [14] is a multipurpose particle physics detector with a forward-backward sym- metric cylindrical geometry and nearly 4π coverage in solid angle.
The inner tracking detector covers the pseudorapidity range
|η
|< 2.5, and consists of a silicon pixel detector, a silicon microstrip detector and, for
|η
|< 2.0, a transition radiation tracker. The inner detector is surrounded by a thin superconducting solenoid providing a 2 T magnetic field.
The electromagnetic calorimeter is a lead liquid-argon sampling calorimeter. It is divided into a barrel section, covering the pseudorapidity region
|η
|< 1.475, and two end-cap sections, covering the pseudorapidity regions 1.375 <
|η
|< 3.2. It consists of three longitudinal layers in most of the pseudo- rapidity range. The first layer is segmented into high granularity strips in the η direction (width between 0.003 and 0.006 depending on η, with the exception of the regions 1.4 <
|η
|< 1.5 and
|η
|> 2.4), provid- ing event-by-event discrimination between single-photon showers and two overlapping showers coming from, for example, a π
0decay. The second layer of the electromagnetic calorimeter, which collects most of the energy deposited in the calorimeter by the photon shower, has a cell granularity of 0.025
×0.025 in η
×φ. A third layer collects the tails of the electromagnetic showers and provides an additional point to reconstruct the shower barycentre. In front of the calorimeter a thin presampler layer, covering the pseu- dorapidity interval
|η
|< 1.8, is used to correct for energy loss before the calorimeter. The electromagnetic energy scale is calibrated using Z
→ee events with an uncertainty better than 1% [15].
A hadronic sampling calorimeter is located outside the electromagnetic calorimeter. It is made of scintillating tiles and steel in the barrel section (
|η
|< 1.7) and of two end-caps of copper and liquid argon (1.5 <
|η
|< 3.2). The forward region (3.1 <
|η
|< 4.9) is instrumented with a copper/tungsten liquid-argon calorimeter for both electromagnetic and hadronic measurements.
Events containing photon candidates were selected by a three-level trigger system. The first level trigger (level-1) is hardware based and uses a trigger cell granularity of 0.1
×0.1 in η
×φ. The algorithms of the second and third level triggers are implemented in software and exploit the full granularity and precision of the calorimeter to refine the level-1 trigger selection, based on improved energy resolution and detailed information on energy deposition in the calorimeter cells.
3 Data selection
The data used in the analysis presented here were collected with the ATLAS detector during the proton- proton collision running period of 2010, when the LHC operated at a centre-of-mass energy of
√s
=7 TeV. This data set was chosen to study the dynamics of isolated-photon plus jet production at relatively low E
Tγ, down to E
Tγ =45 GeV.
2
Only events taken in stable beam conditions and passing detector and data-quality requirements were considered. Events were recorded using a single-photon trigger, with a nominal transverse energy threshold of 40 GeV; this trigger was used to collect events in which the photon transverse energy, after reconstruction and calibration, is greater than 45 GeV. The total integrated luminosity of the collected sample amounts to 37.1
±1.3 pb
−1[16].
The selection criteria applied by the trigger on shower-shape variables computed from the energy profiles of the showers in the calorimeters are looser than the photon identification criteria applied in the offline analysis; for isolated photons with E
Tγ> 43 GeV and pseudorapidity
|η
γ|< 2.37, the trigger efficiency is close to 100%.
The sample of isolated-photon plus jet events was selected offline using similar criteria to those reported in the previous publication [9]. The selection criteria applied are described below.
Events were required to have a reconstructed primary vertex, with at least five associated tracks, consistent with the average beam-spot position. This requirement reduced non-collision backgrounds.
The effect of this requirement on the signal was found to be negligible. The remaining amount of non- collision backgrounds was estimated to be less than 0.1%.
During the 2010 data-taking period, there were on average 2
−3 proton-proton interactions per bunch crossing. The effects of the additional pp interactions (pile-up) on the photon isolation and jet recon- struction are described below.
3.1 Photon selection
The photon-candidate selection is based on the reconstruction of isolated electromagnetic clusters in the calorimeter with transverse energies exceeding 2.5 GeV, measured in projective towers in η
×φ in the sec- ond layer of the calorimeter. Clusters matched with tracks, reconstructed in the inner detector and extrap- olated to the calorimeter, were classified as electron candidates, whereas those without matching tracks were classified as unconverted photon candidates. To recover photon conversions, clusters matched to pairs of tracks originating from reconstructed conversion vertices in the inner detector or to single tracks with no hit in the innermost layer of the pixel detector were classified as converted photon can- didates [17]. The overall reconstruction efficiency for unconverted (converted) photons with transverse energy above 20 GeV and pseudorapidity in the range
|η
|< 2.37, excluding the region 1.37 <
|η
|< 1.52, was estimated to be 99.8 (94.3)% [17]. The final energy measurement, for both converted and un- converted photons, was made using only the calorimeter, with a cluster size depending on the photon classification. In the barrel, a cluster corresponding to 3
×5 (η
×φ) cells in the second layer was used for unconverted photons, while a cluster of 3
×7 (η
×φ) cells was used for converted photon candi- dates to compensate for the opening angle between the conversion products in the φ direction due to the magnetic field. In the end-cap, a cluster size of 5
×5 was used for all candidates. A dedicated energy calibration [18] was then applied separately for converted and unconverted photon candidates to account for upstream energy loss and both lateral and longitudinal leakage. Photons reconstructed near regions of the calorimeter affected by readout or high-voltage failures were rejected, eliminating around 5% of the selected candidates.
Events with at least one photon candidate with calibrated E
γT> 45 GeV and
|η
γ|< 2.37 were selected.
The candidate was excluded if 1.37 <
|η
γ|< 1.52. The same shower-shape and isolation requirements ex- plained in previous publications [5, 6, 9] were applied to the candidates; these requirements are referred to as “tight” identification criteria. The selection criteria on the shower-shape variables are independent of the photon-candidate transverse energy, but vary as a function of the photon pseudorapidity, to take into account variations in the total thickness of the upstream material and in the calorimeter geometry.
They are optimised independently for unconverted and converted photons to account for the different
developments of the showers in each case. The application of these selection criteria suppresses back-
ground from jets misidentified as photons.
The photon candidate was required to be isolated by restricting the amount of transverse energy around its direction. The transverse energy deposited in the calorimeters inside a cone of radius R
=0.4 centred around the photon direction is denoted by E
T,detiso. The contributions from the calorimeter cells in the window corresponding to 5
×7 cells in the second layer of the electromagnetic calorimeter around the photon barycentre are not included in the sum. The mean value of the small leakage of the photon energy outside this region, evaluated as a function of the photon transverse energy, was subtracted from the measured value of E
isoT,det. The typical size of this correction is a few percent of the photon transverse energy. The measured value of E
isoT,detwas further corrected by subtracting the estimated contributions from the underlying event and additional inelastic pp interactions. This correction was computed on an event-by-event basis and amounted on average to 900 MeV [6]. After all these corrections, E
isoT,detwas required to be below 3 GeV for a photon to be considered isolated.
The relative contribution to the total cross section from fragmentation processes decreases after the application of this requirement, though it remains non-negligible especially at low transverse energies.
The isolation requirement significantly reduces the main background, which consists of QCD multijet events where one jet typically contains a π
0or η meson which carries most of the jet energy and is misidentified as an isolated photon because it decays into a photon pair.
A small fraction of events contain more than one photon candidate passing the selection criteria. In such events, the highest-E
γT(leading) photon was kept for further study.
3.2 Jet selection
Jets were reconstructed from three-dimensional topological clusters built from calorimeter cells, using the anti-k
talgorithm with distance parameter R
=0.6. The jet four-momenta were computed from the sum of the jet constituent four-momenta, treating each as a (E, ~ p) four-vector with zero mass. The jet four-momenta were then recalibrated using a jet energy-scale (JES) correction as described previ- ously [19]. This calibration procedure corrected the jets for instrumental effects, such as inactive material and noncompensation, as well as for the additional energy due to multiple pp interactions within the same bunch crossing. The uncertainty on the JES in the central (forward) region,
|η
|< 0.8 (2.1 <
|η
|< 2.8), is lower than 4.6% (6.5%) for all jets with transverse momentum P
T> 20 GeV and less than 2.5% (3%) for jets with 60 < P
T< 800 GeV.
Jets reconstructed from calorimeter signals not originating from a pp collision were rejected by applying jet-quality criteria [19]. These criteria suppressed fake jets from calorimeter noise, cosmic rays and beam-related backgrounds. The jets were required to have calibrated transverse momenta greater than 40 GeV. Jets overlapping with the candidate photon or with an isolated electron were not considered;
if the jet axis lay within a cone of radius R
=1 (0.3) around the leading-photon (isolated electron) candidate, the jet was discarded. The requirement on the electrons suppresses contamination from W/Z plus jet events. In events with multiple jets satisfying the above requirements, the jet with highest P
jetT(leading jet) was retained for further study. The leading-jet rapidity was required to be in the region
|
y
jet|< 2.37.
3.3 Final photon plus jet sample
The number of data events selected using the requirements listed above amounts to approximately 124 000. The fraction of events with multiple photons fulfilling the above conditions is 3
·10
−4. The av- erage jet multiplicity in the data is 1.19. The signal MC (see Section 4) predictions for the jet multiplicity are 1.21 in P
[20] and 1.19 in H
[21].
For the measurements of the differential cross sections as functions of M
γjand
|cos θ
γj|, additional cuts were imposed to remove the bias due to the rapidity and transverse-momentum cuts on the photon
4
and the jet. To remove this bias, the cuts
|η
γ+y
jet|/2 < 1.185,
|cos θ
γj|< 0.83 and M
γj> 161 GeV were imposed. The number of events selected in the data after these additional cuts is approximately 26 000.
The contamination from pile-up jets in the selected samples was estimated to be negligible, which is consistent with the low pile-up conditions of the 2010 data-taking period.
4 Monte Carlo simulations
Samples of MC events were generated to study the characteristics of signal and background. The MC samples were also used to determine the response of the detector to jets of hadrons and the correction factors necessary to obtain the hadron-level cross sections. In addition, these samples were used to estimate hadronisation corrections to the NLO QCD calculations.
The MC programs P
6.423 [20] and H
6.510 [21] were used to generate the signal events.
In both generators, the partonic processes are simulated using leading-order matrix elements, with the inclusion of initial- and final-state parton showers. Fragmentation into hadrons was performed using the Lund string model [22] in the case of P
and the cluster model [23] in the case of H
. The mod- ified leading-order MRST2007 [24, 25] parton distribution functions (PDFs) were used to parameterise the proton structure. Both samples include a simulation of the underlying event, via the multiple-parton interaction model in the case of P
and via the J
package [26] in the case of H
. The event-generator parameters, including those of the underlying-event modelling, were set according to the AMBT1 [27] and AUET1 [28] tunes for P
and H
, respectively. All the samples of generated events were passed through the G
4 based [29] ATLAS detector-simulation programs [30]. They were reconstructed and analysed by the same program chain as the data.
For simulating the signal, the P
program includes leading-order photon plus jet events from both direct processes (the hard subprocesses qg
→qγ and q ¯q
→gγ) and photon bremsstrahlung in QCD dijet events, which can be generated simultaneously. On the other hand, the H
signal sample was obtained from the cross section-weighted mixture of samples containing only direct-photon plus jet or only bremsstrahlung-photon plus jet events, since these processes cannot be generated simultaneously.
The QCD background was simulated by using all tree-level 2
→2 QCD processes and removing photon plus jet events from photon bremsstrahlung. The background from diphoton events was estimated using P
MC samples, by computing the ratio between diphoton and isolated-photon plus jet events, and found to be negligible [9].
Particle-level jets in the MC simulation were identified using the anti-k
tjet algorithm and were built from stable particles, which are defined as those with a proper lifetime longer than 10 ps. This definition includes muons and neutrinos from decaying hadrons. The particle-level isolation requirement on the photon was applied to the transverse energy of all stable particles in a cone of radius R
=0.4 around the photon direction after the contribution from the underlying event was subtracted; in this case, the same underlying-event subtraction procedure used on data was applied at the particle level. The isolation transverse energy at particle level is denoted by E
T,partiso. The measured differential cross sections refer to particle-level jets and photons which are isolated by requiring E
isoT,part< 4 GeV [5].
5 Signal extraction
5.1 Background subtraction and signal-yield estimation
A non-negligible background contribution remains in the selected sample, even after the application of
the tight identification and isolation requirements. This background comes predominantly from QCD
processes, in which a jet is misidentified as a photon. This jet usually contains a light neutral meson,
mainly a π
0that decays into two collimated photons, which carries most of the jet energy. Tiny contri- butions from diphoton and W/Z plus jet events are also expected.
A background-subtraction method was devised, which does not rely on MC background samples and uses instead signal-depleted control regions to obtain a purer photon signal. The background contamina- tion in the selected sample was estimated using the same two-dimensional sideband technique as in the previous analyses [5, 6, 9] and then subtracted bin-by-bin from the observed yield. In this method, the photon was classified as:
•
“isolated”, if E
isoT,det< 3 GeV;
•
“non-isolated”, if E
isoT,det> 5 GeV;
•
“tight”, if it passed the tight photon identification criteria;
•
“non-tight”, if it failed at least one of the tight requirements on the shower-shape variables com- puted from the energy deposits in the first layer of the electromagnetic calorimeter, but passed all the other tight identification criteria.
In the two-dimensional plane formed by the photon transverse isolation energy and the photon tight identification variable, four regions were defined:
•
A: the “signal” region, containing tight and isolated photon candidates;
•
B: the “non-isolated” background control region, containing tight and non-isolated photon candi- dates;
•
C: the “non-identified” background control region, containing isolated and non-tight photon can- didates;
•
D: the background control region containing non-isolated and non-tight photon candidates.
The signal yield in region A, N
Asig, was estimated by using the relation N
Asig=N
A−R
bg·(N
B−ǫ
BN
sigA)
·(N
C−ǫ
CN
sigA)
(N
D−ǫ
DN
sigA)
, (1)
where N
K, with K
=A, B, C, D, is the number of observed events in each region of the two-dimensional plane defined above and
R
bg=N
bgA ·N
bgDN
bgB ·N
Cbgis the so-called background correlation and was taken as R
bg =1 for the nominal results; N
Kbgwith K
=A, B, C, D is the number of background events in each region. Equation 1 takes into account the expected number of signal events in the three background control regions via the signal leakage fractions, ǫ
K =N
sigK/N
Asigwith K
=B, C, D, which were extracted from the MC simulations of the signal.
Equation 1 leads to a second-order polynomial equation in N
sigAthat has only one physical (N
sigA> 0) solution.
This method was found to return signal yields consistent with the generated ones using a cross section-weighted combination of simulated signal and background samples. The only hypothesis un- derlying Eq. 1 is that the isolation and identification variables are uncorrelated in background events, thus R
bg =1. This assumption was verified both in background simulated samples and in data in the
6
background-dominated region of E
isoT,det> 10 GeV. Deviations with respect to unity were taken as sys- tematic uncertainties (see Section 7).
The signal purity, computed as N
Asig/N
A, is above approximately 0.9 and is very similar whether P
or H
is used to extract the signal leakage fractions. The signal purity increases as E
γT, P
jetTand M
γjincrease, is approximately constant as a function of
|y
jet|and
∆φγjand decreases as
|cos θ
γj|increases.
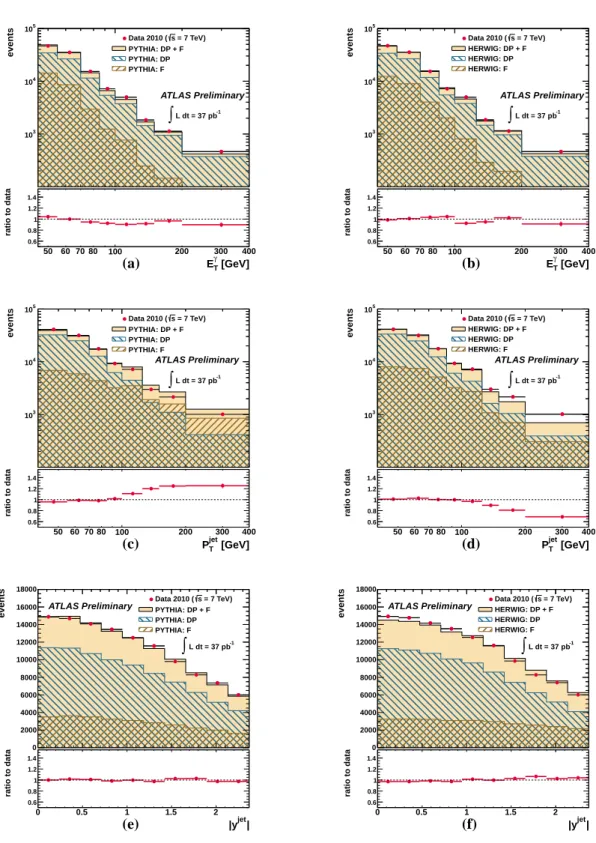
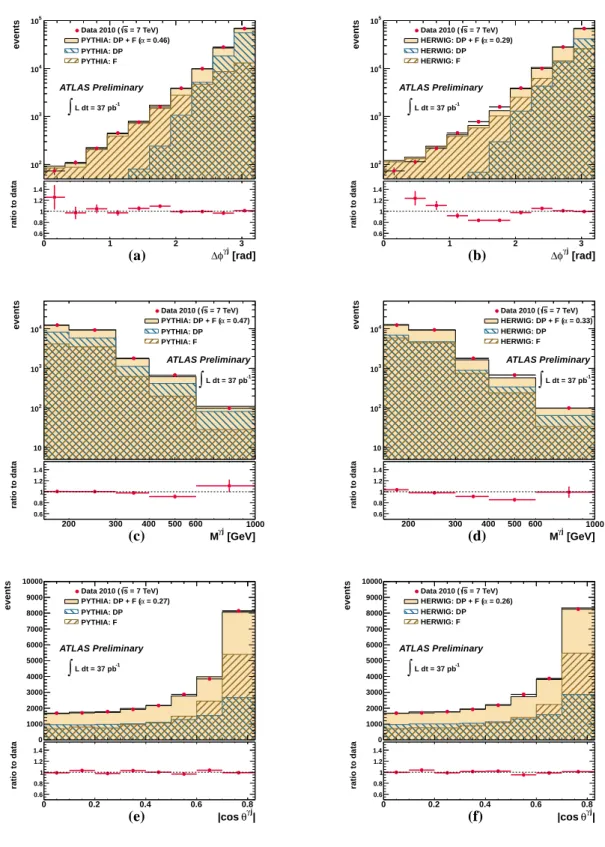
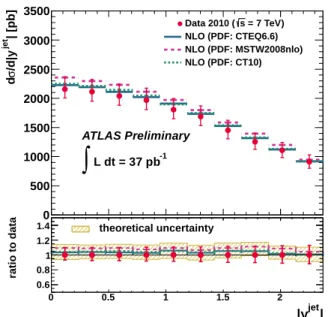
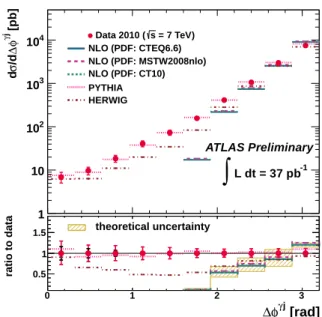
The signal yield in data and the predictions of the signal MC were compared for the seven observables studied (see Figs. 1 to 3). Both P
and H
give an adequate description of the E
γT,
|y
jet|and M
γjdata distributions. The measured P
jetTdistribution is described well for P
jetT .100 GeV; for P
jetT &100 GeV, the simulation of P
(H
) has a tendency to be somewhat above (below) the data.
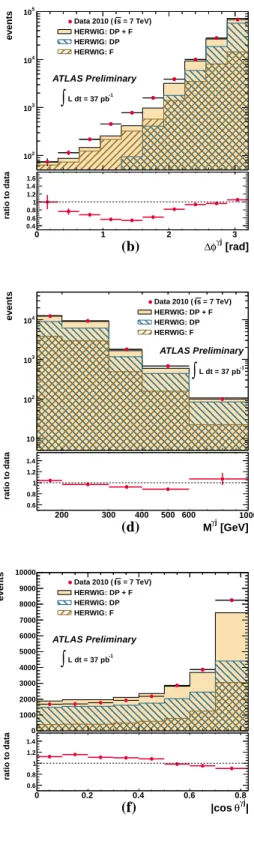
The simulation of P
provides an adequate description of the
∆φγjdata distribution, whereas H
fails. The
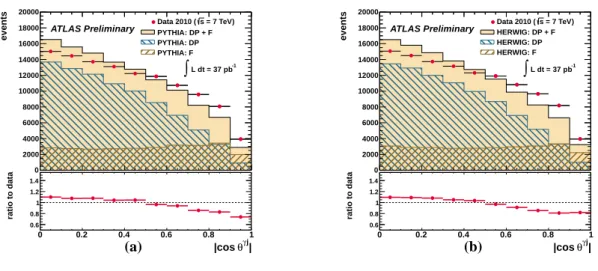
|cos θ
γj|data distribution, including or not additional cuts on M
γjor
|η
γ+y
jet|, is not adequately described by either P
or H
.
For most of these distributions, the shapes of the direct-photon and fragmentation components in the signal MC are somewhat different. Therefore, the shape of the MC distributions depends on the relative fraction of the two contributions. To obtain an improved description of the data by the leading-order plus parton-shower MC samples, a χ
2fit to each data distribution
2was performed with the relative weight of the direct-photon contribution, α, as the free parameter. The value of α
=0.5 was chosen to represent the default admixture used in the MC simulations; the relative weight of the fragmentation contribution was given by 1
−α. The fitted values of α are found to be different for each observable. It should be noted that α does not represent a physical observable and that it is used solely for the purpose of improving the description of the data by the LO simulations. Nevertheless, an observable-dependent α might approximate the effects of higher-order terms
3.
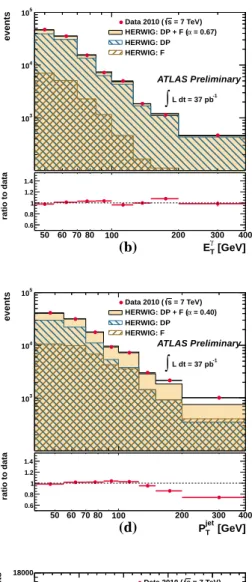
After adjusting the fractions of the DP and F components, a good description of the data was obtained by both the P
and H
MC simulations for all the observables (see Figs. 4 to 6), though the description of H
for
∆φγjand P
jetTis still somewhat poor. The MC simulations using the optimised admixture for each observable were used as the baseline for the determination of the measured cross sections (see Section 6).
To be consistent, the optimisation of the admixture of the two components should be done simultane- ously with the background subtraction since the signal leakage fractions ǫ
Kalso depend on the admixture.
However, such a procedure would result in an estimated signal yield which would depend on the fitted variable. To obtain a signal yield independent of the observable, except for statistical fluctuations, the background subtraction was performed using the default admixture of the two components and a system- atic uncertainty on the background subtraction due to this admixture was included (see Section 7).
5.2 Signal e ffi ciency
The combined signal trigger, reconstruction and selection efficiency was evaluated from the simulated signal samples described in Section 4. The integrated efficiency was computed as ε
= NNdet,partpart, where N
det,partis the number of MC events that pass all the selection requirements both at the detector and particle levels and N
partis the number of MC events that pass the selection requirements at the particle level. The integrated efficiency was found to be 68.5 (67.9)% from the P
(H
) samples. The
2For the distribution ofyjet, the result of the fit to that of PjetT was used.
3In Pand H, the two components are simulated to LO. The NLO QCD radiative corrections are expected to affect them differently and, furthermore, to entangle them, making any distinction physically impossible. In fact, a variation was observed in the application of the same procedure at parton level: the optimal value ofαresulting from a fit of the parton- level predictions of the two components in either Por Hto the NLO QCD calculations (see Section 8) depends on the observable.
[GeV]
γ
ET
events
103 104 105
ATLAS Preliminary L dt = 37 pb-1
∫
= 7 TeV) s Data 2010 ( PYTHIA: DP + F PYTHIA: DP PYTHIA: F
[GeV]
γ
ET
50 60 70 80 100 200 300 400
ratio to data
0.6 0.8 1 1.2 1.4
[GeV]
γ
ET
events
103 104 105
ATLAS Preliminary L dt = 37 pb-1
∫
= 7 TeV) s Data 2010 ( HERWIG: DP + F HERWIG: DP HERWIG: F
[GeV]
γ
ET
50 60 70 80 100 200 300 400
ratio to data
0.6 0.8 1 1.2 1.4
[GeV]
jet
PT
events
103 104 105
ATLAS Preliminary L dt = 37 pb-1
∫
= 7 TeV) s Data 2010 ( PYTHIA: DP + F PYTHIA: DP PYTHIA: F
[GeV]
jet
PT
50 60 70 80 100 200 300 400
ratio to data
0.6 0.8 1 1.2 1.4
[GeV]
jet
PT
events
103 104 105
ATLAS Preliminary L dt = 37 pb-1
∫
= 7 TeV) s Data 2010 ( HERWIG: DP + F HERWIG: DP HERWIG: F
[GeV]
jet
PT
50 60 70 80 100 200 300 400
ratio to data
0.6 0.8 1 1.2 1.4
jet|
|y
events
0 2000 4000 6000 8000 10000 12000 14000 16000 18000
ATLAS Preliminary
L dt = 37 pb-1
∫
= 7 TeV) s Data 2010 ( PYTHIA: DP + F PYTHIA: DP PYTHIA: F
jet|
|y
0 0.5 1 1.5 2
ratio to data
0.6 0.8 1 1.2
1.4 |yjet|
events
0 2000 4000 6000 8000 10000 12000 14000 16000 18000
ATLAS Preliminary
L dt = 37 pb-1
∫
= 7 TeV) s Data 2010 ( HERWIG: DP + F HERWIG: DP HERWIG: F
jet|
|y
0 0.5 1 1.5 2
ratio to data
0.6 0.8 1 1.2 1.4
(a) (b)
(c) (d)
(e) (f)
Figure 1: The estimated signal yield in data (dots) using the signal leakage fractions from P
(a,c,e)
or H
(b,d,f) as functions of (a,b) E
γT, (c,d) P
jetTand (e,f)
|y
jet|. The error bars represent the statistical
uncertainties which, for most of the points, are smaller than the marker size and, thus, not visible. For
comparison, the MC simulations of the signal from P
and H
(shaded histograms) are also
included in (a,c,e) and (b,d,f), respectively. The MC distributions are normalised to the total number
of data events. The direct-photon (DP, right-hatched histograms) and fragmentation (F, left-hatched
histograms) components of the MC simulations are also shown. The ratio of the MC predictions to the
data are shown in the bottom part of the figures. 8
[rad]
γ-j
φ
∆
events
102 103 104 105
ATLAS Preliminary L dt = 37 pb-1
∫
= 7 TeV) s Data 2010 ( PYTHIA: DP + F PYTHIA: DP PYTHIA: F
[rad]
γj
φ
∆
0 1 2 3
ratio to data
0.4 0.6 0.8 1 1.2 1.4 1.6
[rad]
γ-j
φ
∆
events
102 103 104 105
ATLAS Preliminary L dt = 37 pb-1
∫
= 7 TeV) s Data 2010 ( HERWIG: DP + F HERWIG: DP HERWIG: F
[rad]
γj
φ
∆
0 1 2 3
ratio to data
0.4 0.6 0.8 1 1.2 1.4 1.6
[GeV]
γ-j
M
events
10 102 103 104
ATLAS Preliminary L dt = 37 pb-1
∫
= 7 TeV) s Data 2010 ( PYTHIA: DP + F PYTHIA: DP PYTHIA: F
[GeV]
γj
M
200 300 400 500 600 1000
ratio to data
0.6 0.8 1 1.2 1.4
[GeV]
γ-j
M
events
10 102 103 104
ATLAS Preliminary L dt = 37 pb-1
∫
= 7 TeV) s Data 2010 ( HERWIG: DP + F HERWIG: DP HERWIG: F
[GeV]
γj
M
200 300 400 500 600 1000
ratio to data
0.6 0.8 1 1.2 1.4
-j| θγ
|cos
events
0 1000 2000 3000 4000 5000 6000 7000 8000 9000 10000
ATLAS Preliminary L dt = 37 pb-1
∫
= 7 TeV) s Data 2010 ( PYTHIA: DP + F PYTHIA: DP PYTHIA: F
j| θγ
|cos
0 0.2 0.4 0.6 0.8
ratio to data
0.6 0.8 1 1.2
1.4 |cos θγ-j|
events
0 1000 2000 3000 4000 5000 6000 7000 8000 9000 10000
ATLAS Preliminary L dt = 37 pb-1
∫
= 7 TeV) s Data 2010 ( HERWIG: DP + F HERWIG: DP HERWIG: F
j| θγ
|cos
0 0.2 0.4 0.6 0.8
ratio to data
0.6 0.8 1 1.2 1.4
(a) (b)
(c) (d)
(e) (f)
Figure 2: The estimated signal yield in data (dots) using the signal leakage fractions from P
(a,c,e)
or H
(b,d,f) as functions of (a,b)
∆φγj, (c,d) M
γjand (e,f)
|cos θ
γj|. The distributions as functions of
M
γj(
|cos θ
γj|) include cuts on
|cos θ
γj|(M
γj) and
|η
γ+y
jet|(see text). Other details as in the caption to
Fig. 1.
-j| θγ
|cos
events
0 2000 4000 6000 8000 10000 12000 14000 16000 18000 20000
ATLAS Preliminary
L dt = 37 pb-1
∫
= 7 TeV) s Data 2010 ( PYTHIA: DP + F PYTHIA: DP PYTHIA: F
j| θγ
|cos
0 0.2 0.4 0.6 0.8 1
ratio to data
0.6 0.8 1 1.2
1.4 |cos θγ-j|
events
0 2000 4000 6000 8000 10000 12000 14000 16000 18000 20000
ATLAS Preliminary
L dt = 37 pb-1
∫
= 7 TeV) s Data 2010 ( HERWIG: DP + F HERWIG: DP HERWIG: F
j| θγ
|cos
0 0.2 0.4 0.6 0.8 1
ratio to data
0.6 0.8 1 1.2 1.4
(a) (b)
Figure 3: The estimated signal yield in data (dots) using the signal leakage fractions from P
(a) or H
(b) as functions of
|cos θ
γj|. These distributions do not include cuts on M
γjor
|η
γ+y
jet|. Other details as in the caption to Fig. 1.
bin-to-bin efficiency was computed as ε
i = Ndet,part i
Nparti
, where N
idet,partis the number of MC events that pass all the selection requirements both at the detector and particle levels and are generated and reconstructed in bin i, and N
ipartis the number of MC events that pass the selection requirements at the particle level and are located in bin i. The bin-to-bin efficiency is above approximately 60%, except for P
jetTand
∆φγj(
&40%), and is very similar for P
and H
.
The bin-to-bin reconstruction purity was computed as κ
i = Ndet,part i
Nidet
, where N
idetis the number of MC events that pass the selection requirements at the detector level and are located in bin i. The bin-to-bin reconstruction purity is above approximately 70%, except for P
jetTand
∆φγj(
&45%), and is very similar for P
and H
.
The efficiency of the jet-quality criteria (see Section 3.2) applied to the data was estimated using a tag-and-probe method. The leading photon in each event was considered as the tag to probe the leading jet. Additional selection criteria, such as
∆φγj> 2.6 (probe and tag required to be back-to-back) and
|
P
jetT −E
γT|/P
avgT< 0.4, where P
avgT =(P
jetT +E
γT)/2 (to have well-balanced probe and tag), were applied.
The jet-quality criteria were then applied to the leading jet and the fraction of jets accepted was measured as a function of P
jetTand
|y
jet|. The jet-quality selection efficiency is approximately 99%. No correction for this efficiency was applied, but an uncertainty was included in the measurements (see Section 7).
6 Cross-section measurement procedure
Isolated-photon plus jet cross sections were measured for photons with E
γT> 45 GeV,
|η
γ|< 2.37 (excluding the region 1.37 <
|η
γ|< 1.52) and isolation E
isoT,part< 4 GeV. The jets were reconstructed using the anti-k
tjet algorithm with R
=0.6 and selected with P
jetT> 40 GeV,
|y
jet|< 2.37 and
∆Rγj> 1.
Differential cross sections were measured as functions of E
γT, P
jetT,
|y
jet|and
∆φγj. Differential cross sections as functions of M
γjand
|cos θ
γj|were measured in the kinematic region
|η
γ+y
jet|/2 < 1.185,
10
[GeV]
γ T,lead
E
events
103 104 105
ATLAS Preliminary L dt = 37 pb-1
∫
= 7 TeV) s Data 2010 (
= 0.84) α PYTHIA: DP + F ( PYTHIA: DP PYTHIA: F
[GeV]
γ
ET
50 60 70 80 100 200 300 400
ratio to data
0.6 0.8 1 1.2 1.4
[GeV]
γ T,lead
E
events
103 104 105
ATLAS Preliminary L dt = 37 pb-1
∫
= 7 TeV) s Data 2010 (
= 0.67) α HERWIG: DP + F ( HERWIG: DP HERWIG: F
[GeV]
γ
ET
50 60 70 80 100 200 300 400
ratio to data
0.6 0.8 1 1.2 1.4
[GeV]
jet T,lead
P
events
103 104 105
ATLAS Preliminary L dt = 37 pb-1
∫
= 7 TeV) s Data 2010 (
= 0.65) α PYTHIA: DP + F ( PYTHIA: DP PYTHIA: F
[GeV]
jet
PT
50 60 70 80 100 200 300 400
ratio to data
0.6 0.8 1 1.2 1.4
[GeV]
jet T,lead
P
events
103 104 105
ATLAS Preliminary L dt = 37 pb-1
∫
= 7 TeV) s Data 2010 (
= 0.40) α HERWIG: DP + F ( HERWIG: DP HERWIG: F
[GeV]
jet
PT
50 60 70 80 100 200 300 400
ratio to data
0.6 0.8 1 1.2 1.4
lead|
|Yjet
events
0 2000 4000 6000 8000 10000 12000 14000 16000 18000
ATLAS Preliminary
L dt = 37 pb-1
∫
= 7 TeV) s Data 2010 (
= 0.65) α PYTHIA: DP + F ( PYTHIA: DP PYTHIA: F
jet|
|y
0 0.5 1 1.5 2
ratio to data
0.6 0.8 1 1.2
1.4 |
lead
|Yjet
events
0 2000 4000 6000 8000 10000 12000 14000 16000 18000
ATLAS Preliminary
L dt = 37 pb-1
∫
= 7 TeV) s Data 2010 (
= 0.40) α HERWIG: DP + F ( HERWIG: DP HERWIG: F
jet|
|y
0 0.5 1 1.5 2
ratio to data
0.6 0.8 1 1.2 1.4
(a) (b)
(c) (d)
(e) (f)