Study of the Weak Gauge Boson Production with the ATLAS Detector at the LHC
Habilitationsschrift an der Fakult¨ at f¨ ur Physik der
Technischen Universit¨ at M¨ unchen
vorgelegt von Dr. Oliver Kortner
aus M¨ unchen
M¨ unchen 2013
2
Acknowledgements
This treatise marks the end of a four-year habilitation process which involved exciting research in a worldwide collaboration. I would like to express my gratitude to those whithout whose support this work would have been much more difficult if not impossible.
I thank my home institute, the Max-Planck-Institut f¨ ur Physik, for giving me the oppor- tunity to concentrate on my habilitation project. In particular my thanks go to the head of the institute’s ATLAS group Prof. Siegfried Bethke who supported this project also as chair of the scientific advisory board of my habilitation project. I am grateful to him and to the other members of the board, Prof. Lothar Oberauer and Prof. Gregor Herten, for their guidance. I also very much appreciate Dr. Hubert Kroha’s constant encouragement and valuable advice.
Projects like a habilitation are always connected with cutbacks in spare time. I thank my family, my parents and my wife Sandra, for their understanding, their support, and their encouragement during the past four years.
3
4
Abstract
In 2010 the Large Hadron Collider went into operation and opened a new energy regime for experimental high energy physics studies. From 2010 to 2012 the ATLAS experiment collected pp collisions at the Large Hadron Collider amounting to integrated luminosities of 4.7 fb −1 (36 pb −1 in 2010, 4.7 fb −1 in 2011) at 7 TeV centre-of-mass energy and of 20 fb −1 at 8 TeV centre-of-mass energy (in 2012). The huge amount of weak gauge bosons W and Z created in these collisions allow for stringent tests of the Standard Model predictions for the production of weak gauge bosons.
The measured total W and Z production cross sections are sensitive to theoretical predictions in next-to-next-to-leading order of perturbation theory in quantum chromo- dynamics and constrain the parton densities of the proton. The measured cross sections agree with the preditions within the experimental and theoretical uncertainties.
The production of W and Z bosons in association with jets is an important background to many other physics processes under study at the Large Hadron Collider. A reliable prediction of this process is shown to be possible when leading or next-to-leading order multiparton perturbative computations are combined with parton shower models.
Physics beyond the Standard Model might manifest in deviations of the measured di- boson production cross sections from the Standard Model prediction. No deviation from the Standard Model has been observed within the precision of the experimental results.
5
6
Contents
1 Introduction 9
2 ATLAS experiment 13
2.1 Conventions . . . . 13
2.2 The subdectors of the ATLAS experiment . . . . 13
2.3 Event reconstruction . . . . 14
2.4 Performance determination . . . . 15
2.5 Luminosity measurement . . . . 16
3 Inclusive W/Z production 17 3.1 Theoretical predictions . . . . 17
3.2 Experimental conditions and event selection . . . . 19
3.2.1 Experimental conditions . . . . 19
3.2.2 Event selection . . . . 19
3.3 Background estimation . . . . 20
3.3.1 Background processes to W → `ν ` . . . . 20
3.3.2 Background processes to Z → ` + ` − . . . . 21
3.4 Cross section measurement and systematic uncertainties . . . . 21
3.5 Implications of the results on parton density functions . . . . 25
4 W/Z + jets production 29 4.1 Theoretical considerations . . . . 29
4.2 Experimental conditions and event selection . . . . 30
4.2.1 Experimental conditions . . . . 30
4.2.2 Event selection . . . . 30
4.3 Background processes to the Z + j production . . . . 31
4.4 Results . . . . 32
4.4.1 Transverse momenta of Z bosons accompanied by jets . . . . 32
4.4.2 Properties of the jets accompanying the Z boson . . . . 35
4.4.3 Conclusions . . . . 37
4.5 W production n association with heavy flavour jets . . . . 37
4.5.1 W + c production . . . . 38
4.5.2 W + b ¯ b . . . . 40
5 Di-boson production 43 5.1 Theoretical considerations . . . . 43
5.1.1 Effective Langrangians of triple gauge boson couplings . . . . 43
5.1.2 Sensitivity of cross section measurements to anomalous triple gauge boson couplings . . . . 44
7
8 CONTENTS
5.2 Experimental measurements . . . . 44
5.2.1 W + W − production . . . . 45
5.2.2 W + Z/γ production . . . . 48
5.2.3 Zγ production . . . . 53
5.2.4 ZZ production . . . . 54
5.3 Summary . . . . 56
6 Summary 57
Chapter 1 Introduction
In the present understanding of nature there are three generations of elementary fermions which can be distinguished by their interactions. Quarks take part in electromagnetic, weak, and strong interactions. Leptons do not feel the strong interaction. Charged leptons interactly electromagnetically and weakly, the neutrinos only weakly. The strong, elec- tromagnetic, and weak interactions are mediated by vector bosons, the so-called “gauge”
bosons. The electromagnetic interaction is carried by the photons, the strong interaction by eight gluons, and the weak interaction by W and Z bosons. These three interactions between the elementary fermions are theoretically described by the Standard Model of strong and electroweak interactions [1, 2, 3, 4]. In the Standard Model the W and Z bosons and the elementary fermions obtain their non-vanishing masses by the so-called
“Higgs mechanisms” of electroweak symmetry breaking which also leads to the observable scalar Higgs boson [5, 6, 7, 8, 9, 10]. The predictions of the Standard Model have been ex- perimentally verified with outstanding precision. In summer 2012 the ATLAS and CMS collaborations published the discovery of a Higgs boson like particle in proton-proton collision at the Large Hadron Collider (LHC) [11, 12].
A huge number of weak gauge bosons W and Z are produced in proton-proton col- lisions at the LHC allowing for studies of unprecedented precision. In lowest order of perturbation theory, Z bosons are created in collisions of same flavour quark-antiquark pairs, W + bosons are created in collisions of up-type quarks and down-type antiquarks, and W − bosons in collisions of down-type quarks and up-type antiquarks. In this order of perturbation theory the colliding quarks do not carry momentum transverse to the proton beam axis. So the momentum fractions x q and x ¯ q of the colliding quark and antiquark satisfy the relation x q · x ¯ q = m
2 W/Z
s where m W/Z denotes the boson mass and s the square of the centre-of-mass energy of the pp collision. Neglecting higher order corrections, also the weak gauge bosons have no transverse momentum; their rapidity is related to the momentum fractions of the quarks by the equation
y W/Z = ln
x q √ s m W/Z
. (1.1)
The rapidities of the Z bosons can computed from the momenta of the decay leptons.
As the momenta of the neutrinos of W decays are not fully measured in the experiment, one cannot compute the W rapidity without further assumptions. The rapidities of the charged decay leptons, however, are closely related to the rapidities of the W bosons and are used in the analysis. A measurement of the production of the gauge bosons as a function of the rapidities of the Z bosons or the rapidities of the charged decay leptons
9
10 CHAPTER 1. INTRODUCTION in case of W bosons therefore provides constraints to the parton distribution functions (PDF) of quarks and antiquarks.
W
W g
g q ’
q ’
q q
+
+
(a) Initial state gluon radiation.
W
g
W
g
q ’
+q ’
+q q
(b) Radiation of a W boson.
q q
Z
Z g
g q
q
(c) Initial state gluon radiation.
Z
g
Z
g
( )
q
( )
q
( )
q
( )
q (d) Radiation of a Z boson.
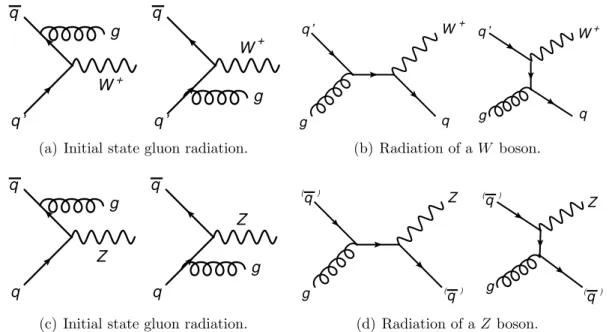
Figure 1.1: Lowest order Feynman diagrams for the production of W + and Z bosons in association with jets at the LHC.
It has been known since the late 1970s [13, 14, 15] that initial state gluon radiation (see Figures 1.1(a) and 1.1(c)) and the radiation of weak gauge bosons (see Figures 1.1(b) and 1.1(d)) lead to a significant transverse momentum of the gauge bosons. In order to reach percent accuracy of theoretical predictions needed to cope with the experimental accuracy of the cross section measurements, next-to-next-to-leading order (NNLO) computation are needed [16, 17, 18, 19, 20]. Hence the study of the production of weak gauge bosons is an important test of NNLO QCD cross section calculations.
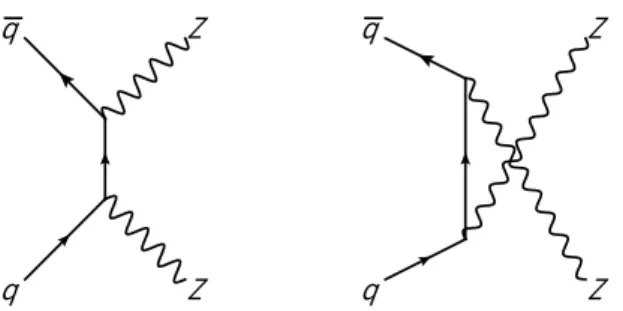
Weak gauge bosons can be produced in pairs. In lowest order of perturbation theory pairs of W bosons are created via two processes which are depicted in Figure 1.2: (1) The colliding quarks and antiquarks radiate the W bosons. (2) A Z boson created in a quark-antiquark collision disintegrates into a W + W − pair. Colliding quarks can also radiate Z bosons as shown by the lowest order Feynman diagrams for ZZ production in Figure 1.3. In the Standard Model the so-called ”anomalous” triple gauge boson vertex
q’’
q q
W W −
q q ’
W W −
+ +
Figure 1.2: Lowest order Feynman diagrams of the production of pairs of W bosons.
11
Figure 1.3: Lowest order Feynman diagrams of the production of pairs of Z bosons.
Z/γ ∗ → ZZ (see Figure 1.4) is forbidden. The precise measuremenent of the di-boson production cross section at the LHC probes the existence of anomalous triple gauge boson couplings which would be a hint for physics processes beyond the Standard Model.
Figure 1.4: Example of the triple gauge boson vertex Z/γ ∗ → ZZ which is forbidden in the Standard Model.
This treatise presents studies of the production of W and Z bosons with the ATLAS
detector at the LHC with a focus on the measurement and interpretation of the inclusive
W and Z production cross section, of the production of W and Z bosons in associations
with jets, and of the di-boson production.
12 CHAPTER 1. INTRODUCTION
Chapter 2
The ATLAS experiment at the LHC
ATLAS is a multipurpose detector operated at the LHC to study proton-proton colli- sions at centre-of-mass energies of up to 14 TeV. It collected pp collisions amounting to integrated luminosities of 4.7 fb −1 (36 pb −1 in 2010, 4.7 fb −1 in 2011) at 7 TeV centre- of-mass energy and of 20 fb −1 at 8 TeV centre-of-mass energy (in 2012). Collisions at 14 TeV centre-of-mass energy will become available after an upgrade of the LHC in 2015.
The ATLAS detector is described in detail in reference [21]. Only a brief description of its design and the key points of particle identification with the ATLAS detector will be presented here.
2.1 Conventions
ATLAS uses a right-handed coordinate system with its origin at the nominal interaction point in the centre of the detector and the z axis along the beam pipe. The x axis points from the interaction point to the centre of the LHC ring, and the y axis points upwards.
For convenience also cylindrical and polar coordinates are used. In cylindrical coordinates x, y are replaced by the distance from the beam line r := p
x 2 + y 2 and the azimuthal angle φ as direction measure in the plane transverse to the beam line. In polar coordinates r is replaced by the polar angle θ. The pseudorapidity η is defined as − ln
tan θ 2 .
∆R := p
(η 1 − η 2 ) 2 + (φ 1 − φ 2 ) 2 is often applied as a measure of the distance between two threevectors ~ x 1 and ~ x 2 . The transverse momentum p T of a particle with momentum
~
p is defined as p
p 2 x + p 2 y . ATLAS uses a system of units in which c = ~ = 1. The conventions described above will be followed in this treatise.
2.2 The subdectors of the ATLAS experiment
The ATLAS detector consists of a system of subdectors.
The innermost subdetector is the so-called “inner detector” which is used to measure the momenta of charged particles with p T & 0.5 GeV within |η| < 2.5 with per-cent precision up to p T ≈ 100 GeV. Three detector technologies are operated between r ≈ 50 mm and r ≈ 1100 mm in a solenoidal magnetic field of 2 T strength: three layers of silicon pixel detectors for precise primary and secondary vertex measurements, six layers of silicon strip detectors for precise track reconstruction in a high track density environment, and up to |η| = 2.0 a transition radition tracker with 36 layers of straw tubes with electron identification capability.
13
14 CHAPTER 2. ATLAS EXPERIMENT The inner detector is surrounded by the calorimeter system of sampling detectors with full φ symmetry. The electromagnetic calorimeter utilizes liquid argon as active material between accordion shaped lead absorber plates. It is divided into a barrel part (|η| < 1.475) and end-cap parts (1.375 < |η| < 3.2). In the hadron calorimeter scintillating tiles in steel absorber plates act as sampling medium for |η| < 1.7. In the end-cap region (1.5 < |η| < 3.2) a copper/liquid-argon sampling calorimeter is used for hadron detection.
The calorimetric coverage is extended to |η| = 4.9 by the copper-tungsten/liquid argon forward calorimeter (3.2 < |η| < 4.9).
The muon spectrometer, the outer shell of the detector, consists of three large air- core superconducting toroidal magnet systems (two endcaps and one barrel) providing a field integrals of about 2.5 Tm in the barrel and of about 6 Tm in the end caps. The deflection of the muon trajectories in this magnetic field is measured via hits in three layers of precision chambers for |η| < 2.7. Three layers of resistive plate chambers (RPC) in the barrel (|η| < 1.05) and three layers of thin gap chambers (TGC) in the endcaps (1.05 < |η| < 2.4) provide the muon trigger and also measure the muon trajectory in the non-bending (φ) plane of the spectrometer magnets.
The ATLAS detector has a three-level trigger system: level 1, level 2, and the event filter. The level-1 trigger rate at design luminosity is approximately 75 kHz. The level-2 trigger and the event filter reduce consecutively the rate of events which are stored for the analysis to about 200 Hz.
At level 1, electromagnetic objects are selected if the total transverse energy deposited in the electromagnetic calorimeter in two adjacent towers of ∆η × ∆φ = 0.1 × 0.1 size exceeds a certain threshold. Fast calorimeter and track reconstruction algorithms at level 2 and the full offline reconstruction algorithms at the event-filter level are applied to refine the level-1 trigger decision.
The muon spectrometer provides a level-1 hardware muon trigger which is based on hit coincidences in different RPC and TGC detector layers within programmed geometrical windows which define the muon p T . The level-1 and event-filter muon triggers perform a software confirmation of the level-1 muon trigger using refined p T measurements from the precision chambers.
2.3 Event reconstruction
Complex computer algorithms are used to reconstruct the recorded collision data.
Electrons are reconstructed as charged particle tracks which can be associated to clusters of energy depositions in the electromagnetic calorimeters. The cluster energy is a precise measure of the electron energy. The inner detector track defines the direction of flight of the reconstructed electron at the interaction point. The shape of the clusters, the level of agreement between the energy of the clusters and the energy of the associated track, and the amount of transition radiation detected in the transition radiation tracker are combined to define different purity levels of the reconstructed electrons. The choice of the purity level depends on the physics process under study. [22]
Within the acceptance of the inner detector of |η| < 2.5 muons are reconstructed as
charged particle tracks which extend from the inner detector into the muon spectrom-
eter. The measured muon momentum is a statistical combination of the momentum
measurements performed in the inner detector and the muon spectrometer. In the re-
gion of 2.5 ≤ |η| < 2.7 which is covered by the muon spectrometer the muon trajectory
2.4. PERFORMANCE DETERMINATION 15 is only reconstructed in the muon spectrometer. The direction of flight and the impact parameter of the muon at the interaction point are determined by extrapolating the spec- trometer track back to the beam line taking into account the energy loss of the muon in the calorimeters. The muon spectrometer is not fully instrumented in the centre of the ATLAS detector (|η| < 0.1) to provide space for services of the inner detector and the calorimeters. In this acceptance gap a muon can be identified as a track which can be associated to an energy deposit in the calorimeter as expected from a minimum ionizing particle. As this so-called “calorimeter tagged muon” is more prone to the misidentifica- tion of charged pions as muons, calorimeter tagged muons are not considered in most of the physics analyses. [23]
Jets are reconstructed with the anti-k T algorithm [24] applied to topological clusters of energy in the calorimeter [25]. The energies and directions of reconstructed jets in data and simulated events are corrected for the presence of additional pp interactions, the position of the primary interaction vertex, the measurement biases induced by calorimeter non- compensation, additional dead material, and out-of-cone effects, using detector simulation and a combination of in-situ methods [25, 26].
Neutrinos do not interact with the detector material. The presence of a neutrino in the final state of a pp collision can become apparent in a non-vanishing total transverse momentum of an event. The size of this transverse momentum imbalance is called the
“missing transverse energy” E T miss . ATLAS employs an algorithm [27] for the E T miss mea- surement which adds vectorially the transverse momenta of electrons, muons, jets, and individually calibrated [28] topological clusters of calorimeter energy depositions [29] not associated with electrons, muons, and jets.
2.4 Determination of the performance of the trigger and the event reconstruction
The performance of the trigger and the event reconstruction is determined with simulated data in combination with experimental data.
The efficiency of the single electron and muon triggers is expressed as the fraction of (offline) reconstructed electrons or muons which fire the corresponding single lepton triggers. It can be determined with simulated and experimental data. In Z → ` + ` − (` = e, µ) events, for instance, the data acquisition can be triggered by each of the two decay leptons which makes it possible to measure the single electron and single muon trigger efficiencies in recorded Z → ` + ` − decays. One divides the decay leptons into two categories, the so-called “tag” which has given a single lepton trigger and the other lepton which is often called the “probe”. The fraction of probes which have given a single lepton trigger is the single lepton trigger efficiencies. This way the single electron and single muon trigger efficiencies can be measured with per-cent or higher accuracy depending on the amount of available Z → ` + ` − events [30, 31].
The offline electron and muon reconstruction efficiencies can also be measured with
Z → ` + ` − events adopting a similar technique. One selects Z → ` + ` − events by requiring
a tag-and-probe pair with an invariant mass close to the Z boson mass. The tag is defined
as before, but the probe is a track which is isolated from other particles produced in the
pp collision. The fraction of probes which are identified as electrons or muons is a measure
for the electron or muon reconstruction efficiency. Due to the huge amount of Z bosons
produced at the LHC one can measure the lepton reconstruction efficiency with per-cent
16 CHAPTER 2. ATLAS EXPERIMENT or higher accuracy. J/ψ → ` + ` − are utilized for the measurement of low p T reconstruction efficiencies. [32, 33, 34, 23]
The lepton momentum resolution and momentum scale is extracted from the positions and the widths of the reconstructed J/ψ → ` + ` − and Z → ` + ` − with per-mil accuracy [35, 36, 37, 38, 23].
The uncertainties of the jet energy scale and jet energy resolution are estimated with simulated data and with recorded di-jet and Z/γ -jet events. One makes use of the fact that the transverse momenta of the two jets respectively of the Z bosons or γ and the jet must be equal due to the vanishing total transverse momentum in a pp collisions. The relative jet energy scale uncertainty amounts to about 1% for jets with 50 GeV . p T . 500 GeV and |η| . 1; it reaches its largest value of 6% for low-p T jets at |η| = 4.5. The uncertainty on the jet energy resolution is found to be of the order of 10%. [25, 39, 26]
The E T miss measurement is validated with experimental data of Z → ` + ` − and of W +(−) → ` +(−) (−) ν ` (` = e, µ) decays. In Z → ` + ` − events in the absence of jets E T miss must vanish. In events with leptonic W boson decays E T miss must equal the p T` in the absence of jets. The fractional systematic uncertainty on the E T miss measurement is found to be 2.6%. [40]
2.5 Luminosity measurement
The event rate for a given physics process is the product of the cross section of the physics process σ and the LHC luminosity L. ATLAS has two symmetrical luminosity monitors around the beam pipe located at ±17 m from the interaction point. The luminosity monitors are calibrated with about 3% accuracy againt the luminosity from accelator paramters after van der Meer scans. In these scans the profiles of the colling beams are measured by moving the beam against each other in horizontal and vertical directions orthogonal to the beam and looking at the interaction rates in the different scan points.
The luminosity from accelator parameters is given by L = n b f r n 1 n 2
A
where n b is the number of proton bunches in the LHC ring, f r the revolution frequency, A
is the effective area of the colling bunches, and n 1,2 the number of protons in the colliding
bunches. A is taking from the van der Meer scans, the product n 1 n 2 is measured with
the current transformers. [41, 42]
Chapter 3
Measurement of the inclusive W and Z boson production cross section
The ATLAS collaboration has studied the inclusive production of W and Z bosons at the LHC in great detail. The main results of these studies will be discussed in this chapter.
The discussion will be focussed on the results obtained for the leptonic W and Z boson decays with electrons and muons which are published in Reference [43].
3.1 Theoretical predictions
Let ˆ σ ab→W/Z+X be the cross section for the production of a W or Z boson in the collisions of partons a and b. In the parton model the cross section σ pp→W/Z+X for the production of W or Z bosons in proton-proton collisions is given by
σ pp→W/Z+X = X
a,b=q,g 1
Z
0 1
Z
0
ˆ
σ ab→W/Z+X · f a (x a , Q 2 ) · f b (x b , Q 2 ) dx a dx b
where the sum is taken over the different quarks and gluons inside the proton and
x 10
-310
-210
-11
2
)=(100 GeV)
2(x,Q
af
0 0.2 0.4 0.6 0.8 1 1.2 1.4
g/10
d d u
u s
s, c c, b b,
Figure 3.1: Parton distributions as a function of the fraction x of the proton momentum carried by the parton a at a momentum scale Q = 100 GeV as predicted by the NNLO MSTW08 PDF set [44].
17
18 CHAPTER 3. INCLUSIVE W/Z PRODUCTION f a/b (x a/b , Q 2 ) denotes the probability density for finding parton a/b with the fraction x a/b of the proton momentum if the process takes place at the momentum scale Q.
Figure 3.1 shows f a (x, Q 2 ) as a function of x for a momentum scale Q = 100 GeV, which is of the order of the masses of the W and Z bosons, for the NNLO MSTW08 PDF set [44]. For x & 0.1 most of the momentum is carried by the valence u quarks followed by the valence d quarks. Sea quarks and antiquarks are supposed to be produced in gluon splitting. They tend to carry small momentum fractions. The light ¯ u and ¯ d quarks have similar PDFs while the c and b quarks and antiquarks are suppressed due to their large masses. The fact that the PDFs of the s quarks and antiquarks are significantly lower than the ¯ d PDF will be discussed in a later section. For x . 0.01 the PDF for gluons is by far the largest.
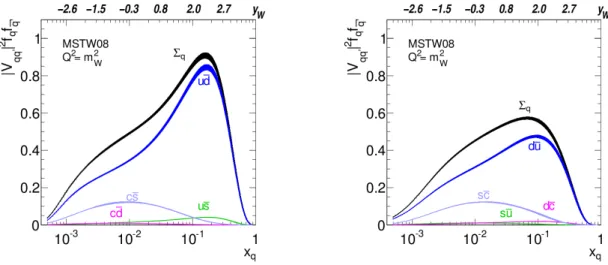
Figure 3.2: Parton luminosities of different quark flavours to the Z boson production at the LHC as a function of the momentum fraction carried by the quark and the corresponding rapidity of the Z boson according to Equation (1.1).
Figures 3.2 and 3.3 present the contributions of the different quark flavours to the production of Z and W ± bosons as a function of the momentum fraction x q carried by the colliding quark. As valence quarks tend to carry a larger momentum fraction of the proton than sea quarks, the weak gauge bosons tend to be produced into the direction of the colliding quark. Yet, a substantial fraction of the bosons is also produced in the opposite direction if the colliding quark carries a small momentum fraction. About 80%
of the Z bosons are produced in u¯ u and d d ¯ collision, the remaining 20% mostly in s¯ s collisions. W +(−) bosons are predominantly produced in u d ¯ (d u) collision, about 20% in ¯ c¯ s (s¯ c) collisions.
Hence the measurements of the dependence of the gauge boson production on the radidity of the Z boson and the charged decay leptons of the W bosons constrain the parton density functions of u, d, s, c quarks and their antiquarks.
The ATLAS collaboration used the NNLO prediction of the FEWZ programme [45]
in combination with the MC@NLO generator [46] varying the PDF sets to obtain the following predictions for the following cross sections times branching ratios [43]:
• σ(pp → W + + X → ` + ν ` + X) = (6.16 ± 0.31) nb (` = e, µ);
• σ(pp → W − + X → ` − ν ¯ ` + X) = (4.30 ± 0.21) nb (` = e, µ);
3.2. EXPERIMENTAL CONDITIONS AND EVENT SELECTION 19
Figure 3.3: Contributions of different quark flavours to the W boson production at the LHC as a function of the momentum fraction carried by the quark and the corresponding rapidity of the W boson according to Equation (1.1) (V qq
0denotes the CKM matrix element). Left: W + production. Right: W − production.
• σ(pp → Z + X → ` + ` − + X) = (0.99 ± 0.05) nb (` = e, µ).
3.2 Experimental conditions and event selection
3.2.1 Experimental conditions
The analysis of the inclusive production of W and Z bosons described in Reference [43] is based on about 30 pb −1 pp of collision data at √
s = 7 TeV recorded in 2010 which makes it possible to measure the total W ± and Z boson production cross section with per-cent statistical precision or better. Given a systematic uncertainty of this measurement at the same level, sensitivity to theoretical NNLO predictions is reached. In 2010 the LHC provided moderate instantanous luminosities such that the level of pile-up was low and corresponded to an average number of inelastic collisions of less than 2 which was taken into account in the Monte-Carlo simulation.
3.2.2 Event selection
pp collision events entering the analysis must have been triggered by an electron with transverse energy E T > 15 GeV and pseudorapidity η e in |η e | < 2.5 or a muon with transverse momentum p T > 15 GeV and pseudorapidity η µ in |η µ | < 2.4. The transition regions between the calorimeter barrel and end-cap parts of 1.37 < |η e | < 1.52 are excluded from the electron channel in the offline analysis. The same pseudorapidity requirements are applied in the offline analysis for the muon channels. In both channels, higher offline energy and momentum thresholds are used: E T > 20 GeV for electrons and p T > 20 GeV for muons. Hence almost 100% of the W → eν e , Z → ee, and Z → µµ events fulfilling the offline requirements pass the trigger and 85.1% of the W → µν µ events due to the limited muon trigger acceptance in the barrel region.
In order to reject events in which jets are misidentified as electrons and events with
electrons and muons from hadron decays, the electrons and muons are required to be
20 CHAPTER 3. INCLUSIVE W/Z PRODUCTION isolated. The cut on the energy deposition in the calorimeters in a cone of ∆R = 0.3 around the electron is chosen such that an isolation efficiency of 98% constant in p T and η of the electron from a W decay is reached. A cut on the sum of the transverse momenta of tracks with p T > 1 GeV surrounding a selected muon in a cone of ∆R = 0.2 provides more than 99% isolation efficiency for muons from W and Z boson decays at a high background rejection.
Events with cosmic ray or beam halo muons are rejected to a negligible level by requiring the selected muons to emerge from the primary vertex.
Candidate events for leptonic decays of W bosons must have a missing transverse energy E T miss > 25 GeV and a transverse mass m T := p
2p ` T E T miss (1 − cos φ) > 40 GeV where φ denotes the angle between the momentum of the charged lepton in the transvere plane and the missing transverse momentum. Pairs of oppositely charged leptons are required in the Z boson analysis.
3.3 Background estimation
3.3.1 Background processes to W → `ν `
Three kinds of processes have to be considered as background to the production of W →
`ν ` (` = e, µ): (1) processes with isolated charged leptons and neutrinos in the final state, (2) processes with more than one isolated charged lepton in the final state with at least one lepton outside the acceptance of the detector such mimicking large missing transverse energy, (3) so-called “QCD background”, i.e. jet events with jets that are misidentified as electrons or real electrons or muons from hadron decays which appear to be isolated.
The following processes belong to the first category:
• W → τ ν τ with the τ lepton decaying into `ν ` ν τ (` = e, µ);
• t ¯ t mainly when one of the W bosons from the t quark decays disintegrates into `ν ` (` = e, µ);
• Z → τ τ with at least one of the τ leptons decaying leptonically.
Z → ` + ` − (` = e, µ) falls into the second category. Di-boson production belongs to category (1) or (2) depending on whether pairs of W or Z bosons are produced. Monte- Carlo simulation samples can be used to estimate the contributions of the processes of categories (1) and (2):
• 2.6% of the W → eν e candidate events are expected to be from W → τ ν τ , 0.4%
from t ¯ t, 0.1-0.2% from Z → τ τ , Z → ee, and di-boson production;
• 3.3% of the W → µν µ candidates are from Z → µµ, 2.8% from W → τ ν τ , 0.4%
from t ¯ t, and 0.1% from Z → τ τ , Z → ee, and di-boson production.
It is very difficult to predict the contributions of the processes of category (3) to the back-
ground with Monte-Carlo simulation samples because of the very high rejection of these
processes by the analysis cuts. Processes of category (3) contribute to the background
only as their cross sections are orders of magnitude larger than the W boson produc-
tion cross section. Monte-Carlo samples of enormous size would be needed for a reliable
background prediction. One must therefore determine these backgrounds by data driven
techniques.
3.4. CROSS SECTION MEASUREMENT AND SYSTEMATIC UNCERTAINTIES 21 By dropping the E T miss requirement and loosening some of the electron identification criteria one can enrich the QCD backgound contribution. A fit of the linear superposition of signal and QCD background template distributions to the resulting E T miss distribution makes it possible to determine the amount of QCD background in the selected event sample. The procedure estimates a 3.4% QCD background contribution to the W + sample and a 4.8% contribution to the W − sample with relative uncertainties of about 10%. The QCD background in the W → µν µ channel comes from muons from hadron decays, predominantly decays of c and b hadrons. As these muons appear inside the c and b quark jets, the QCD background contribution to the selected W → µν µ sample can be determined by inverting the isolation criteria. A 1.7% QCD background contribution to the W + sample and a 2.8% contribution to the W − sample with a relative precision of about 23%.
3.3.2 Background processes to Z → ` + ` −
The background to the Z → ` + ` − (` = e, µ) has two sources: (1) events with pairs of oppositely charged electrons or muons in the final states and (2) events with jets that are misidentified as electrons.
Monte-Carlo simulation samples were used to determine the contributions of the fol- lowing background processes to the selected Z → ee candidate events:
• W → eν e and W → (τ → eν e ν τ )ν τ , where a jet produced in association with the W boson is misidentified as the second electron, Z → τ τ with τ → eν e ν τ , and t ¯ t production have a total background contribution corresponding to 0.3% of the selected events;
• Di-boson production is responsible for a 0.2% background contribution.
The QCD background is determined by a fit of a superposition of template distributions for the Z → ee signal and the QCD background to the di-electron invariant mass distribution and found to be 1.6% with a 40% relative uncertainty.
According to Monte-Carlo simulation studies, t t ¯ production makes 0.1% of the selected Z → µµ events, Z → τ τ with τ → µν µ ν τ 0.07%, and di-boson production 0.2%. A 0.4%
QCD background contribution is determined from the di-muon mass spectrum after the inversion of the isolation requirements.
3.4 Cross section determination and systematic un- certainties
The selection criteria described in Section 3.2.2 limit the phase space populated by the decay leptons of the W and Z bosons and, consequently, the phase space populated by the W and Z bosons themselves. The restrictions on the phase space covered by decay leptons can be summarized as follows:
• W → eν e : p T,e > 20 GeV, |η e | < 2.47, excluding 1.37 < |η e | < 1.52, p T,ν
e> 25 GeV, m T > 40 GeV;
• W → µν µ : p T,µ > 20 GeV, |η µ | < 2.4, p T,ν
µ> 25 GeV, m T > 40 GeV;
• Z → ee: p T,e > 20 GeV, |η e | < 2.47, excluding 1.37 < |η e | < 1.52;
22 CHAPTER 3. INCLUSIVE W/Z PRODUCTION
• Z → µµ: p T,eµ > 20 GeV, |η µ | < 2.4.
The Z boson production cross section was measured for di-lepton invariant masses in the interval ]66 GeV, 116 GeV[. The phase space limited by these cuts is also called the
“fiducial volume”.
If N denotes the number of events observed after all selection cuts, B the number of background events, C W/Z the fraction of events in the fiducial volume which pass all W or Z analysis selection cuts, and R
L dt the integrated lumninosity entering the analysis, then the so-called “fiducial cross section” for the observation of W or Z bosons in a certain decay channel is given by
σ f id = N − B C W/Z · R
L dt .
One obtains the corresponding total cross section σ tot by dividing the fiducial cross section by the so-called “acceptance” A W/Z which is the fraction of the events falling into the fiducial volume:
σ tot = N − B A W/Z · C W/Z · R
L dt .
The statistical error of the total cross section therefore equals δσ tot (sta) = σ tot ·
√ N
N − B
and is of the order of 1%. The 3.4% relative uncertainty on the integratged luminosity translates into a 3.4% relative luminosity contribution to the uncertaintity of σ tot . The uncertainties δB, δA W/Z , and δC W/Z on B , A W/Z , and C W/Z respectively determine the systematic uncertainty of σ tot :
δσ tot (sys) = σ tot · s
δB N − B
2
+
δA W/Z A W/Z
2
+
δC W/Z C W/Z
2
.
δB is less than 0.05%N and therefore has a negligible contribution to the systematic error. The uncertainty δC W/Z has two sources: (1) the limited knowledge of trigger and reconstruction efficiencies and (2) the theoretical uncertainty on the distributions of the decay products. The experimental contribution of about 2% dominates the uncertainty of C W/Z compared to the small relative theoretical uncertainties of the order of 0.5%. The uncertainty on A W/Z has been determined with Monte-Carlo simulation samples. Four different sources of the systematic uncertainties of the acceptances were considered in the analysis:
1. Uncertainties assigned to the parton densities provided by one PDF set;
2. Uncertainties due to differences between different PDF sets which can be larger than the errors assigned to an individual PDF set;
3. Uncertainties due to the modelling of the hard-scattering processes of the W and Z boson production;
4. Uncertainties due to the parton shower and hadronization description.
3.4. CROSS SECTION MEASUREMENT AND SYSTEMATIC UNCERTAINTIES 23 The CTEQ 6.6 [47] PDF eigenvector error set at 90% confidence level was used to estimate the first source. The maximum difference between the acceptances obtained with the CTEQ 6.6, the ABKM095fl [48, 49], HERADPDF 1.0 [50, 51], MSTW2008 [44], CT10, CT10W [52], and NNPDF2.1 [53, 54] sets were used for the error caused by the second source. The third contribution was determined as the difference between the acceptances obtained with the MC@NLO [46] and POWHEG [55, 56] generators. Finally the error contribution by the fourth source was taken as the difference between the acceptances obtained with the parton shower and hadronization descriptions in the HERWIG [57] and PYTHIA [58] generators. The contribution of the four sources are of similar sizes and amount to an about 2% uncertainty in total.
The ATLAS collaboration has measured the following total cross sections:
• σ(pp → W + + X → e + ν e + X) = (6.063 ± 0.023(sta) ± 0.150(sys) ± 0.206(lum)) nb, σ(pp → W + + X → µ + ν µ + X) = (6.062 ± 0.023(sta) ± 0.141(sys) ± 0.206(lum)) nb, σ(pp → W + + X → ` + ν ` + X) = (6.048 ± 0.016(sta) ± 0.120(sys) ± 0.206(lum)) nb;
• σ(pp → W − + X → e − ν ¯ e + X) = (4.191 ± 0.020(sta) ± 0.119(sys) ± 0.142(lum)) nb, σ(pp → W − + X → µ − ν ¯ µ + X) = (4.145 ± 0.020(sta) ± 0.112(sys) ± 0.141(lum)) nb, σ(pp → W − + X → ` − ν ¯ ` + X) = (4.160 ± 0.014(sta) ± 0.101(sys) ± 0.141(lum)) nb;
• σ(pp → Z + X → e + e − + X) = (0.952 ± 0.010(sta) ± 0.032(sys) ± 0.032(lum)) nb, σ(pp → Z + X → µ + µ − + X) = (0.935 ± 0.009(sta) ± 0.021(sys) ± 0.032(lum)) nb, σ(pp → Z + X → ` + ` − + X) = (0.937 ± 0.006(sta) ± 0.018(sys) ± 0.032(lum)) nb.
The results obtained with the electron and muon final states are in good agreement. The fact that σ(pp → W + + X → ` + ν ` + X) is smaller than the corresponding cross sections for the electron and muon final states is caused by the averaging procedure which takes into account correlations between systematic errors in the electron and muon final states.
) [nb]
ν
ll BR(W →
tot
⋅ σ
5.7 5.8 5.9 6 6.16.2 6.3 6.4 6.5 6.6
νl
l+ +→ W
νµ
µ+ +→ W
νe
e+ +→ W
Theoretical prediction Data 2010 with statistical error
•
+systematic error +luminosity uncertainty
) [nb]
ν
l→ l
⋅ BR(W σ
tot3.7 3.8 3.9 4 4.1 4.2 4.3 4.4
νl
l-
→ W-
νµ
µ-
→ W-
νe
e-
→ W-
Theoretical prediction Data 2010 with statistical error
• +systematic error +luminosity uncertainty
Figure 3.4: Comparison of the measured W production cross sections in the electron and muon final states amongst each other and with theoretical predictions (according to [43]).
The statistical, systematic, and luminosity uncertainties have been added quadratically in the plots.
As illustrated in Figures 3.4 and 3.5 the measured cross sections match the theoretical
predictions within the experimental and theoretical uncertainties. The measured W + and
24 CHAPTER 3. INCLUSIVE W/Z PRODUCTION
) [nb]
l
-l
+→
⋅ BR(Z σ
tot0.9 0.95 1 1.05
l-
l+
→ Z
µ-
µ+
→ Z
e-
e+
→ Z
Theoretical prediction Data 2010 with statistical error
• +systematic error +luminosity uncertainty
Figure 3.5: Comparison of the measured Z production cross sections in the electron and muon final states amongst each other and with theoretical predictions (according to [43]).
The statistical, systematic, and luminosity uncertainties have been added quadratically in the plots.
Z production cross sections appear to be a bit smaller than theoretical predictions while the measured W − production cross section is above the theoretical prediction. Figure 3.6 which compares the measured cross sections with theoretical predictions based on different PDF sets shows that the ratio between the measured and predicted cross sections strongly depends on the choice of the PDF set which is also reflected in the error bars on the theoretical predictions in Figures 3.4 and 3.5. Even stronger constraints on the PDFs are provided by the dependence of the Z boson production cross section on the absolute value of the Z boson’s rapidity and the dependence of the W boson production cross section on the rapidity of the charged decay lepton. This will be discussed in more detail in the next section.
) [nb]
l
-l
+→ γ * BR(Z/
Z
⋅ σ
tot0.8 0.9 1
) [nb] ν
+l →
+BR(W ⋅
+Wtotσ
5 5.5 6 6.5
= 7 TeV) s Data 2010 ( MSTW08 HERAPDF1.5 ABKM09 JR09
total uncertainty
⊕ acc sys sta ⊕ uncertainty 68.3% CL ellipse area
L dt = 33-36 pb-1
∫
ATLAS
) [nb]
l
-l
+→ γ * BR(Z/
Z
⋅ σ
tot0.8 0.9 1
) [nb] ν
+l →
+BR(W ⋅
+Wtotσ
5 5.5 6 6.5
) [nb]
l
-l
+→ γ * BR(Z/
Z
⋅ σ
tot0.8 0.9 1
) [nb] ν
-l →
-BR(W ⋅
-Wtotσ
3.5 4 4.5
= 7 TeV) s Data 2010 ( MSTW08 HERAPDF1.5 ABKM09 JR09
total uncertainty
⊕ acc sys sta ⊕ uncertainty 68.3% CL ellipse area
L dt = 33-36 pb-1
∫
ATLAS
) [nb]
l
-l
+→ γ * BR(Z/
Z
⋅ σ
tot0.8 0.9 1
) [nb] ν
-l →
-BR(W ⋅
-Wtotσ
3.5 4 4.5
Figure 3.6: Comparison of the total W ± and Z boson production cross sections with
theoretical predictions based on different PDF sets [43].
3.5. IMPLICATIONS OF THE RESULTS ON PARTON DENSITY FUNCTIONS 25
3.5 Implications of the results on parton density func- tions
The momentum fraction x q carried by the colliding quark is directly related to the W or Z boson’s rapidity by Equation 1.1 in leading order of perturbation theory. In proton- proton collisions the quark’s direction of flight is not known so that one can measure the dependence of the W and Z boson production cross sections only on the absolute values of rapidities.
Z
|
|y
0 0.5 1 1.5 2 2.5 3 3.5
Theory/Data
0.9 1
1.10 0.5 1 1.5 2 2.5 3 3.5
| [pb]
Z/d|y σ d
20 40 60 80 100 120 140 160
= 7 TeV) s Data 2010 ( MSTW08 HERAPDF1.5 ABKM09 JR09 L dt = 33-36 pb-1
∫ Z → l
+l
-Uncorr. uncertainty Total uncertainty
ATLAS
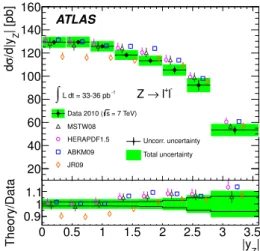
Figure 3.7: Comparison of the measured differential Z boson production cross section d|y dσ
Z
|
with NNLO theory predictions using various PDF sets. The ratio of theoretical predictions to data is displayed in the bottom of the plot. Theoretical points are displaced for clarity within each bin. [43]
A comparison of the measured differential Z boson cross section d|y dσ
Z
| with NNLO predictions using different PDF sets is given in Figure 3.7. The theoretical cross section values based on the MSTW08, the HERAPDF1.5, and the ABKM09 PDF sets agree with the measured values within the experimental and theoretical uncertainties with MSTW08 showing the smallest deviation from the measurement. The use of the JR09 PDF set leads to significant discrepancies between the experimental and predicted values for |y Z | . 1.5.
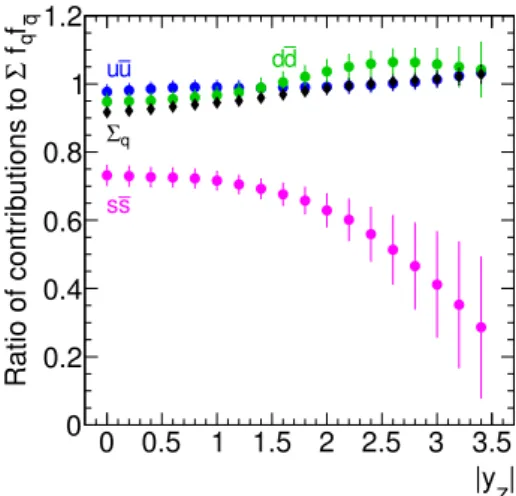
Figure 3.8 shows the ratios of the parton luminosities of JR09 and MSTW08 for the u, d, and s quark flavours. The sums of the luminosities are compatible with 1 for |y Z | > 1.5 and are significantly below 1 for smaller Z boson rapidities as expected from Figure 3.7.
The ratios for u¯ u and d d ¯ collisions are compatible with 1 within less than 2 standard deviations while the s¯ s ratios are significantly below 1. At |y Z | = 0.5, x q is about 0.02 for positive y Z and about 0.008 for negative y Z . According to Figure 3.2, u¯ u and d d ¯ collisions contribute to approximately 20% of the Z boson production for x q = 0.02 and to approximately 15% for x q = 0.008 while s¯ s contributes 8% each for the two x q values.
Taking into account the parton luminosity ratios of Figure 3.8, a 1.8% decrease of the JR09 cross section prediction compared to MSTW08 comes from u¯ u, 3.5% from d d ¯ and 4.3% from s¯ s leading to an overall decrease of 10% in agreement with Figure 3.7.
The large discrepancy of the strange quark parton densities of JR09 and MSTW08 are
caused by the fact that no experimental constraints to the strange quark PDF are used
in JR09 – the strange quark density is computed assuming strange quarks and antiquarks
26 CHAPTER 3. INCLUSIVE W/Z PRODUCTION
Z
|
|y 0 0.5 1 1.5 2 2.5 3 3.5
q
f
qf Σ Ratio of contributions to
0 0.2 0.4 0.6 0.8 1 1.2
Σ
qu
u d d
s s
Figure 3.8: Ratios of the parton luminosities of the JR09 and MSTW08 PDF sets for the u, d, and s quarks flavours.
to be produced via QCD radiation – while MSTW08 uses neutrino-nucleon scattering data. Neutrino nucleon scattering is sensitive to the strange quark density of the nucleon by the process depicted in Figure 3.9. In a charged current interaction the incoming ν µ gets transformed into µ − when scattered off a strange quark from the nucleon which is converted into a charm quark. The semileptonic charm quark decay produces a µ + . The rate of µ + µ − events in neutrino-nucleon scattering constrains the strange quark density of the nucleon. Unfortunately the interpretation of the neutrino-nucleon scattering data from the NuTeV[59] and CCFR[60] experiments is affected by uncertainties from charm fragmentation and nuclear corrections which leads to large discrepancies of the strange quark density between the MSTW08 and the CT10 PDF sets, for instance: MSTW08 predicts the ratio ¯ s/ d ¯ of the anti-strange and anti-down quark PDFs to be less than 0.5, so-called “strangeness suppression”, while ¯ s/ d ¯ is compatible with 0.5 in CT10, the value of the ratio suggested by SU(3) flavour symmetry.
µ −
W +
s c W +
d/s ν µ
µ + ν µ
N
Figure 3.9: Schematic drawing of the neutrino-nucleon scattering process probing the strange quark PDF.
The ATLAS collaboration tried to find out whether strangeness suppression or SU(3)
flavour symmetry is more compatible with the measured W ± and Z boson production
cross sections. It performed two simultaneous PDF fits to the combined e ± p cross section
3.5. IMPLICATIONS OF THE RESULTS ON PARTON DENSITY FUNCTIONS 27 measurements of the H1 and ZEUS collaborations [50] and to the ATLAS W ± and Z production cross section measurements in the HERAFitter framework [50, 61, 62]: one fit with the ratio of the s (¯ s) PDF and the ¯ d PDF set to 1 at the scale Q 2 = 1.9 GeV 2 , the other fit without that boundary condition [63]. Both fits describe the data well, the first fit has a χ 2 per degrees of freedom of 546.1/567 with 13 free parameters, the second of 538.4/565 with 15 free parameters. The ATLAS data favour the second fit which has a partial χ 2 of the ATLAS data of 33.9 for 30 data points compared to 44.5 for the first fit. This is also reflected in the comparisons of the differential W ± and Z boson production cross sections with the predictions using the PDF sets provided by the two fits (see Figure 3.10). The NNLO predictions using the two resulting PDF sets differ from each other by less than 2% and describe the dependence of the W production cross section on the absolute value of the pseudorapidity of the charged decay lepton and the dependence of the Z boson production cross section on the Z boson rapidity very well.
The unconstrainted strangeness PDF fit results in a strangness anti-down-quark ratio r s = 0.5(s + ¯ s)/ d ¯ = 1.00 +0.25 −0.28
at Q 2 = 1.9 GeV 2 and x = 0.023 (corresponding to x = 0.013 at Q 2 = M Z 2 ) where the error on r s is dominated by the statistical and systematic uncertainties of the W and Z boson cross section measurements. The ATLAS inclusive W and Z cross section measurements, therefore, disfavour strangeness suppression.
l| η
|
0 0.5 1 1.5 2 2.5
sfree/fixed
0.981
1.020 0.5 1 1.5 2 2.5
| [pb]lη/d|σd
500 550 600 650 700
L dt = 33-36 pb-1
∫
ν
ll
+ +→ W
= 7 TeV) s Data 2010 (
stat. uncertainty)
⊕ (uncorr. sys.
s epWZ fixed
s epWZ free
ATLAS
l| η
|
0 0.5 1 1.5 2 2.5
sfree/fixed
0.981
1.020 0.5 1 1.5 2 2.5
| [pb]lη/d|σd
350 400 450 500
L dt = 33-36 pb-1
∫
ν
ll
- -→ W
= 7 TeV) s Data 2010 (
stat. uncertainty)
⊕ (uncorr. sys.
s epWZ fixed s epWZ free
ATLAS
Z|
|y 0 0.5 1 1.5 2 2.5 3 3.5
sfree/fixed
0.981
1.020 0.5 1 1.5 2 2.5 3 3.5
| [pb]Z/d|yσd
60 80 100 120 140
L dt = 33-36 pb-1
∫
l
-l
+Z →
= 7 TeV) s Data 2010 (
stat. uncertainty) (uncorr. sys. ⊕
s epWZ fixed
s epWZ free
ATLAS
Figure 3.10: Comparison of the measured differential cross sections dσ(pp→W
+d|η +X→`
+ν
`+X)
`+
(left), dσ(pp→W
−d|η +X→`
−¯ ν
`+X)
`−
(middle), and dσ(pp→Z+X→`
+`
−+X)
d|y
Z| (right) with NNLO predci-
tions using the simultanous PDF fits with and withtout the strangeness constraint s d ¯ ¯ = 1
as described in the text. The error bars represent the statistical and uncorrelated system-
atic uncertainties added in quadrature while the theoretical curves are adjusted to the
correlated error shifts. [63]
28 CHAPTER 3. INCLUSIVE W/Z PRODUCTION
Chapter 4
Study of the production of W and Z bosons in association with jets
The pp collision data on which the results of the previous chapter are based allowed for a stringent test of the theoretical description of the production of W bosons in association with hadron jets [64]. A recent publication [65] of the measurement of the production cross section of Z bosons in association with jets with a much larger dataset of 4.6 fb −1 of pp collisions at √
s = 7 TeV confirms the findings of this study and provides more extensive tests of the theoretical predictions. The first part of this chapter therefore discusses only this study.
The final sections of this chapter are devoted to the production of W bosons in asso- ciation with heavy flavour jets. The production of W bosons with c quarks is sensitive to the strange quark parton density of the proton; the production of W bosons in association with bottom quark pairs tests the influence of large quark masses on perturbative QCD predictions.
4.1 Theoretical considerations
As already mentioned in the introduction and shown in Figure 1.1, W and Z bosons can be produced in association with a single parton, namely a gluon due to initial state radiation or a quark due to radiation of a W or Z boson. In the experiment, the parton appears as collimated jet of hadrons.
The theoretical prediction of this process requires special Monte-Carlo generation tech- niques. In order to generate weak gauge bosons in association with a single jet, the Monte- Carlo generators ALPGEN[66] and SHERPA[67] follow a two-step procedure. In the first step a weak gauge boson plus a parton is generated according to the LO amplitude for this process, the so-called “matrix element” prediction; in the second step soft gluons or gluons collinear with the parton are emitted. The emitted partons themselves can radiate soft and collinear gluons or decay into quark-antiquark pairs. The cascade which is created by this procedure is terminated when the momentum scale at which the gluon emission takes places gets so small that α S becomes so large that the partons get confined into hadrons.
The cascade is called the “parton shower”. Jets are created at generator level by applying the same jet reconstruction algorithms to the four-momenta of the constituents of the parton shower as to experimental data. SHERPA has its own parton shower models built in while ALPGEN uses HERWIG[57] for the parton shower. The cross sections predicted by the two generators for the production of weak gauge bosons in association with a jet
29
30 CHAPTER 4. W/Z + J ET S PRODUCTION can therefore differ slightly from each other.
The matrix element plus parton shower procedure may lead to more than one jet.
For a precise prediction of the rate of the production of weak bosons in association with more than one jet, however, one must use the matrix element for the production of gauge bosons in association with more than one parton. The second step of the parton shower generation needs some care because a certain fraction of jets may be generated in both the matrix element and the parton shower step. The strategy of the authors of the ALPGEN and SHERPA generators to avoid the double counting is to follow the two-step procedure, but then to employ algorithms on the generated multi-parton state such that the matrix element is used to produce hard and wide-angle emissions of partons and that the parton shower takes care of soft and collinear partons. The algorithms of ALPGEN and SHERPA are different, but can be shown to be equivalent when large data samples are produced [68]. ALPGEN and SHERPA employ matrix elements for up to five partons.
The BLACKHAT generator [69, 70, 71] provides NLO QCD predictions for the pro- duction of W and Z bosons in association with up to four partons. It is interfaced to SHERPA for the generation of parton showers. Double counting of jets is avoided by subtracting the O(α S ) parton shower terms from the NLO matrix element.
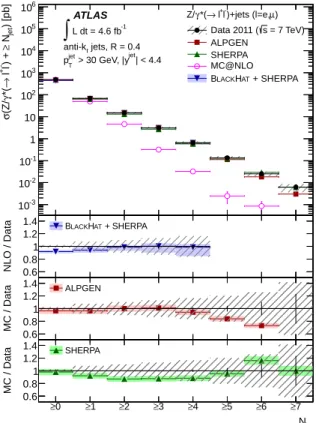
The ATLAS experiment’s measurement of the cross section for the production of Z bosons in association with jets as a function of the jet multiplicity [65] tests the theoretical predictions for the production of up to 7 jets.
4.2 Experimental conditions and event selection
4.2.1 Experimental conditions
The study of the production of Z bosons in association with jets published in [65] is based on 4.64 ± 0.08 fb −1 [72] of pp collisions data at √
s = 7 TeV recorded by the ATLAS experiment at the LHC in 2011. The LHC was operated in a mode which led to a pile- up level of on average 11.6 inelastic pp collisions per bunch crossing which is taken into account in the Monte-Carlo simulation samples used for the analysis of the experimental data.
4.2.2 Event selection
A di-electron trigger requiring at least two electrons with p T > 12 GeV and a single-muon trigger requiring at least one muon with p T > 18 GeV were employed to collect Z boson events. In the offline analysis pairs of oppositely charged electrons in |η| < 2.47 excluding 1.37 < |η| < 1.52 or muons with p T > 20 GeV in |η| < 2.4 are selected. The charged leptons have to be separated in space by ∆R `` > 0.2 and must have an invariant di-lepton mass m `` ∈ [66 GeV, 116 GeV]. The electron identification algorithms already reject non- isolated electrons to large extend such that no further isolation requirements are applied.
In order to reject muons from hadron decays in jets, the sum of the transverse momenta of charged particle tracks with p T > 1 GeV surrounding a muon in a cone of ∆R = 0.2 is required to be less than 10% of the muon p T .
The anti-k T algorithm [24] with a distance parameter R = 0.4 is used to combine clusters of energy depositions in the calorimeters to jets. Only jets with p T > 30 GeV,
|y| < 4.4, and distance ∆R > 0.5 to the Z boson’s decay leptons are considered in the
analysis. To reject jets which are not produced in the same pp collision as the Z boson, the
4.3. BACKGROUND PROCESSES TO THE Z + J PRODUCTION 31 sum of the transverse momenta of the tracks emerging from the vertex of the Z boson’s decay leptons and lying inside a given jet with |η| < 2.4 must exceed 75% of the p T of this jet.
In total 448,735 Z + j candidate events (191,566 Z → e + e + + ≥ 1j and 257,169 Z → µ + µ + + ≥ 1j ) fufil all selection requirements.
The systematic uncertainties on the measured cross sections are larger than their statistical uncertainties. The systematic uncertainties are dominated by the jet energy scale uncertainties which amount to about 4% to 9% relative cross section uncertainties.
The large energy scale uncertainties of jets with |y| & 3 translate into uncertainties of the elements of the unfolding matrices (see Section 4.4) of similar size. The second largest source of systematic uncertainties are the uncertainties on the electron and muon identification efficiencies. The total systematic uncertainties are about 5% for small jet transverse momenta and about 10% for large jet transverse momenta.
4.3 Background processes to the Z + j production
As explained in Section 3.3.2 processes creating events with pairs of oppositely charged electrons or muons in the final states or events with jets that are misidentified as electrons are the sources of background to the Z +j production. These are W → `ν, Z → τ + τ − , di- boson, t ¯ t, single top quark, and multijet production. W → `ν, Z → τ + τ − , and di-boson production will be referred to as “electroweak background”.
The size of the different background contributions are displayed in Figure 4.1. The contributions of the electroweak, top quark, and multijet processes to Z → ee and Z → µµ samples are almost of the same size. The contributions of the electroweak and multijet backgrounds are at per-cent level while, due to the presence of isolated leptons and two b quark jets, the t ¯ t background becomes the dominant source of background to events with at least 2 jets and reaches its maximum of about 30% for events with at least 7 jets.
Jet multiplicity
0 jets
≥ ≥1 jets≥2 jets≥3 jets≥4 jets≥5 jets≥6 jets≥7 jets
Background contribution [%]
10
-11 10 10
2→ee Z
µ µ Z→
- Electroweak - Top - Multijet
![Figure 3.4: Comparison of the measured W production cross sections in the electron and muon final states amongst each other and with theoretical predictions (according to [43]).](https://thumb-eu.123doks.com/thumbv2/1library_info/4018844.1541610/23.892.160.748.725.973/comparison-measured-production-sections-electron-theoretical-predictions-according.webp)
![Figure 3.6: Comparison of the total W ± and Z boson production cross sections with theoretical predictions based on different PDF sets [43].](https://thumb-eu.123doks.com/thumbv2/1library_info/4018844.1541610/24.892.490.747.788.1034/figure-comparison-total-production-sections-theoretical-predictions-different.webp)

![Figure 4.2: Average multiplicity of jets with p T > 30 GeV and |y| < 4.4 as a function of the Z boson p T [65]](https://thumb-eu.123doks.com/thumbv2/1library_info/4018844.1541610/33.892.285.603.112.429/figure-average-multiplicity-jets-t-gev-function-boson.webp)