ATLAS-CONF-2013-075 18July2013
ATLAS NOTE
ATLAS-CONF-2013-075
July 17, 2013
Search for associated production of the Higgs boson in the
W H→ WWW
(∗)→ `ν`ν`ν and Z H→ ZWW
(∗)→ ```ν`ν channels with the ATLAS detector at the LHC
The ATLAS Collaboration
Abstract
A search for the Higgs boson in the
W Hand
ZHassociated production modes, with
H→WW(∗)and all vector bosons decaying to electrons or muons, is performed using 20.7 fb
−1of proton-proton collision data at a centre-of-mass energy of 8 TeV collected in 2012 with the ATLAS detector at the CERN Large Hadron Collider. The 2012 result is combined with an earlier search for
W H→WWW(∗)→`ν`ν`νwith 4.7 fb
−1of data recorded at a centre-of- mass energy of 7 TeV. No significant excess is observed over the Standard Model expecta- tions, with or without a
mH=125 GeV Higgs boson. Limits at 95% confidence level on the cross section ratio to the Standard Model prediction are set for the mass interval 110 GeV
≤ mH ≤
200 GeV. The observed (expected) limits are determined to be 7.2 (3.6) times the Standard Model cross section for a Higgs boson of mass
mH=125 GeV.c
Copyright 2013 CERN for the benefit of the ATLAS Collaboration.
1 Introduction
In the Standard Model (SM) of particle physics, the Englert-Brout-Higgs [1–3] mechanism of elec- troweak symmetry breaking gives mass to all massive elementary particles and predicts the existence of a new scalar particle, the Higgs boson. In the summer of 2012, the ATLAS and CMS Collaborations at the CERN Large Hadron Collider (LHC) discovered a Higgs boson candidate with a mass of approxi- mately m
H=125 GeV [4, 5]. A more recent analysis of H→ WW
(∗)decay [6] has shown that the Higgs boson decays to a W boson pair with rates compatible with the SM expectation. The detailed studies of the couplings and properties of this new particle and comparison with the expectations for the SM Higgs boson are the current focus of the ATLAS Collaboration [7, 8].
Higgs boson production in the W H and ZH associated modes, which will collectively be referred to as the V H associated production, provides important information on the Higgs boson couplings to gauge bosons. In particular, in the W H associated production mode with H→ WW
(∗)decay, the Higgs boson couples only to W bosons. Searches for H→ WW
(∗)decay in V H production have been performed by the ATLAS and CMS Collaborations, and upper limits on the cross section have been set [9–11]. This note presents a search in the 2012 ATLAS data collected at
√s
=8 TeV for Higgs boson production in the V H mode with H→ WW
(∗)decay, where each W or Z boson decays leptonically. Only final states with elec- trons or muons are considered. For a SM Higgs boson with a mass of 125 GeV the expected cross section times branching ratios is 1.5 fb for W H→ WWW
(∗)→`ν`ν`νand 0.3 fb for ZH→ ZWW
(∗)→```ν`ν(with
`=
e, µ).
In the study of the W H production mode, which will be referred to as the 3-lepton analysis, the final event selection requires the identification of three leptons of total charge
±1 and missing transversemomentum. This analysis has also some acceptance for H→
ττdecay, as well as for ZH production with H→ WW
(∗). The result is combined with a previous search with 4.7 fb
−1of data collected in 2011 at
√
s
=7 TeV [9]. In the study of ZH production, which will be referred to as the 4-lepton analysis, the final event selection requires the identification of four leptons of total charge zero and missing transverse momentum. A combined V H search result is obtained by combining the 3-lepton and 4-lepton analyses.
The results are presented for Higgs boson masses between 110 and 200 GeV, although the selections are optimized for m
H=125 GeV.2 The ATLAS detector
The analysis described in this note uses data collected with the ATLAS detector [12] between April and December 2012 in proton-proton (pp) collisions at a centre-of-mass energy of 8 TeV. ATLAS is a multi- purpose particle physics detector with a forward-backward symmetric cylindrical geometry and near 4π coverage in solid angle, designed to measure the properties of particles produced in pp interactions.
It consists of an inner tracking detector surrounded by a thin 2 T superconducting solenoid, electro- magnetic and hadronic calorimeters and a muon spectrometer incorporating three large superconducting toroid magnets.
The inner detector covers pseudorapidities
1of
|η| <2.5 and consists of multiple layers of silicon pixel and strip detectors and a straw-tube transition radiation tracker. The calorimeter system covers the pseudorapidity range
|η|<4.9. Within the region
|η|<3.2, electromagnetic calorimetry is provided by barrel and endcap high-granularity lead/liquid-argon (LAr) calorimeters. An additional thin LAr pre- sampler covering
|η|<1.8 is used to correct for energy loss in the material upstream of the calorimeters.
1ATLAS uses a right-handed coordinate system with its origin at the nominal interaction point (IP) in the centre of the
Hadronic calorimetry is provided by a steel/scintillating-tile calorimeter, covering
|η|<1.7, and two cop- per
/LAr hadronic endcap calorimeters. The solid angle coverage is completed with forward copper
/LAr and tungsten/LAr calorimeter modules optimised for electromagnetic and hadronic measurements re- spectively. The muon spectrometer consists of separate trigger and high-precision tracking chambers that measure the deflection of muons in a magnetic field generated by superconducting air-core toroids.
The precision chamber system covers the region
|η| <2.7 with three stations of monitored drift tube layers, except for the forward region where the innermost stations are equipped with cathode strip cham- bers. The muon trigger system covers the range
|η|<2.4 with resistive plate chambers in the barrel and thin gap chambers in the endcap regions. A three-level trigger system is used. The first-level trigger is implemented in hardware, using a subset of detector information, and reduces the event rate to at most 75 kHz. This is followed by two software-based trigger levels, which together reduce the event rate to about 300 Hz.
3 Physics processes
This section presents the signal topology for both the 3-lepton and 4-lepton analyses. It also details the background processes and how they can be reduced. In both analyses, the sensitivity is enhanced by categorising the events depending on the number of same-flavour opposite-sign (SFOS) lepton pairs.
3.1 W H→ WWW
(∗)→ `ν`ν`ν phenomenology
The signature studied in this analysis (three leptons and high missing transverse momentum) is common to a number of physics processes, which represent the background to the W H signal. The backgrounds with three real isolated leptons are diboson production: W(Z/γ
∗), as well as ZZ
(∗)production with an undetected lepton; they cannot be reduced by the application of tight lepton identification criteria. These backgrounds are characterised by the presence of at least one pair of SFOS leptons. For this reason the analysis distinguishes events with a pair of SFOS leptons from events without any such pair, forming Z-enriched and Z-depleted samples, respectively. The Z-enriched sample contains 3
/4 of the signal, but suffers from the backgrounds listed above, while the Z-depleted sample contains only 1/4 of the signal but is affected mainly by backgrounds that are reducible through lepton identification criteria. The selection criteria are optimised separately for these two samples. At a significantly lower rate, but comparable to the signal, triboson production, in particular WWW
(∗), represents an irreducible background, while the associated production of t¯ t pairs with vector bosons can be reduced through a veto on b-tagged jets.
Final states with fewer than three prompt leptons and
/or without real missing transverse momentum may contribute to the background due to instrumental effects. Fake leptons include both jets which have been misidentified as leptons and real non-isolated leptons from light flavour, beauty and charm decays.
Background processes with two prompt leptons, such as WW , Z
+jets, t¯ t and Wt production, must be accompanied by a fake lepton to enter either the Z-enriched or Z-depleted samples. They can therefore be significantly reduced by isolation requirements on the three leptons. Final states with only one prompt lepton, such as W boson production or single top quarks produced through the s-channel or t-channel, would require two fake leptons and are strongly suppressed by isolation requirements.
Helicity conservation in the decay of the two W bosons from a scalar Higgs boson leads in general to a small opening angle between the leptons originating from the Higgs boson decay, while the lepton from the decay of the recoiling W boson tends to be at a large angle with respect to the other two. For this reason the leptons in the event are classified by identifying
`0as the lepton with unique charge,
`1as the lepton closer in
∆R
= p∆φ2+ ∆η2
to
`0, and
`2as the remaining one.
3.2 ZH→ ZWW
(∗)→ ```ν`ν phenomenology
The ZH→ ZWW
(∗)→```ν`νprocess has a final state consisting of four charged leptons and missing transverse momentum carried away by the neutrinos. The triboson processes with the same final state are the irreducible backgrounds. The t¯ tZ process can also produce four leptons and missing transverse momentum but can be reduced by requiring no b-tagged jets in the final state.
Processes containing fake leptons or fake missing transverse momentum can also contribute to the background. Diboson production of W(Z/γ
∗)+jets with the presence of a fake lepton gives the same topology as the signal but can be reduced through lepton identification criteria. The ZZ
(∗) →````process with fake missing transverse momentum (from mismeasured jets and/or leptons or due to multiple pp interactions (pile-up)) can also contribute. The ZZ
(∗)→````background is characterised by the fact that, when the Z boson does not decay into tau leptons, the final state consists of two pairs of same-flavour leptons. Therefore the distinction based on the number of SFOS pairs is crucial in the ZH analysis, as the sample containing only one same-flavour pair will suffer from a lower background contribution than the sample with two.
The reconstruction of the ZH→ ZWW
(∗)→```ν`νdecay proceeds through the identification of the two lepton candidates from the recoiling Z boson, hereafter called
`2and
`3, followed by the identification of the lepton candidates from the Higgs boson decay chain, labeled
`0and
`1.
4 Data and Monte Carlo samples
The data were selected using inclusive single-muon and single-electron triggers. The two main triggers require the transverse momentum of the lepton with respect to the beam line, p
T, to exceed 24 GeV and that the lepton is isolated: the scalar sum of the p
Tof charged particles within
∆R
=0.2 of the lepton direction is required to be less than 0.10 and 0.12 times the lepton p
Tfor electrons and muons, respectively. Auxiliary triggers for high p
Tsingle leptons without isolation requirement are also used.
The trigger efficiencies are measured as a function of p
T,
ηand data-taking period using leptonic Z decays. The e
fficiencies are approximately 95% for electrons and 90% (70%) for muons in the endcap (barrel) with respect to the o
ffline reconstructed leptons. Stringent detector and data quality requirements are applied, resulting in a data set corresponding to an integrated luminosity of 20.7 fb
−1. The uncertainty on the integrated luminosity is 3.6%; it is derived, following the methodology of Ref. [13], from a preliminary calibration from beam-separation scans performed in April 2012.
Monte Carlo (MC) simulated signal events are generated using P [14]. The signal cross sections
are then normalised to next-to-next-to-leading order (NNLO) calculations [15–17]. The Higgs boson
decay branching ratios are calculated with H
[18]. Except for the top samples produced at NLO
and the samples produced with P [19], the background samples are normalised to the LO cross
sections. For some of the background for which a control region can be built (WZ, ZZ, top, Z
+jets),the normalisation is then corrected using data. A
[20], interfaced to H
[21] using the MLM
matching scheme [22], is used to model the production of W and Z/γ
(∗)bosons in association with jets
(Drell-Yan). MC@NLO [23] with H
for the parton shower and hadronisation is used to model t¯ t
production. A
MC [24], using P
for showering and hadronisation, is used for the generation of
single top quark production in the t-channel, while MC@NLO interfaced to H is used for Wt and
s-channel production. The t¯ tW and t¯ tZ backgrounds are generated with M
G
[25, 26] interfaced to
P
. P
with P
is used for the generation of W(Z/γ
∗) production for the 4-lepton analysis as
well as ZZ
(∗)final states, including the low mass Z
(∗)/γ(∗)(with an off-shell photon) contribution, and for
WW production in both the 3- and 4-lepton analyses; an additional contribution to the WW background
m
γ∗ <7 GeV) and for triboson (VVV) production. A k-factor of 1.5 is introduced to account for NLO cross section correction [29] for the VVV background. M
G
is employed also for the generation of W(Z/γ
∗) (with m
γ∗ >7 GeV) production in the 3-lepton analysis. The different choice for the generators of the W(Z/γ
∗) process in the 3-lepton and 4-lepton analyses is dictated primarily by the need to correctly model the jet multiplicity distribution in the range of interest for each analysis. In the 3-lepton case, the background from W(Z/γ
∗) is mainly due to events with few jets and MG correctly predicts the relative ratio between events with zero and one jets and three good leptons. In the 4-lepton case, the background from W(Z/γ
∗) production contains one fake lepton, and, as the fake lepton rate increases with jet multiplicity, an accurate modelling of the high jet multiplicity region, where P shows a better agreement with data than M
G
, is important.
The CT10 parton distribution function (PDF) set [30] is used for the MC@NLO samples and the P samples; CTEQ6L1 [31] is used for the A, MG and P samples, with the A-
Z/γ
(∗)sample reweighted to the MRSTMCal [32] PDF set as this better models the lepton kinemat- ics [33]. Wherever parton showering is performed with H
, J
[34] is used for the simulation of the underlying event.
All simulated samples are generated with pile-up. The simulated events are re-weighted so that the distribution of the average number of interactions per crossing in the simulation matches that observed in data. The samples are then processed through the G
4 [35] simulation [36] and the reconstruction software of the ATLAS detector.
5 Object identification
Muons are reconstructed over the region
|η| <2.5 by combining tracks in the muon spectrometer and in the inner detector. Electrons are identified, within the region
|η| <2.47, through the association of an inner detector track to a cluster of energy deposits in the calorimeter whose shower profile is consistent with an electromagnetic shower [37]. To ensure good energy and position resolutions, electrons in the barrel - endcap transition region 1.37
< |ηcluster| <1.52 are discarded. Overlaps of electrons with other electrons or muons, which are defined as cases in which the distance
∆R between two objects is smaller than 0.1, are interpreted as duplicated reconstruction of the same physical object and are resolved by keeping the electron with the higher transverse energy in case of two electrons or the muon in case of electron-muon overlaps. If a muon overlaps with a jet in a cone with
∆R
=0.3, the muon is not considered as a lepton candidate for the analysis but its momentum is taken into account in the missing transverse momentum calculation. If an electron overlaps with a jet in a cone with
∆R
=0.3, the jet is discarded.
A vertex reconstructed from at least three well-reconstructed charged-particle tracks, each with p
T>400 MeV, is required in order to remove non-collision background and ensure good object reconstruction.
The vertex with the largest total p
2Tof the associated tracks is selected as primary vertex. To select leptons generated by the prompt decays of W or Z bosons, the absolute value of z
0×sin
θis required to be smaller than 0.4 mm for electrons and 1.0 mm for muons, where z
0is the longitudinal impact parameter of the track evaluated with respect to the reconstructed primary vertex. The choice of these values (0.4 mm for electrons and 1.0 mm for muons) is due to the requirement of matching the dilepton analysis [6]. The significance of the transverse impact parameter d
0, evaluated with respect to the reconstructed primary vertex, is required to be smaller than 3.
Small corrections, derived from measurements of J/ψ, Z and W decays in data, are applied to lepton identification efficiencies and to energy and momentum scale and resolution [37, 38].
The lepton isolation criteria have been optimised to maximise the significance for a Higgs boson of
mass 125 GeV produced in the V H associated modes. Both tracking and calorimeter information are
used and p
T-dependent cuts are applied to the scalar sum of the transverse momenta of tracks from the
primary vertex and to the scalar sum of the transverse energies measured in calorimeter cells within a
cone of
∆R
=0.2 around the lepton direction. In the 3-lepton analysis backgrounds with fake leptons are reduced by applying tighter identification and isolation criteria for the lowest p
Tlepton.
Jets are reconstructed over the region
|η|<4.5 using the anti-k
talgorithm [39] with radius parameter R
=0.4, based on three-dimensional topological clusters [40]. They are required to have p
Tlarger than 25 GeV except for the forward region,
|η|>2.4, in which the p
Tthreshold is raised to 30 GeV. All jets are required to pass a loose quality selection [41]. To reduce the impact of pile-up, for jets with p
T <50 GeV the p
Tfraction of tracks associated to the primary vertex within a given jet is required to be larger than 50%, except for jets with no associated tracks. A jet is identified as originating from a B-hadron (b-tagged) by looking for the characteristic topology of weak B-hadron decay chain inside the jet, for a secondary vertex or for tracks that have a significant impact parameter with respect to the primary vertex [42]. This information is combined into a single discriminating variable and a selection is applied that corresponds to an efficiency of 85% for b-jets with p
T>20 GeV and
|η|<2.5 in simulated t¯ t events, and to a rejection of ten against jets originating from light quarks or gluons.
The missing transverse momentum, E
Tmiss, is defined as the magnitude of the vector sum of the transverse momenta of the reconstructed objects [43]. These include muons, electrons, taus, photons and jets, as well as energy deposits which are not associated to any of them. The 3-lepton analysis uses the derived quantity E
T,relmiss, defined as
E
missT,rel=E
missTsin
∆φmin,(1)
with
∆φmin≡min(
∆φ,π2), where
∆φis the angle between the missing transverse momentum and the near- est lepton or jet which passes the selection criteria. The purpose of this modified definition is to reduce the impact of mismeasurements of high- p
Tleptons and jets on the total missing transverse momentum.
6 Event selection
The pre-selection requires events with a primary vertex in a position compatible with the luminous region.
Events are accepted if there is at least one successful match between a reconstructed lepton and an object responsible for a single-lepton trigger. For a successful match, muons and electrons reconstructed within a cone of
∆R
=0.15 around the triggering lepton are required to have p
T >25 GeV. Pre-selected data are then split into 3-lepton and 4-lepton samples, each of which is further subdivided into signal regions (SRs) and control regions (CRs). The latter are used to normalise the MC expectation to data.
6.1 3-lepton channel
Events must contain exactly three isolated leptons with p
T >15 GeV and total charge
±1, one of whichmust have p
T >25 GeV and be matched to the triggering lepton. This pre-selection removes backgrounds from inclusive W boson and b b ¯ pair production. The remaining backgrounds are classified as :
VVV: production of three vector bosons, in particular WWW which has the same signature as the signal;
VV : diboson production. This is dominated by W(Z/γ
∗) production, which has three real leptons and genuine E
Tmiss. Minor contributions arise from ZZ
(∗)production with one of the four leptons escaping detection, as well as WW production with one fake lepton and on-shell Wγ production with two fake leptons, typically from photon conversion;
Fake leptons: the main sources of background due to fake leptons are t¯ t, Wt and Z
+jets events, inwhich two real leptons plus a fake lepton mimic the signal signature; contributions come also
t¯ tV production, which contributes less than 1% of the total background, is included together with other top contributions in the “fake” category. Events are divided into Z-enriched and Z-depleted samples, according to the presence or absence of a SFOS lepton pair. The Z-enriched sample is further subdivided into eee
+µµµand eeµ
+µµewhich present a different ratio of signal over W(Z/γ
∗) background events, due to the di
fferent flavour combinations accessible in the final state.
In order to reduce the top background, events are then required to contain at most one jet with transverse momentum above 25 GeV, which should not be b-tagged. This requirement will be referred to as the b-veto. In order to select final states with transverse momentum from neutrinos, E
missT,relis required to be above 40 GeV for the Z-enriched sample and 25 GeV for the Z-depleted sample. Figure 1 compares the p
Tdistributions of the leptons in data to those expected from simulation before this cut, while Figure 2 presents the E
T,relmissdistributions.
The invariant mass m
``of all SFOS pairs is required to be at least 25 GeV away from the nominal Z mass. This requirement suppresses the W(Z/γ
∗) and ZZ
(∗)backgrounds and further reduces the Drell-Yan backgrounds. Figure 3 compares mass distributions of the two opposite-sign lepton pairs in Z-enriched data to the expectation from simulation before this cut. A lower cut is set on the invariant mass of opposite-sign leptons at 12 GeV, independently of their flavour, to reduce the Wγ
(∗)and any residual heavy-flavour backgrounds.
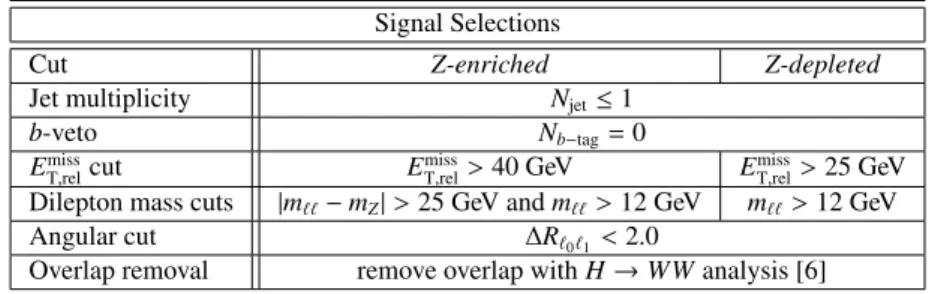
The angular separation between
`0and
`1,
∆R
`0`1, should be smaller than 2. This cut favours the Higgs boson decay topology over that of W(Z/γ
∗) events. Figure 4 compares
∆R
`0`1distributions in data to the expectation before this cut.
Finally, events selected by the dilepton H→ WW
(∗)search [6] are removed. Table 1 summarises the selection criteria and Table 2 the numbers of events surviving the various cuts in the data and in the signal and background MC samples. The background is dominated by the W(Z/γ
∗) component in the Z-enriched selections and by VVV, with contributions also from W(Z/γ
∗) and from top production, in the Z-depleted.
An excess of events with high E
missT,relis observed in the Z-depleted sample where the 9 events found in the data after all the selections have to be compared to an expectation of 2.7
±0.5 background events plus 0.88
±0.04 signal events for m
H=125 GeV. These events were carefully scrutinised and no detectore
ffect or other anomaly which could explain the discrepancy was found.
6.2 4-lepton channel
The events selected for the 4-lepton analysis contain exactly four isolated leptons with p
T >10 GeV and total charge zero, one of which must be matched to the triggering lepton. Events are classified according to the number (one or two) of SFOS lepton pairs. The pre-selection hence rejects events with no SFOS lepton pairs. The background processes are classified as:
Table 1: Summary of the selection criteria defining the 3-lepton signal regions.
Signal Selections
Cut Z-enriched Z-depleted
Jet multiplicity Njet≤1
b-veto Nb−tag=0
ET,relmisscut EmissT,rel>40 GeV ET,relmiss>25 GeV
Dilepton mass cuts |m``−mZ|>25 GeV andm``>12 GeV m``>12 GeV
Angular cut ∆R`0`1<2.0
Overlap removal remove overlap withH→WWanalysis [6]
[GeV]
lead
pT
20 40 60 80 100 120 140 160 180 200
Events / 10 GeV
100 200 300 400 500 600
700 Data Total bkg.
VVV VV
Fakes VH [125 GeV, ×20]
ATLAS Preliminary
L dt = 20.7 fb-1
∫
= 8 TeV, s
) enriched - Z 3-lepton (
(a)
[GeV]
sub
pT
20 40 60 80 100 120 140
Events / 10 GeV
100 200 300 400 500 600 700
800 Data Total bkg.
VVV VV
Fakes VH [125 GeV, ×20]
ATLAS Preliminary
L dt = 20.7 fb-1
∫
= 8 TeV, s
) enriched - Z 3-lepton (
(b)
[GeV]
third
pT
10 20 30 40 50 60 70 80 90 100
Events / 10 GeV
200 400 600 800 1000 1200
1400 Data Total bkg.
VVV VV
Fakes VH [125 GeV, ×20]
ATLAS Preliminary
L dt = 20.7 fb-1
∫
= 8 TeV, s
) enriched - Z 3-lepton (
(c)
Figure 1: Distributions of lepton p
Tin the 3-lepton Z-enriched sample: (a) leading lepton, (b) subleading lepton and (c) third lepton. The last bin contains the entries in overflow. Data (dots) are compared to background expectation from the simulation of the background components (stacked filled histograms).
Expectations for SM Higgs boson associated production with m
H=125 GeV are multiplied by a factor
20 and presented as a non-stacked unfilled histogram.
[GeV]
T,rel
Emiss
0 20 40 60 80 100 120 140
Events / 10 GeV
10-1
1 10 102
103
104
105 Data Total bkg.
VVV VV
Fakes VH [125 GeV, ×20]
ATLAS Preliminary
L dt = 20.7 fb-1
∫
= 8 TeV, s
) enriched - Z 3-lepton (
(a)
[GeV]
T,rel
Emiss
0 20 40 60 80 100 120
Events / 25 GeV
10-1
1 10 102
Data Total bkg.
VVV VV
Fakes VH [125 GeV, ×20]
ATLAS Preliminary
L dt = 20.7 fb-1
∫
= 8 TeV, s
) depleted - Z 3-lepton (
(b)
Figure 2: Distributions of E
T,relmissin the 3-lepton (a) Z-enriched and (b) Z-depleted samples after b-veto.
The last bin contains the entries in overflow. Data (dots) are compared to expectations from the sim- ulation of the background components (stacked filled histograms). Expectations for SM Higgs boson associated production with m
H=125 GeV are multiplied by a factor 20 and presented as a non-stacked unfilled histogram.
[GeV]
l1
l0
m 0 20 40 60 80 100 120 140 160 180
Events / 10 GeV
50 100 150 200 250
Data Total bkg.
VVV VV
Fakes VH [125 GeV, ×20]
ATLAS Preliminary
L dt = 20.7 fb-1
∫
= 8 TeV, s
) enriched - Z 3-lepton (
(a)
[GeV]
l2
l0
m 0 20 40 60 80 100 120 140 160 180
Events / 10 GeV
20 40 60 80 100 120 140 160 180
200 Data Total bkg.
VVV VV
Fakes VH [125 GeV, ×20]
ATLAS Preliminary
L dt = 20.7 fb-1
∫
= 8 TeV, s
) enriched - Z 3-lepton (
(b)
Figure 3: Distributions of the invariant mass of opposite-sign lepton pairs in the 3-lepton Z-enriched
sample after the cut on E
missT,rel: (a) for the pair with smaller
∆R and (b) for the pair with larger
∆R. The
last bin contains the entries in overflow. Data (dots) are compared to expectations from the simulation
of the background components (stacked filled histograms). Expectations for SM Higgs boson associated
production with m
H=125 GeV are multiplied by a factor 20 and presented as a non-stacked unfilled
histogram.
l1
l0
∆R
0 0.5 1 1.5 2 2.5 3
Events
10-1
1 10 102
Data Total bkg.
VVV VV
Fakes VH [125 GeV, ×20]
ATLAS Preliminary
L dt = 20.7 fb-1
∫
= 8 TeV, s
) enriched - Z 3-lepton (
(a)
l1
l0
∆R
0 0.5 1 1.5 2 2.5 3
Events
10-1
1 10
102 Data Total bkg.
VVV VV
Fakes VH [125 GeV, ×20]
ATLAS Preliminary
L dt = 20.7 fb-1
∫
= 8 TeV, s
) depleted - Z 3-lepton (
(b)
Figure 4: Distributions of
∆R
`0`1in the 3-lepton (a) Z-enriched and (b) Z-depleted samples after the invariant mass cuts. Data (dots) are compared to expectations from the simulation of the background components (stacked filled histograms). Expectations for SM Higgs boson associated production with m
H=125 GeV are multiplied by a factor 20 and presented as a non-stacked unfilled histogram.
Table 2: Number of expected events for the signal and the background, for an integrated luminosity of 20.7 fb
−1, and number of events observed in the data, as a function of the selection requirement (see Table 1).
VVV VV Fakes Total Bkg. V H(125) Data
3 leptons 19.5±0.5 2410±50 930±100 3370±150 18.53±0.25 3717 Z-enriched(eee+µµµ) 5.89±0.18 1228±23 380±40 1620±50 7.31±0.17 1711 Jet multiplicity andb-veto 4.79±0.19 1064±24 273±33 1350±50 4.85±0.13 1321
ET,relmisscut 2.51±0.13 241±6 12±7 256±12 1.72±0.07 252
Dilepton mass cuts 0.86±0.07 12.2±0.6 5±5 18±5 0.48±0.03 12
Angular cut 0.64±0.06 9.0±0.5 4±4 14±4 0.45±0.03 9
Overlap removal 0.63±0.06 8.7±0.5 4±4 14±4 0.42±0.03 8
Z-enriched(eeµ+µµe) 9.54±0.29 1180±29 530±90 1730±120 9.25±0.18 1968 Jet multiplicity andb-veto 7.97±0.29 1008±29 420±90 1440±120 6.56±0.14 1490
ET,relmisscut 4.24±0.19 219±7 12±6 235±12 2.37±0.08 247
Dilepton mass cuts 2.35±0.13 15.6±0.8 2.3±1.8 20.3±2.3 1.17±0.05 24 Angular cut 1.67±0.11 10.8±0.6 0.65±0.22 13.2±0.8 1.11±0.04 16 Overlap removal 1.56±0.11 10.1±0.6 0.50±0.20 12.2±0.7 1.04±0.04 16
Z-depleted 4.10±0.16 6.0±0.4 20±4 30±4 1.98±0.06 38
Jet multiplicity andb-veto 3.61±0.16 4.79±0.33 7±4 15±4 1.66±0.05 16
ET,relmisscut 2.42±0.12 1.82±0.20 0.8±0.4 5.0±0.6 1.05±0.04 12
Dilepton mass cut 2.40±0.12 1.81±0.20 0.8±0.4 5.0±0.6 1.01±0.04 12 Angular cut 1.54±0.09 0.86±0.14 0.8±0.4 3.2±0.5 0.92±0.04 10 Overlap removal 1.45±0.09 0.68±0.12 0.58±0.35 2.7±0.5 0.88±0.04 9
VVV: production of three vector bosons, in particular ZWW which has the same signature as the signal;
VV : diboson production dominated by Z(Z
(∗)/γ∗) production;
Fake leptons: the main sources of background due to fake leptons are W(Z/γ
∗)
+jets and Z
+jets with one or two fake leptons respectively; t¯ tW and WW
+jets with one or two fake leptons are includedin this category.
t¯ tZ production, which contributes less than 1% of the total background, is included together with other top contributions in the “fake” category.
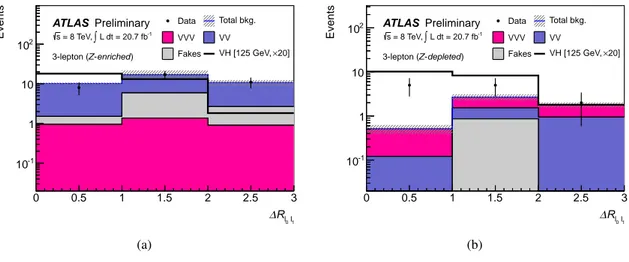
In order to select final states with neutrinos, E
missT, shown in Figure 5(a), is required to be above 30 GeV. The transverse momentum of the leading, sub-leading, 3
rdand 4
thleptons must be respectively above 25 GeV, 20 GeV, 15 GeV and 10 GeV. Figure 5(b) presents the distribution of the number of jets at the pre-selection level. In order to reduce the t¯ tZ background, events are required to contain at most one jet with p
T >25 GeV, which should not be b-tagged.
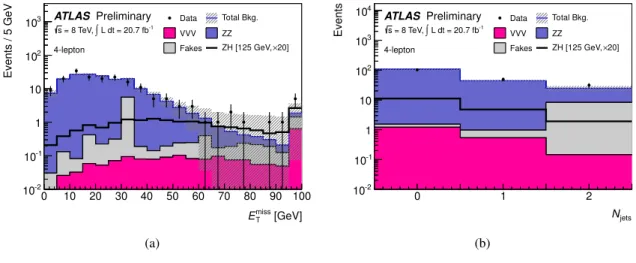
Figures 6(a) and 6(b) show the invariant masses of the two lepton pairs reconstructed in each event.
The invariant mass of
`2and
`3, m
`2`3, is required to be within 10 GeV of the Z boson pole, while the invariant mass of
`0and
`1, m
`0`1, is required to be between 10 GeV and 65 GeV. This selection excludes the Z mass region, which greatly suppresses the ZZ
(∗)background in events with two pairs of SFOS leptons. The lower cut on m
`0`1at 10 GeV mainly reduces the low mass contribution from the ZZ
(∗)/γ(∗)background.
[GeV]
T
Emiss
0 10 20 30 40 50 60 70 80 90 100
Events / 5 GeV
10-2
10-1
1 10 102
103 Data Total Bkg.
VVV ZZ
Fakes ZH [125 GeV, ×20]
ATLAS Preliminary
L dt = 20.7 fb-1
∫
= 8 TeV, s 4-lepton
(a)
Njets
0 1 2
Events
10-2
10-1
1 10 102
103
104 Data Total Bkg.
VVV ZZ
Fakes ZH [125 GeV, ×20]
ATLAS Preliminary
L dt = 20.7 fb-1
∫
= 8 TeV, s 4-lepton
(b)
Figure 5: Distributions at the pre-selection stage of the 4-lepton analysis: (a) E
missTand (b) number of jets with p
T >25 GeV. Data (dots) are compared to expectations from the simulation of the background components (stacked filled histograms). Expectations for the SM Higgs boson associated production with m
H=125 GeV are multiplied by a factor 20 and presented as a non-stacked unfilled histogram.
In the Higgs boson rest frame, the two charged leptons coming from the W boson decays tend to have a small angle due to the spin correlation in a scalar particle decay and the V-A nature of the W coupling.
This frame cannot be reconstructed due to the presence of neutrinos but the transverse Higgs boson frame
can be defined using the reconstructed Z boson p
Tunder the assumption that
~p
HT ∼ −~p
ZT. In the presence
of a reconstructed jet, the transverse momentum of the Higgs boson is estimated as
~p
HT ∼ −~p
ZT−~p
jetT. An
upper cut at 2.5 on the absolute difference in azimuthal angle between the two leptons from the Higgs
boson candidate in this frame,
∆φboost01, shown in Figure 6(c), is used to improve the sensitivity of the
search.
[GeV]
l1
l0
m 0 20 40 60 80 100 120 140 160 180 200
Events / 10 GeV
10-2
10-1
1 10 102
103
Data Total Bkg.
VVV ZZ
Fakes ZH [125 GeV, ×20]
ATLAS Preliminary
L dt = 20.7 fb-1
∫
= 8 TeV, s 4-lepton
(a)
[GeV]
l3
l2
m
60 70 80 90 100 110 120
Events / 5 GeV
10-2
10-1
1 10 102
103
104 Data Total Bkg.
VVV ZZ
Fakes ZH [125 GeV, ×20]
ATLAS Preliminary
L dt = 20.7 fb-1
∫
= 8 TeV, s 4-lepton
(b)
boost
φ01
∆
0 0.5 1 1.5 2 2.5 3
Events / 0.1575
10-2
10-1
1 10 102
103 Data Total Bkg.
VVV ZZ
Fakes ZH [125 GeV, ×20]
ATLAS Preliminary
L dt = 20.7 fb-1
∫
= 8 TeV, s 4-lepton
(c)
[GeV]
l
pT4
0 20 40 60 80 100 120 140 160 180 200
Events / 10 GeV
10-2
10-1
1 10 102
103
Data Total Bkg.
VVV ZZ
Fakes ZH [125 GeV, ×20]
ATLAS Preliminary
L dt = 20.7 fb-1
∫
= 8 TeV, s 4-lepton
(d)
Figure 6: Distributions at the pre-selection stage of the 4-lepton analysis: (a) invariant mass of
`0and
`1
, (b) invariant mass of
`2and
`3, (c)
∆φboost01and (d) p
T4`. Data (dots) are compared to expectations
from the simulation of the background components (stacked filled histograms). Expectations for the SM
Higgs boson associated production with m
H=125 GeV are multiplied by a factor 20 and presented as a
non-stacked unfilled histogram.
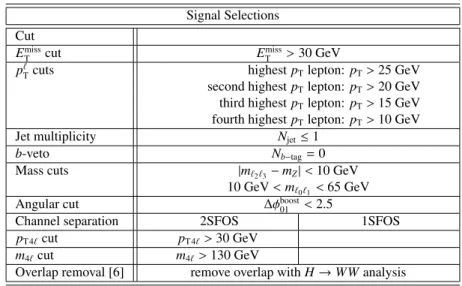
Table 3: Summary of the selection criteria defining the 4-lepton signal regions.
Signal Selections Cut
EmissT cut EmissT >30 GeV
p`Tcuts highestpTlepton: pT>25 GeV second highestpTlepton: pT>20 GeV third highestpTlepton: pT>15 GeV fourth highestpTlepton: pT>10 GeV
Jet multiplicity Njet≤1
b-veto Nb−tag=0
Mass cuts |m`2`3−mZ|<10 GeV 10 GeV<m`0`1<65 GeV
Angular cut ∆φboost01 <2.5
Channel separation 2SFOS 1SFOS
pT4`cut pT4`>30 GeV
m4`cut m4`>130 GeV
Overlap removal [6] remove overlap withH→WWanalysis
The magnitude of the vector sum of the lepton four-momenta (p
T4`) can discriminate between the signal and the main background, ZZ
(∗), in the 2SFOS case, as shown in Figure 6(d). A p
T4` >30 GeV cut improves the sensitivity of the search. Requiring the invariant mass of the four leptons to be above 130 GeV removes the overlap with the search for H
→ZZ
(∗)→4` [44, 45]. Events found in the search for H
→WW
∗→`ν`ν[6] are removed as well from both the data and MC samples. Table 3 summarises the selection criteria.
Table 4 shows the number of selected events for the signal and background MC samples. A the end of the selection, no signal other than ZH
→ZWW
(∗)contributes. Therefore, in the following steps, only the ZH signal is considered.
Table 4: Number of expected events for the signal and the background, for an integrated luminosity of 20.7 fb
−1, and number of events observed in the data, as a function of the selection requirement (see Table 3).
ZZ VVV Fakes Total Bkg. V H(125) Data
4 leptons 164±6 1.89±0.08 8.8±5.8 175±10 0.89±0.04 182 EmissT andpT 41.8±1.6 1.65±0.07 7.8±5.3 51.3±5.6 0.71±0.03 55 Jet multiplicity andb-veto 30.8±1.1 1.30±0.06 0.31±0.11 32.5±1.2 0.52±0.02 35 Mass cuts 2.97±0.15 0.22±0.02 0.05±0.03 3.24±0.16 0.41±0.02 2 Angular cut 1.88±0.12 0.20±0.02 0.04±0.02 2.12±0.12 0.39±0.02 2 1 SFOS pair 0.24±0.04 0.08±0.01 0.00±0.01 0.33±0.05 0.19±0.01 2 Overlap removal 0.23±0.04 0.08±0.01 0.00±0.01 0.32±0.05 0.18±0.01 2 2 SFOS pairs 1.64±0.11 0.12±0.01 0.04±0.02 1.79±0.11 0.20±0.01 0 4`system cuts 0.72±0.07 0.11±0.01 0.04±0.02 0.86±0.08 0.18±0.01 0 Overlap removal 0.70±0.07 0.10±0.01 0.04±0.02 0.84±0.08 0.17±0.01 0
7 Control samples
CRs are defined to validate the prediction from simulation in a phase space disjoint from but close to the signal phase space and to normalise some of the backgrounds estimated using data.
7.1 3-lepton channel
Background contributions to final states with three isolated leptons in the Z-enriched selection are mainly due to W(Z/γ
∗), ZZ
(∗), Z
+jets and top production. ZZ
(∗)contributes both through two bosons decaying in two leptons each and through the process Z
→ ``γ∗ →4`. In order to verify the modelling of these components in the simulation, CRs are defined with selections aimed at ensuring high purity for the background under study and orthogonality between the control and signal regions. Three CRs are built to directly normalise the three major backgrounds, W(Z/γ
∗), Z
+jets and top production, while an additional CR (consisting almost entirely of ZZ
(∗)and Z
+jets events) is defined to constrain the largeZZ
(∗)contribution to the Z
+jets sample.
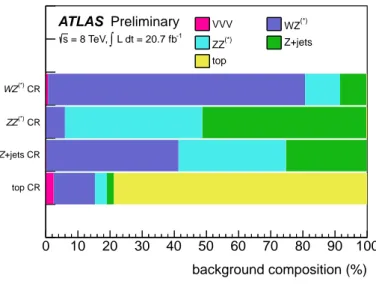
Table 5 summarises the selections defining the CRs and Figure 7 details the expected composition in each CR.
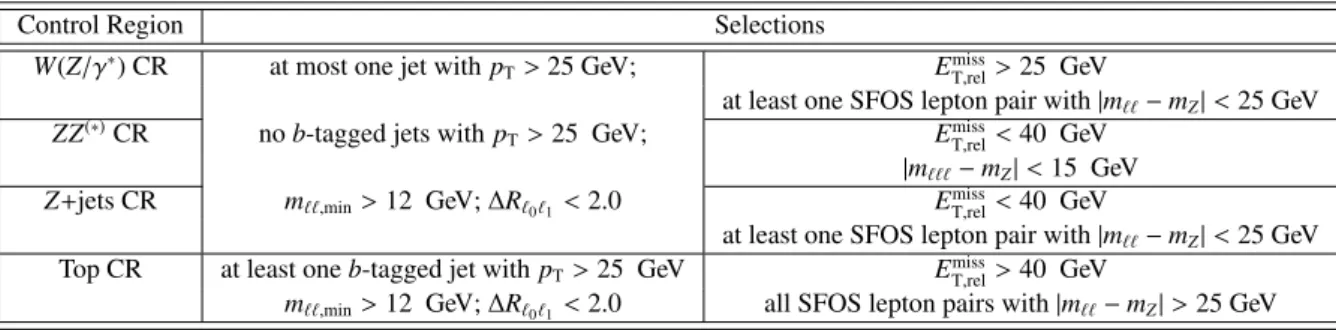
Table 5: Summary of selections defining the CRs for the Z-enriched sample of the 3-lepton analysis.
Control Region Selections
W(Z/γ∗) CR at most one jet withpT>25 GeV; ET,relmiss>25 GeV
at least one SFOS lepton pair with|m``−mZ|<25 GeV ZZ(∗)CR nob-tagged jets withpT>25 GeV; ET,relmiss<40 GeV
|m```−mZ|<15 GeV Z+jets CR m``,min>12 GeV;∆R`0`1<2.0 ET,relmiss<40 GeV
at least one SFOS lepton pair with|m``−mZ|<25 GeV Top CR at least oneb-tagged jet withpT>25 GeV ET,relmiss>40 GeV
m``,min>12 GeV;∆R`0`1<2.0 all SFOS lepton pairs with|m``−mZ|>25 GeV
background composition (%) 0 10 20 30 40 50 60 70 80 90 100
top CR +jets CR Z
(*) CR ZZ
(*) CR WZ
VVV WZ(*)
ZZ(*) Z+jets top
ATLAS Preliminary
L dt = 20.7 fb-1
∫
= 8 TeV, s
Figure 7: 3-lepton channel: expected background composition in each CR. Only the major background
sources are shown. The contributions from other backgrounds and the V H signal are expected to be well
below 1% in the W(Z/γ
∗), ZZ
(∗)and Z
+jets CRs, and at the level of 1% in the top CR.
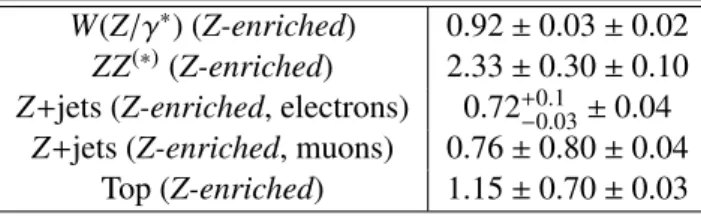
Table 6: 3-lepton channel: normalisation factors for the main backgrounds as obtained from the CRs.
The statistical and systematic uncertainties are quoted, in this order.
W(Z/γ
∗) (Z-enriched) 0.92
±0.03
±0.02 ZZ
(∗)(Z-enriched) 2.33
±0.30
±0.10 Z
+jets (Z-enriched, electrons) 0.72
+−0.030.1 ±0.04
Z
+jets (Z-enriched, muons)0.76
±0.80
±0.04 Top (Z-enriched) 1.15
±0.70
±0.03
Table 7: 3-lepton channel: the number of observed events in data for the CRs compared to the total number of expected events normalised by the factors given in Table 6 (indicated here as “MC”). All the CRs contain a SFOS pair. The quoted uncertainties include both statistical and systematic uncertainties.
Data MC Data/MC VVV WZ∗ WW ZZ∗ Z+jets Top
WZ∗CR 439 438±24 1.00±0.07 2.95±0.13 350±10 0.21±0.12 48±4 36±13 0.8±0.4 ZZ∗CR 244 210±40 1.15±0.23 0.25±0.04 12.3±0.7 0.05±0.05 90±4 110±40 0.57±0.29 Z+jets CR 828 860±40 0.96±0.06 1.7±0.1 351±9 0.02±0.04 290±10 216±30 0.50±0.34 Top CR 6 6.2±1.1 1.0±0.4 0.15±0.04 0.78±0.31 0.00±0.00 0.23±0.08 0.13±0.13 4.8±0.8
Since the features of the Z
+jets background are expected to be di
fferent when the additional fake lepton is an electron or a muon, two distinct normalization factors have been introduced. They apply separately to events with the flavour combinations
``` = µµe+eee and
``` = µµµ+eeµ. Due to the limited size of the data sample, it was not possible to apply the same distinction in the t¯ t background treatment. The normalisation factors are computed by a
χ2minimisation of the differences between the number of events in MC and data in all four CRs. Table 6 summarises the results. Systematic uncertainties are obtained from simulated samples produced with di
fferent parameters than the nominal samples, as discussed in Section 8.
In the 3-lepton analysis, the ZZ
(∗)background contributes when one of the leptons is not detected.
The MC sample used has a cut requiring the Z
∗mass to be above 4 GeV. A large contribution from very low mass Z
∗/γ∗, a phase space in which there is a high probability to lose a lepton, is therefore not included, which explains the large normalisation factor derived for this sample.
Table 7 presents the number of events in the four CRs in data, the expected background composition after the application of the normalisation factors described in Table 6, and the expected signal contam- ination. Figure 8 presents comparisons between data and simulation for several distributions after the normalisation in the five CRs.
The normalisation of these four main backgrounds, W(Z/γ
∗), Z
+jets, top and ZZ
(∗)production, for
the Z-depleted sample are assumed to be the same as for the Z-enriched sample. For the top production
background this choice is dictated by the larger number of events available in the sample with SFOS
pairs than without.
Events / 10 GeV
20 40 60 80 100 120 140
160 Data Total bkg.
VVV VV
Fakes VH [125 GeV, ×20]
ATLAS Preliminary L dt = 20.7 fb-1
∫
= 8 TeV, s
(*) CR) WZ 3-lepton (
[GeV]
l1
l0
m
20 40 60 80 100 120
0 0.5 1 1.5 2
Data / MC
(a)
Events/10GeV
20 40 60 80 100 120 140 160 180
200 Data Total bkg.
VVV VV
Fakes VH [125 GeV,×20]
ATLAS Preliminary L dt = 20.7 fb-1
∫
= 8 TeV, s
(*)CR) ZZ 3-lepton (
[GeV]
mlll
0 50 100 150 200 250 300 350 400 0
0.5 1 1.5 2
Data/MC
(b)
Events / 10 GeV
50 100 150 200 250
Data Total bkg.
VVV VV
Fakes VH [125 GeV, ×20]
ATLAS Preliminary L dt = 20.7 fb-1
∫
= 8 TeV, s
+jets CR) Z 3-lepton (
[GeV]
l1
l0
m
20 40 60 80 100 120
0 0.5 1 1.5 2
Data / MC
(c)
Events
10-1
1 10
Data Total bkg.
VVV VV
Fakes VH [125 GeV, ×20]
ATLAS Preliminary L dt = 20.7 fb-1
∫
= 8 TeV, s
3-lepton (Top CR)
Njets
1 2 3 4 5 6 7
Data / MC
0 0.5 1 1.5 2
Data / MC
(d)