ATLAS-CONF-2012-092 07July2012
ATLAS NOTE
ATLAS-CONF-2012-092
July 6, 2012
Observation of an excess of events in the search for the Standard Model Higgs boson in the H → ZZ
(∗)→ 4` channel with the ATLAS detector
The ATLAS Collaboration
Abstract
This note presents a search for the Standard Model Higgs boson in the decay channel H → ZZ
(∗)→ `
+`
−`
0+`
0−, where `, `
0= e or µ, using 4.8 fb
−1and 5.8 fb
−1of proton-proton collisions at √
s = 7 TeV and 8 TeV, respectively, recorded with the ATLAS detector.
The four-lepton invariant mass distribution is compared with Standard Model background expectations to derive upper limits on the cross section of a Standard Model Higgs boson with a mass between 110 GeV and 600 GeV. The mass ranges 131 − 162 GeV and 170−
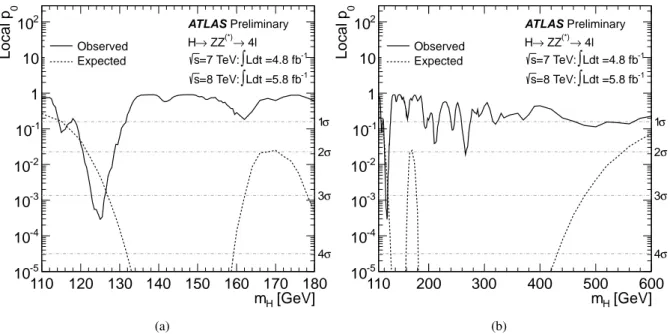
460 GeV are excluded at the 95% confidence level, while the expected exclusion ranges at the 95% confidence level are 124 − 164 GeV and 176 − 500 GeV. An excess of events is observed around m
H= 125 GeV, whose local p
0value is 0.029% (3.4 standard deviations) in the combined analysis of the two datasets.
c Copyright 2012 CERN for the benefit of the ATLAS Collaboration.
Reproduction of this article or parts of it is allowed as specified in the CC-BY-3.0 license.
1 Introduction
The Higgs mechanism in the context of the Standard Model (SM) is the source of electroweak symmetry breaking and results in the appearance of the Higgs boson [1–3], which remains the only unobserved particle of the Standard Model. Direct searches performed at the CERN Large Electron-Positron Collider (LEP) excluded at 95% confidence level (CL) the production of a SM Higgs boson with mass, m
H, less than 114.4 GeV [4]. The searches at the Fermilab Tevatron p p ¯ collider have excluded at 95% CL the region 147 GeV < m
H< 179 GeV [5]. At the LHC, the ATLAS experiment using 4.9 fb
−1of data at
√ s = 7 TeV collected in 2011 [6] has excluded [7] the m
Hregions 112.9− 115.5 GeV, 131− 238 GeV and 251− 466 GeV at the 95% CL. The CMS results [8] based to up to 4.8 fb
−1of data have excluded at the 95% CL the m
Hrange 127−600 GeV [9].
The search for the SM Higgs boson through the decay H → ZZ
(∗)→ `
+`
−`
0+`
0−, where `, `
0= e or µ, provides good sensitivity over a wide mass range. The largest background to this search comes from continuum (Z
(∗)/γ
∗)(Z
(∗)/γ
∗) production, referred to as ZZ
(∗)hereafter. For low masses, there are also important background contributions from Z + jets and t¯ t production, where the additional charged lepton candidates arise either from decays of hadrons with b- or c-quark content or from mis-identification of jets. Previous results from ATLAS in this channel [6] excluded the mass regions 134 − 156 GeV, 182− 233 GeV, 256−265 GeV and 268− 415 GeV at 95% CL with 4.8 fb
−1of √
s = 7 TeV data. The corresponding search from CMS [8] excluded at 95% CL the mass regions 134−158 GeV, 180−305 GeV and 340− 465 GeV.
This note updates the results presented in Ref. [6], with a new analysis of the √
s = 7 TeV data corresponding to an integrated luminosity of 4.8 fb
−1collected in 2011, combined with the first analysis of √
s = 8 TeV data corresponding to an integrated luminosity of 5.8 fb
−1collected between April and June 2012 [10, 11]. The analysis selection has been optimised with respect to the one described in Ref. [6] to enhance the sensitivity to a low mass Higgs boson. The √
s = 8 TeV data analysis benefits from substantial improvements in the electron reconstruction and identification compared to the one used for the √
s = 7 TeV data, which have not yet been reprocessed to take advantage of these improvements.
In the following, the ATLAS detector is briefly described in Section 2, and the signal and background simulation is presented in Section 3. The analysis of the √
s = 8 TeV data collected between March and June 2012 is discussed in Section 4 and that of the √
s = 7 TeV data collected in 2011 is described in Section 5. After a description of the systematic uncertainties in Section 6, Section 7 presents the result of the combined analysis of the two datasets.
2 The ATLAS Detector
The ATLAS detector [12] is a multi-purpose particle physics detector with approximately forward- backward symmetric cylindrical geometry
1. The inner tracking detector (ID) [13] covers |η| < 2.5 and consists of a silicon pixel detector, a silicon micro-strip detector, and a transition radiation tracker. The ID is surrounded by a thin superconducting solenoid providing a 2 T axial magnetic field. A high- granularity lead/liquid-argon (LAr) sampling calorimeter [14] measures the energy and the position of electromagnetic showers with |η| < 3.2. LAr sampling calorimeters are also used to measure hadronic showers in the end-cap (1.5 < |η| < 3.2) and forward (3.1 < |η| < 4.9) regions, while an iron/scintillator tile calorimeter [15] measures hadronic showers in the central region (|η| < 1.7). The muon spectrometer (MS) [16] surrounds the calorimeters and consists of three large superconducting air-core toroid magnets,
1ATLAS uses a right-handed coordinate system with its origin at the nominal interaction point. Thez-axis is along the
each with eight coils, a system of precision tracking chambers (|η| < 2.7), and fast tracking chambers for triggering. A three-level trigger system [17] selects events to be recorded for offline analysis.
3 Signal and Background Simulation
The H → ZZ
(∗)→ 4` signal is modelled using the P Monte Carlo (MC) event generator [18, 19], which calculates separately the gluon fusion and vector-boson fusion production mechanisms with matrix elements up to next-to-leading order (NLO). The Higgs boson transverse momentum ( p
T) spectrum in the gluon fusion process follows the calculation of Ref. [20], which includes QCD corrections up to NLO and QCD soft-gluon re-summations up to next-to-next-to-leading logarithm (NNLL). P is interfaced to P [21, 22] for showering and hadronization, which in turn is interfaced to P [23, 24] for quantum electrodynamics (QED) radiative corrections in the final state. P is used to simulate the production of a Higgs boson in association with a W or a Z boson.
The Higgs boson production cross sections and decay branching ratios, as well as their uncertain- ties, are taken from Refs. [25, 26]. The cross sections for the gluon-fusion process have been calculated to next-to-leading order (NLO) [27–29], and next-to-next-to-leading order (NNLO) [30–32] in QCD.
In addition, QCD soft-gluon re-summations calculated in the next-to-next-to-leading log (NNLL) ap- proximation are applied for the gluon-fusion process [33]. NLO electroweak (EW) radiative corrections are also applied [34, 35]. These results are compiled in Refs. [36–38] assuming factorisation between QCD and EW corrections. The cross sections for vector-boson fusion processes are calculated with full NLO QCD and EW corrections [39–41], and approximate NNLO QCD corrections are available [42].
The cross sections for the associated WH/ZH production processes are calculated at NLO [43] and at NNLO [44] in QCD, and NLO EW radiative corrections [45] are applied.
The Higgs boson decay branching ratios [46] to the different four-lepton final states is provided by P4 [47, 48], which includes the complete NLO QCD+EW corrections, interference effects between identical final-state fermions, and leading two-loop heavy Higgs boson corrections to the four- fermion width. Table 1 gives the production cross sections and branching ratios for H → ZZ
(∗)→ 4`, which are used to normalise the signal MC, for several Higgs boson masses.
The QCD scale uncertainties for m
H= 125 GeV [25] amount to
+7−8% for the gluon-fusion process and ±1% for the vector-boson fusion and associated WH/ZH production processes. The uncertainty of the production cross section due to uncertainties of the parton distribution function (PDF) and α
sis
±8% for gluon-initiated processes and ±4% for quark-initiated processes, estimated by following the prescription in Ref. [49] and by using the PDF sets of CTEQ [50], MSTW [51] and NNPDF [52].
The PDF uncertainties are assumed to be 100% correlated among processes with identical initial states, regardless of these being signal or background [49–53].
The cross section calculations do not take into account the width of the Higgs boson, which is imple- mented through a relativistic Breit-Wigner line shape applied at the event-generator level. In the absence of a full calculation, the possible size of such effects is included as an extra signal normalisation system- atic uncertainty for m
H≥ 300 GeV, on top of the one presented in Table 1, following a parametrisation as a function of m
H: 150% × m
3H[TeV] [26].
The ZZ
(∗)continuum background is modelled using P [54] for quark-antiquark annihilation
and gg2ZZ [55] for gluon fusion, normalised to the prediction [56]. The QCD scale uncertainty
has a ±5% effect on the expected ZZ
(∗)background, and the effect due to the PDF and α
suncertainties
is ±4% (±8%) for quark-initiated (gluon-initiated) processes. In addition, the shape uncertainty of the
four-lepton invariant mass spectrum has been assigned as discussed in Ref. [26]. For the simulation of
τ lepton decays T [57, 58] is used. The Z + jets production is modelled using A [59] and is
divided into two sources: Z + light jets, which includes Zc¯ c in the massless c-quark approximation and
Zb b ¯ from parton showers, and Zb b ¯ using matrix element calculations that take into account the b-quark
Table 1: Higgs boson production cross sections for gluon fusion, vector-boson fusion and associated production with a W or Z boson in pp collisions at √
s of 7 TeV and 8 TeV [25]. The quoted uncer- tainties correspond to the total theoretical systematic uncertainties. The production cross section for the associated production with a W or Z boson is negligibly small for m
H> 300 GeV. The decay branching ratio for H → 4`, with ` = e or µ, is reported in the last column [25].
mH σ(gg→H) σ(qq0→Hqq0) σ(q¯q→WH) σ(q¯q→ZH) BR
H→ZZ(∗)→4`
[GeV] [pb] [pb] [pb] [pb] [10−3]
√s=7 TeV
125 15.3+3.0−2.3 1.21±0.03 0.57+0.02−0.03 0.32±0.02 0.13 130 14.1+2.7−2.1 1.15±0.03 0.50±0.02 0.28±0.01 0.19 190 5.9+1.0−0.9 0.69±0.02 0.125±0.005 0.074±0.004 0.94
400 2.03+0.32−0.33 0.162+0.009−0.005 − − 1.21
600 0.37±0.06 0.058+0.005−0.002 − − 1.23
√s=8 TeV
125 19.5±2.9 1.56+0.04−0.05 0.70±0.03 0.39±0.02 0.13
130 18.1±2.6 1.49±0.04 0.61±0.03 0.35±0.02 0.19
190 7.9±1.1 0.91+0.03−0.02 0.156±0.007 0.094±0.006 0.94
400 2.9±0.4 0.25±0.01 − − 1.21
600 0.5±0.1 0.097±0.004 − − 1.23
mass. The MLM [60] matching scheme is used to remove any double counting of identical jets produced via the matrix element calculation and the parton shower, but this scheme is not implemented for b-jets.
Therefore, b b ¯ pairs with separation ∆R = q
(∆φ)
2+ (∆η)
2> 0.4 between the b-quarks are taken from the matrix-element calculation, whereas for ∆R < 0.4 the parton-shower b b ¯ pairs are used. In this search the Z + jets background is normalised using control samples from data. For comparison between data and simulation, the QCD NNLO [61, 62] and cross section calculations are used for inclusive Z boson and Zb b ¯ production, respectively. The t t ¯ background is modelled using MC@NLO [63] and is normalised to the approximate NNLO cross section calculated using [64]. The effect of the QCD scale uncertainty of the cross section is
+4−9%, while the effect of PDF and α
suncertainties is ±7%. Both A and MC@NLO are interfaced to H [65] for parton shower hadronization and to J [66]
for the underlying event simulation.
Generated events are fully simulated using the ATLAS detector simulation [67] within the G4 framework [68]. Additional pp interactions in the same and nearby bunch crossings (pile-up) are in- cluded in the simulation. The MC samples are re-weighted to reproduce the observed distribution of the mean number of interactions per bunch crossing in the data.
4 Analysis of √
s = 8 TeV data
The data are subjected to quality requirements: events recorded during periods when the relevant detector components were not operating normally are rejected. The resulting integrated luminosity is 5.8 fb
−1. 4.1 Lepton Reconstruction/Identification and Event Selection
The data considered in this analysis are selected using single-lepton or di-lepton triggers. For the single-
for each muon or p
T1= 18 GeV, p
T2= 8 GeV in the case of the asymmetric di-muon trigger, while for the di-electron triggers the thresholds are E
T= 12 GeV for each electron.
Electron candidates consist of clusters of energy deposited in the electromagnetic calorimeter that are associated to ID tracks. For the 2012 LHC data taking, the electron reconstruction algorithm has been improved with respect to 2011, improving the performance at low p
T. The ATLAS track pattern recognition and fit procedure were updated to account for energy losses due to bremsstrahlung, and the track-to-cluster matching algorithm was improved to be less sensitive to bremsstrahlung losses. Further- more, all tracks associated to electromagnetic clusters are re-fitted using a Gaussian-Sum Filter [69], which allows for bremsstrahlung energy losses.
Electron candidates must have a well-reconstructed ID track pointing to the corresponding clus- ter, and the cluster should satisfy a set of identification criteria [70] that requires the longitudinal and transverse shower profiles to be consistent with those expected for electromagnetic showers. These iden- tification criteria were optimised to maintain good performance in high pile-up conditions, and to take advantage of the new electron reconstruction. The electron transverse momentum is computed from the cluster energy and the track direction at the interaction point.
Muon candidates are formed by matching reconstructed ID tracks with either complete or partial tracks reconstructed in the MS [71]. If a complete track is present, the two independent momentum measurements are combined; otherwise the momentum is measured using the ID or the MS information alone. The muon reconstruction/identification coverage is extended by using tracks reconstructed in the forward region (2.5 < |η| < 2.7) of the MS, which is outside the ID coverage. In the centre of the barrel region (|η| < 0.1), which lacks MS geometrical coverage, ID tracks with p
T> 15 GeV are identified as muons using the profile of the associated energy deposits in the calorimeter.
This analysis searches for Higgs boson candidates by selecting two same-flavour, opposite-sign lep- ton pairs in an event. The impact parameter of the leptons along the beam axis is required to be within 10 mm of the reconstructed primary vertex. To reject cosmic rays, muon tracks are required to have a transverse impact parameter, defined as the impact parameter in the bending plane with respect to the primary vertex, of less than 1 mm. The primary vertex is defined as the reconstructed vertex with the highest P
p
2Tof associated tracks among the reconstructed vertices with at least three associated tracks.
Each electron (muon) must satisfy p
T> 7 GeV ( p
T> 6 GeV) and be measured in the pseudo-rapidity range |η| < 2.47 (|η| < 2.7). The most energetic lepton in the quadruplet must satisfy p
T> 20 GeV, and the second (third) lepton in p
Torder must satisfy p
T> 15 GeV (p
T> 10 GeV). The leptons are required to be separated from each other by ∆R > 0.1 if they are of the same flavour and ∆R > 0.2 otherwise.
The same-flavour and opposite-sign lepton pair closest to the Z boson mass (m
Z) is the leading di-lepton, its invariant mass, denoted by m
12, is required to be between 50 and 106 GeV. The remaining same- flavour, opposite-sign lepton pair is the sub-leading di-lepton and its invariant mass, m
34, is required to be in the range m
min< m
34< 115 GeV, where the value of m
mindepends on the reconstructed four- lepton invariant mass, m
4`, and is shown in Table 2. All possible same-flavour opposite-charge di-lepton combinations in the quadruplet must satisfy m
``> 5 GeV. Four different analysis sub-channels (4e, 2e2µ, 2µ2e, 4µ) ordered by the flavour of the leading di-lepton are defined. Data quality requirements result in slightly different integrated luminosities, 5.8 fb
−1, 5.8 fb
−1and 5.9 fb
−1for the 4µ, 2e2µ/2µ2e and 4e sub-channels, respectively.
Table 2: The lower thresholds applied to m
34for reference values of m
4`. For m
4`values between these reference values the selection requirement is obtained via linear interpolation.
m
4`[GeV] ≤120 130 150 160 165 180 ≥190
m
minthreshold [GeV] 17.5 22.5 30 30 35 40 50
The Z + jets and t¯ t background contributions are further reduced by applying impact parameter as well as track- and calorimeter-based isolation requirements on the leptons. The normalised track isolation discriminant is defined as the sum of the transverse momenta of tracks, Σp
T, inside a cone of ∆R < 0.2 around the lepton, excluding the lepton track, divided by the lepton p
T. The tracks considered in the sum are of good quality; i.e., they have at least four hits in the pixel and silicon strip detectors (“silicon hits”) and p
T> 1 GeV for muons, and at least nine silicon hits, one hit in the innermost pixel layer (the b-layer) and p
T> 0.4 GeV for electrons. Each lepton is required to have a normalised track isolation smaller than 0.15.
The normalised calorimetric isolation for electrons is computed as the sum of the positive-energy topological clusters with a reconstructed barycenter falling in a cone of ∆R < 0.2 around the candidate electron cluster divided by the electron p
T. The cut value is 0.20. The cells within 0.125 × 0.175 in η × φ around the electron barycenter are excluded. The algorithm for topological clusters suppresses noise by keeping only those cells with a significant energy deposit and their neighbouring cells. The ambient energy deposition in the event from pileup as well as from the underlying event is corrected for by calculating the transverse energy density from low-p
Tjets, averaged over azimuth in two η re- gions, and subtracting it from the isolation cone transverse energy. In the case of muons, the normalised calorimetric isolation discriminant is defined as the sum of the calorimeter cells, ΣE
T, inside a cone of
∆R < 0.2 around the muon direction, divided by the muon p
T. Muons are required to have a normalised calorimetric isolation less than 0.30 (0.15 in case of muons without an ID track). For both the track- and calorimeter-based isolation any contributions arising from other leptons of the quadruplet are subtracted.
The impact parameter significance, defined as the impact parameter divided by its uncertainty, d
0/σ
d0, for all muons (electrons) is required to be lower than 3.5 (6.5). The electron impact parameter is affected by bremsstrahlung and it thus has a broader distribution.
The combined signal reconstruction and selection efficiency for m
H= 130 GeV (m
H= 360 GeV) is 41% (67%) for the 4µ channel, 27% (59%) for the 2e2µ/2µ2e channel and 23% (51%) for the 4e channel.
The final discriminating variable for this search is m
4`. The invariant mass resolution is further improved by applying a Z-mass constraint to the leading di-lepton for m
4`< 190 GeV and to both di-leptons for higher masses. The Z line-shape and the experimental uncertainty in the di-lepton mass are accounted for in the Z-mass constraint. Figure 1 presents the m
4`distributions before and after the Z mass constraint, for a simulated signal sample with m
H= 130 GeV, at √
s = 8 TeV. The width of the reconstructed Higgs boson mass distribution is dominated by the experimental resolution for m
H< 350 GeV, while for higher m
Hthe reconstructed width is dominated by the natural width of the Higgs boson. The predicted natural width of the Higgs boson is approximately 29 GeV at m
H= 400 GeV .
4.2 Background Estimation
The expected background yield and its composition is estimated using MC simulation normalised to the theoretical cross section for ZZ
(∗)production and by data-driven methods for the `` + jets and t¯ t processes. The background composition depends on the flavour of the sub-leading di-lepton and different approaches are taken for the `` + µµ and the `` + ee final states.
4.2.1 `` + µµ background
The number of t t ¯ and Z + jets (dominated by Zb b) background events in the signal region is estimated ¯
using a control region with an enhanced b b ¯ contribution. The control region is obtained by modifying
the event selection as follows: no isolation requirement is applied to leptons in the sub-leading pair, and
at least one of the sub-leading leptons is required to fail the impact parameter significance requirement.
[GeV]
m4l
80 90 100 110 120 130 140 150
a.u. / 0.5 GeV
0 0.02 0.04 0.06 0.08
0.1 ATLAS Preliminary
= 8 TeV) s µ (
→4
→ZZ*
H
0.04) GeV
± m = (129.50
0.04) GeV
± = (2.13 σ
= 130 GeV mH Gaussian fit
: 16%
σ
± 2 fraction outside
without Z mass constraint
Simulation
(a)
[GeV]
m4l
80 90 100 110 120 130 140 150
a.u. / 0.5 GeV
0 0.01 0.02 0.03 0.04 0.05 0.06 0.07 0.08 0.09
ATLAS Preliminary
= 8 TeV) s µ (
→2e2
→ZZ*
H
0.04) GeV
± m = (128.71
0.04) GeV
± = (2.33 σ
= 130 GeV mH Gaussian fit
: 19%
σ
± 2 fraction outside
without Z mass constraint
Simulation
(b)
[GeV]
m4l
80 90 100 110 120 130 140 150
a.u. / 0.5 GeV
0 0.01 0.02 0.03 0.04 0.05 0.06
0.07 ATLAS Preliminary
= 8 TeV) s
→4e (
→ZZ*
H
0.07) GeV
± m = (127.86
0.06) GeV
± = (2.76 σ
= 130 GeV mH Gaussian fit
: 17%
σ
± 2 fraction outside
without Z mass constraint
Simulation
(c)
[GeV]
m4l
80 90 100 110 120 130 140 150
a.u. / 0.5 GeV
0 0.02 0.04 0.06 0.08 0.1 0.12
ATLAS Preliminary
= 8 TeV) s µ (
→4
→ZZ*
H
0.03) GeV
± m = (129.72
0.03) GeV
± = (1.78 σ
= 130 GeV mH Gaussian fit
: 19%
σ
± 2 fraction outside
with Z mass constraint
Simulation
(d)
[GeV]
m4l
80 90 100 110 120 130 140 150
a.u. / 0.5 GeV
0 0.02 0.04 0.06 0.08 0.1
ATLAS Preliminary
= 8 TeV) s µ (
→2e2
→ZZ*
H
0.04) GeV
± m = (129.16
0.04) GeV
± = (2.02 σ
= 130 GeV mH Gaussian fit
: 22%
σ
± 2 fraction outside
with Z mass constraint
Simulation
(e)
[GeV]
m4l
80 90 100 110 120 130 140 150
a.u. / 0.5 GeV
0 0.01 0.02 0.03 0.04 0.05 0.06 0.07
0.08 ATLAS Preliminary
= 8 TeV) s
→4e (
→ZZ*
H
0.07) GeV
± m = (128.35
0.06) GeV
± = (2.46 σ
= 130 GeV mH Gaussian fit
: 20%
σ
± 2 fraction outside
with Z mass constraint
Simulation
(f)
Figure 1: Invariant mass distributions for simulated (a) H → ZZ
(∗)→ 4µ, (b) H → ZZ
(∗)→ 2e2µ and (c) H → ZZ
(∗)→ 4e events for m
H= 130 GeV, at √
s = 8 TeV. The fitted range for the Gaussian is chosen to be: −2σ to 2σ (−1.5σ to 2.5σ) for the 4µ (2e2µ/4e) channel. The slightly reduced mean values arise from radiative losses which are more explicit in channels involving electrons [70]. In (d), (e) and (f) the corresponding results after applying the Z mass constraint are shown.
As shown in Fig. 2, the m
12distribution is fitted using a second order Chebychev polynomial for the t¯ t component and a Breit-Wigner line-shape convolved with a Crystal-Ball resolution function for the Z + jets component. The shapes used in the fit are obtained from MC. The number of events in the control region is then extrapolated to the signal region using a transfer factor obtained from MC. The MC description of the selection efficiency has been verified with data using a control region obtained by requiring a Z and exactly one extra muon. This Z is selected using the leading di-lepton requirements of this analysis for the two highest p
Tsame-flavor opposite sign leptons. The systematic errors associated to the extrapolation from the control region to the signal region are comparable with the statistical errors of the fit.
The t t ¯ background is cross-checked using a control region defined by selecting events with an e
±µ
∓di-lepton pair with an invariant mass between 50 and 106 GeV, accompanied by an opposite sign di- muon. Events with a Z candidate decaying to a pair of electrons or muons, in the aforementioned mass range, are excluded. Isolation and impact parameter requirements are applied only to the leptons of the eµ pair. In data, 16 e
±µ
∓+ µ
+µ
−events are observed, to be compared with 18.9 ± 1.1 expected from MC.
The expected `` + µµ background yields in the signal region are summarised in Table 4.
[GeV]
m
1250 60 70 80 90 100
Events/4 GeV
0 2 4 6 8 10 12 14 16 18
Data t Z+jets and t
t t ZZ MC Z+jets MC
MC t t
Preliminary
ATLASLdt = 5.8 fb
-1∫
= 8 TeV:
s
Figure 2: Distribution of m
12, for √
s = 8 TeV, in the control region where the isolation requirements are not applied to the two sub-leading muons, and at least one of these muons fails the impact parameter significance requirement. The fit used to obtain the yields for t¯ t and Z + jets is presented, the MC expectations are also shown for comparison.
4.2.2 `` + ee background
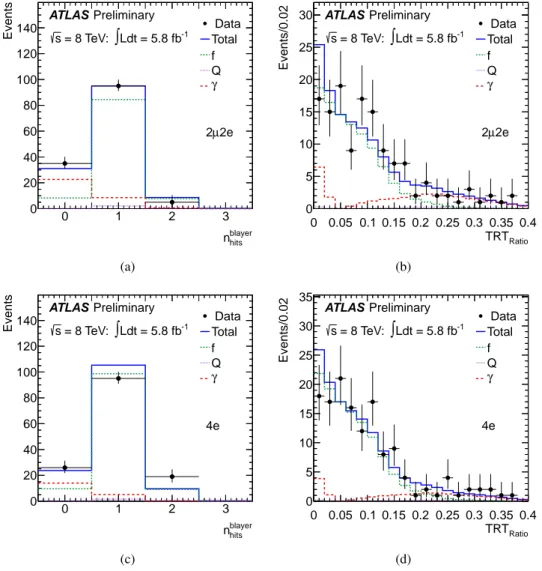
A sample of reconstruction-level objects identified as electron candidates will contain true isolated elec- trons, electrons from heavy flavour semi-leptonic decays (Q), electrons from photon conversion (γ) or light jets mis-reconstructed as electrons and denoted as fake electrons (f).
An `` + ee background control region is formed by relaxing the electron selection criteria for the electrons of the sub-leading pair. The different sources of electron background are then separated into reconstruction categories which are electron-like (E), conversion-like (C) and fake-like (F), using ap- propriate discriminating variables [72]. The variables used are: the number of b-layer hits (n
blayerhits), the fraction of high threshold hits in the Transition Radiation Tracker (TRT
Ratio), the energy in the first layer of the electromagnetic calorimeter ( f
1) and the lateral containment of the cluster along φ in the second layer of the electromagnetic calorimeter (R
φ). The variable n
blayerhitsis used to identify converted photons, and the latter three variables are used to discriminate electrons from hadrons. The numbers of observed events in each category of the control region are presented in Table 3. The expected numbers of events from MC are also given for comparison. Since only events from this control region can enter the signal region, this method directly accounts for most of the fluctuations in data. The efficiency needed to extrap- olate the background yield of each category from the control region to the signal region is obtained from MC. This method estimates the sum of Z + jets and t t ¯ background contributions. As a cross-check the same method is also applied to a similar control region containing same-sign sub-leading di-electrons.
The `` + ee background is also estimated using a control region with same-sign sub-leading di-
electrons, where the three highest p
Tleptons satisfy all the analysis criteria and the remaining electron
is required to only fulfill the good track criteria (silicon hits >= 7 and pixel hits >= 1) and the lateral
containment of the cluster energy along η (R
η). This method will be referred to as 3` + ` hereafter. In this
case a simultaneous fit of templates, obtained from the n
blayerand the TRT distributions, is used to
Table 3: The observed yields of the various categories in the `` + ee control region for √
s = 8 TeV.
Events are classified according to whether the electron candidates of the sub-leading di-electrons are:
electron-like (E), conversion-like (C) and fake-like (F). For comparison the MC expectations are also shown. The di-lepton categorisation in reconstruction categories is ordered in p
T.
4e 2µ2e
Data MC Data MC
EE 32 22.7±4.8 31 24.9±5.0
EC 6 6.0±2.5 2 1.9±1.4
EF 18 19.0±4.4 26 15.3±3.9
CE 4 8.8±3.0 6 5.1±2.3
CC 1 5.3±2.3 6 4.2±2.0
CF 12 8.8±3.0 15 15.3±3.9
FE 16 5.7±2.4 12 8.4±2.9
FC 6 6.5±2.6 7 4.3±2.1
FF 12 17.4±4.2 16 33.6±5.8
Total 107 100±10 121 113±11
by replacing the TRT
Ratiowith f
1or the distance in η between the extrapolated impact point of the track on the calorimeter and the cluster barycenter using the strips (∆η
1). The difference in the results is taken into account as a systematic error.
Finally, the `` + ee background is also estimated by performing the full analysis but selecting same- sign pairs for the sub-leading di-electrons. In this case, there remain 4 (3) events below m
4`= 160 GeV in the 4e (2µ2e) sub-channel.
The expected `` + ee background yields in the signal region are summarised in Table 4.
4.2.3 Summary of background estimates
The results of all the background estimation methods are summarised in Table 4. The m
12and m
34distributions, for events selected by the analysis when relaxing the isolation and impact parameter re-
quirements for the sub-leading di-lepton, are presented in Fig. 4. The events are divided according to the
flavour of the sub-leading lepton pair into `` + µµ and `` + ee samples. In Figs. 4(a) and 4(c) the m
12and m
34distributions are presented for `` + µµ events, while in Figs. 4(b) and 4(d) the corresponding
distributions are presented for `` + ee events. The shape and normalisation of the backgrounds discussed
earlier are in good agreement with data. This is observed both for large values of m
34, where the ZZ
(∗)background dominates, and for low m
34values.
blayer
nhits
0 1 2 3
Events
0 20 40 60 80 100 120
140 Data
Total f Qγ Preliminary
ATLAS
Ldt = 5.8 fb-1
∫
= 8 TeV:
s
µ2e 2
(a)
Ratio
TRT 0 0.05 0.1 0.15 0.2 0.25 0.3 0.35 0.4
Events/0.02
0 5 10 15 20 25
30 Data
Total f Qγ Preliminary
ATLAS
Ldt = 5.8 fb-1
∫
= 8 TeV:
s
µ2e 2
(b)
blayer
nhits
0 1 2 3
Events
0 20 40 60 80 100 120
140 Data
Total f Qγ Preliminary
ATLAS
Ldt = 5.8 fb-1
∫
= 8 TeV:
s
4e
(c)
Ratio
TRT 0 0.05 0.1 0.15 0.2 0.25 0.3 0.35 0.4
Events/0.02
0 5 10 15 20 25 30 35
Data Total f Qγ Preliminary
ATLAS
Ldt = 5.8 fb-1
∫
= 8 TeV:
s
4e
(d)
Figure 3: The results of a simultaneous fit to (a) n
blayerhitsand (b) TRT
Ratiofor the background components
in the 2µ2e channel. In (c) and (d) the corresponding results for the 4e channel are given. The sources
of background electrons are denoted as: light jets faking an electron (f), photon conversions (γ) and
electrons from heavy quark semi-leptonic decays (Q).
Table 4: Summary of the background estimates for the √
s = 8 TeV data. The “†” symbol indicates the estimated number of events used for the background normalisation, the others being cross-checks. The first uncertainty is statistical, while the second is systematic.
Method Estimated
number of events 4µ
m
12fit: Z + jets contribution 0.51± 0.13 ±0.16
†m
12fit: t t ¯ contribution 0.044±0.015±0.015
†t t ¯ from e
±µ
∓+ µ
±µ
∓0.058±0.015±0.019 2e2µ
m
12fit: Z + jets contribution 0.41± 0.10 ±0.13
†m
12fit: t¯ t contribution 0.040±0.013±0.013
†t¯ t from e
±µ
∓+ µ
±µ
∓0.051±0.013±0.017 2µ2e
`` + e
±e
∓4.9± 0.8 ±0.7
†`` + e
±e
±4.1± 0.6 ±0.8
3` + ` (same-sign) 3.5± 0.5 ±0.5 4e
`` + e
±e
∓3.9± 0.7 ±0.8
†`` + e
±e
±3.1± 0.5 ±0.6
3` + ` (same-sign) 3.0± 0.4 ±0.4
[GeV]
m12
60 80 100
Events/4 GeV
0 10 20 30 40 50 60 70
Data ZZ Z+jets
t t WZSyst.Unc.
Preliminary ATLAS
Ldt = 5.8 fb-1
∫
s = 8 TeV µ-µ+ - +
+e
-/e µ µ+
(a)
[GeV]
m12
60 80 100
Events/4 GeV
0 10 20 30 40 50 60 70
Data ZZ
t Z+jets,t Syst.Unc.
Preliminary ATLAS
Ldt = 5.8 fb-1
∫
s = 8 TeV e-+ e+
e-
/e+
µ-
µ+
(b)
[GeV]
m34
20 40 60 80 100
Events/5 GeV
0 5 10 15 20 25 30 35 40
Data ZZ Z+jets
t t WZ Syst.Unc.
Preliminary ATLAS
Ldt = 5.8 fb-1
∫
s = 8 TeV µ-µ+ - +
+e
-/e µ µ+
(c)
[GeV]
m34
20 40 60 80 100
Events/5 GeV
0 5 10 15 20 25 30 35 40
Data ZZ
t Z+jets,t Syst.Unc.
Preliminary ATLAS
Ldt = 5.8 fb-1
∫
s = 8 TeV e-+ e+
e-
/e+
µ-
µ+
(d)
Figure 4: Invariant mass distributions of the lepton pairs in the control sample defined by a Z boson candidate and an additional same-flavour lepton pair, for the √
s = 8 TeV dataset. The sample is divided according to the flavour of the additional lepton pair. In (a) the m
12and in (c) the m
34distributions are presented for `` µ
+µ
−/e
+e
−+ µ
+µ
−events. In (b) the m
12and in (d) the m
34distributions are presented for `` µ
+µ
−/e
+e
−+ e
+e
−events. The kinematic selection of the analysis is applied. Isolation and impact
parameter significance requirements are applied to the first lepton pair only. The MC is normalized to
the data driven background estimations given in Table 4.
5 Analysis of √
s = 7 TeV data
In this section the analysis of the 2011 √
s = 7 TeV data, using the same kinematic selection as the
√ s = 8 TeV analysis, is presented.
The data collected during 2011 are subjected to quality requirements similar to those used for the 2012 data. The resulting integrated luminosity being 4.8 fb
−1, 4.8 fb
−1and 4.9 fb
−1for the 4µ, 2e2µ/2µ2e and 4e final states, respectively.
5.1 Lepton Reconstruction/Identification and Event Selection
The data considered in this analysis are selected using single-lepton or di-lepton triggers. For the single- muon trigger the p
Tthreshold is 18 GeV, while for the single-electron trigger the E
Tthreshold is 20 − 22 GeV depending on the LHC data-taking period. For the di-muon and di-electron triggers the thresholds are p
T= 10 GeV for each muon, and E
T= 12 GeV for both electrons.
For the √
s = 7 TeV dataset, the electron reconstruction proceeds as described in Ref. [70], with the exception that electron candidates are refitted using a Gaussian-sum filter [73], which recovers electron candidates that suffered large energy losses due to bremsstrahlung emissions. Electron reconstruction and identification is similar to that used in Ref. [6].
The event selection is identical between √
s = 7 TeV and 8 TeV data analyses with the following exceptions:
− For the electron track isolation, tracks are required to have at least seven silicon hits, one b-layer hit and p
T> 1 GeV.
− The calorimeter isolation of electrons in 2011 is cell-based rather than topological cluster based and the actual cut is 0.3 instead of 0.2.
The combined signal reconstruction and selection efficiency for m
H= 130 GeV (m
H= 360 GeV) is 43% (70%) for the 4µ channel, 23% (56%) for the 2e2µ/2µ2e channel and 17% (45%) for the 4e channel.
5.2 Background Estimation
The background estimation strategy in the √
s = 7 TeV data sample is identical to the √
s = 8 TeV one, described in Section 4.2.
The estimation of the t¯ t and Z + jets (dominated by Zb b) background events in the signal region ¯ using the fit in m
12, described in Section 4.2.1, is shown in Fig. 5. For the e
±µ
∓+ µ
+µ
−control region 8 events are observed in data with 11.0 ± 0.6 expected from MC. For the `` + ee control region (defined in Section 4.2.2), the number of events observed in the dataset from √
s = 7 TeV in each category of the control region are summarised in Table 5. The final expectations in the signal region are summarised in Table 6.
The `` + ee background estimate from performing the full analysis but selecting same-sign pairs for the sub-leading di-electrons gives 4 (1) events below m
4`= 160 GeV in the 4e (2µ2e) sub-channel.
Figure 6 displays the invariant masses of lepton pairs in events with a Z boson candidate and an
additional same-flavour lepton pair, selected by applying the kinematic requirements of the analysis, and
by applying isolation requirements to the first lepton pair only. The events are divided according to the
flavour of the additional lepton pair into `` + µµ and `` + ee samples. In Figs. 6(a) and 6(c) the m
12and m
34distributions are presented for `` + µµ events, while in Figs. 6(b) and 6(d) the corresponding
distributions are presented for `` + ee events. The shape and normalisation of the backgrounds discussed
earlier are in good agreement with data; this is observed both for large values of m
34, where the ZZ
(∗)background dominates, and for low m
34values.
[GeV]
m
1250 60 70 80 90 100
Events/4 GeV
0 2 4 6 8 10 12 14
Data
t Z+jets and t
t t ZZ MC Z+jets MC
MC t t
Preliminary
ATLASLdt = 4.8 fb
-1∫
= 7 TeV:
s
Figure 5: Distribution of m
12, for √
s = 7 TeV, in the control region where the isolation requirements are not applied to the two sub-leading muons, and at least one of these muons fails the impact parameter significance requirement. The fit used to obtain the yields for t¯ t and Z + jets is presented, the MC expectations are also shown for comparison.
Table 5: The observed yields of the various categories in the `` + ee control region for √
s = 7 TeV.
Events are classified according to whether the electron candidates of the sub-leading di-electrons are:
electron-like (E), conversion-like (C) and fake-like (F). For comparison the MC expectations are also shown. The di-lepton categorization in reconstruction categories is ordered in p
T.
4e 2µ2e
Data MC Data MC
EE 11 11.2±0.6 8 15.0±0.9
EC 4 2.5±0.8 3 3.0±1.1
EF 6 9.7±1.4 5 6.6±1.1
CE 5 1.5±0.7 6 4.5±1.6
CC 2 1.4±0.7 2 1.5±1.0
CF 7 4.7±1.2 10 9.9±2.3
FE 5 3.1±0.6 4 4.5±1.0
FC 5 3.0±1.0 4 6.3±1.8
FF 12 11.0±1.9 17 13.4±2.6
Total 57 48±3 59 65±5
Table 6: Summary of the background estimates for the √
s = 7 TeV data sample. The “†” symbol indicates the estimated number of events used for the background normalisation, the others being cross- checks. The first uncertainty is statistical, while the second is systematic.
Method Estimated
number of events 4µ
m
12fit: Z + jets contribution 0.25± 0.10 ±0.08
†m
12fit: t t ¯ contribution 0.022±0.010±0.011
†t t ¯ from e
±µ
∓+ µ
±µ
∓0.025±0.009±0.014 2e2µ
m
12fit: Z + jets contribution 0.20± 0.08 ±0.06
†m
12fit: t¯ t contribution 0.020±0.009±0.011
†t¯ t from e
±µ
∓+ µ
±µ
∓0.024±0.009±0.014 2µ2e
`` + e
±e
∓2.6± 0.4 ±0.4
†`` + e
±e
±3.7± 0.9 ±0.6
3` + ` (same-sign) 2.0± 0.5 ±0.3 4e
`` + e
±e
∓3.1± 0.6 ±0.5
†`` + e
±e
±3.2± 0.6 ±0.5
3` + ` (same-sign) 2.2± 0.5 ±0.3
[GeV]
m12
60 80 100
Events/4 GeV
0 5 10 15 20 25 30 35 40 45 50
Data ZZ Z+jets
t t WZSyst.Unc.
Preliminary ATLAS
Ldt = 4.8 fb-1
∫
s = 7 TeV µ-µ+ - +
+e
-/e µ µ+
(a)
[GeV]
m12
60 80 100
Events/4 GeV
0 5 10 15 20 25 30 35 40 45 50
Data ZZ
t Z+jets,t Syst.Unc.
Preliminary ATLAS
Ldt = 4.8 fb-1
∫
s = 7 TeV e-+ e+
e-
/e+
µ-
µ+
(b)
[GeV]
m34
20 40 60 80 100
Events/5 GeV
0 5 10 15 20 25 30
Data ZZ Z+jets
t t WZ Syst.Unc.
Preliminary ATLAS
Ldt = 4.8 fb-1
∫
s = 7 TeV µ-µ+ - +
+e
-/e µ µ+
(c)
[GeV]
m34
20 40 60 80 100
Events/5 GeV
0 5 10 15 20 25 30
Data ZZ
t Z+jets,t Syst.Unc.
Preliminary ATLAS
Ldt = 4.8 fb-1
∫
s = 7 TeV e-+ e+
e-
/e+
µ-
µ+
(d)
Figure 6: Invariant mass distributions of the lepton pairs in the control sample defined by a Z boson candidate and an additional same-flavour lepton pair for the √
s = 7 TeV data sample. The sample is divided according to the flavour of the additional lepton pair. In (a) the m
12and in (c) the m
34distri- butions are presented for `` µ
+µ
−/e
+e
−+ µ
+µ
−events. In (b) the m
12and in (d) the m
34distributions are presented for `` µ
+µ
−/e
+e
−+ e
+e
−events. The kinematic selections of the analysis are applied.
Isolation requirements are applied to the first lepton pair only. The MC is normalized to the data driven
background estimations given in Table 6.
6 Systematic Uncertainties
The uncertainty of the lepton reconstruction and identification efficiencies, and of the momentum resolu- tion and scale, are determined using samples of W, Z and J/ψ decays [70]. The uncertainty of the muon identification and reconstruction efficiency results in a relative acceptance uncertainty of the signal and the ZZ
(∗)background which is uniform over the mass range of interest, and amounts to ±0.16% (±0.12%) for the 4µ (2e2µ) channel. The uncertainty of the electron identification efficiency results in a relative acceptance uncertainty of ± 3.0% (±1.7%) for the 4e (2e2µ) channel at m
4`= 600 GeV and reaches
±8.0% (±4.6%) at m
4`= 110 GeV. The effects of muon momentum resolution and scale uncertainty are found to be negligible. The effect of the uncertainty of the energy resolution for electrons is negligible, while the uncertainty of the electron energy scale results in an uncertainty of less than ±0.7% (±0.4%) on the mass scale of the m
4`distribution for the 4e (2e2µ) channel.
The selection efficiency of the isolation and impact parameter requirements is studied using data for both isolated and non-isolated leptons. Isolated leptons are obtained from Z → `` decays, while addi- tional leptons reconstructed in events with Z → `` decays constitute the sample of non-isolated leptons.
Additional checks are performed with non-isolated leptons from semi-leptonic b- and c-quark decays in a heavy-flavour enriched di-jet sample. Good agreement is observed between data and simulation and the systematic uncertainty is, in general, estimated to be small with respect to the other systematic uncertainties.
An additional uncertainty on the signal selection efficiency is added in the 2011 analysis only, which is not needed in the 2012 analysis due to an improved modelling of the signal kinematics. This additional uncertainty is evaluated by varying the Higgs boson p
Tspectrum in the gluon fusion process according to the PDF and QCD scale uncertainties.
The background uncertainties of the data driven methods have already been presented in Sections 4 and 5. The overall uncertainty of the integrated luminosity for the complete 2011 dataset is ±1.8% and is described in Refs. [10, 11]. For the 2012 dataset the corresponding preliminary uncertainty is ±3.6%
based on the calibration described in Ref. [11].
The theory-related systematic uncertainty, for both signal and ZZ
(∗)background, has been discussed in Section 3. The uncertainties related to the data-driven methods are summarised in Tables 4 and 6.
7 Results
In Table 7, the numbers of events observed in each final state are summarised and compared to the expected backgrounds, separately for m
4`< 160 GeV and m
4`≥ 160 GeV, and to the expected signal for various m
Hhypotheses. Table 8 presents the observed and expected events, in a window of ±5 GeV around various hypothesized Higgs boson masses, for the 5.8 fb
−1at √
s = 8 TeV and the 4.8 fb
−1at
√ s = 7 TeV datasets as well as for their combination.
The expected m
4`distributions for the total background and several signal hypotheses are compared to the data in Fig. 7. Figure 8 presents the same distributions only for the low mass range 80 −250 GeV. In Figures 9 and 10 the m
4`mass distributions for each sub-channel (4µ, 2µ2e, 2e2µ, 4e) are shown for the data at √
s = 8 TeV and √
s = 7 TeV, respectively. High-p
Tphoton emissions from final-state radiation (FSR), although occurring at a low rate, are not taken into account explicitely in the lepton reconstruction, and affect the reconstructed invariant mass in rare cases. In MC, QED corrections are fully considered and accounted for in the templates used for the mass distributions. All candidates selected have been checked and no appreciable FSR activity has been found for the candidates below 160 GeV.
Upper limits are set on the Higgs boson production cross section at 95% CL, using the CL
smodified
frequentist formalism [74] with the profile likelihood ratio test statistic [75]. The test statistic is evaluated
using a maximum-likelihood fit of signal and background models to the observed m
4`distribution.
Table 7: The observed numbers of events and the final estimate for the expected backgrounds, separated into “Low mass” (m
4`< 160 GeV) and “High mass” (m
4`≥ 160 GeV) regions. The expected numbers of signal events is also shown for various Higgs boson mass hypotheses. For signal and background estimates, the corresponding total uncertainty is given.
4µ 2e2µ/2µ2e 4e
Low mass High mass Low mass High mass Low mass High mass
√ s = 8 TeV
Int. Luminosity 5.8 fb
−15.8 fb
−15.9 fb
−1ZZ
(∗)6.3±0.3 27.5±1.9 3.7±0.2 41.7±3.0 2.9±0.3 17.7±1.4 Z + jets, and t t ¯ 0.4±0.2 0.15±0.07 3.9±0.9 1.4±0.3 2.9±0.8 1.0±0.3 Total Background 6.7±0.3 27.6±1.9 7.6±1.0 43.1±3.0 5.7±0.8 18.8±1.4
Data 4 34 11 61 7 25
m
H= 125 GeV 1.4±0.2 1.7±0.2 0.8±0.1
m
H= 150 GeV 4.5±0.6 5.9±0.8 2.7±0.4
m
H= 190 GeV 8.2±1.0 12.5±1.7 5.3±0.8
m
H= 400 GeV 3.9±0.5 6.6±0.9 2.9±0.4
√ s = 7 TeV
Int. Luminosity 4.8 fb
−14.8 fb
−14.9 fb
−1ZZ
(∗)4.9±0.2 18.1±1.3 3.1±0.2 27.3±2.0 1.6±0.2 10.2±0.8 Z + jets, and t t ¯ 0.2±0.1 0.07±0.03 2.1±0.5 0.7±0.2 2.3±0.6 0.8±0.2 Total Background 5.1±0.2 18.2±1.3 5.1±0.5 28.0±2.0 3.9±0.6 11.0±0.8
Data 8 25 5 28 4 18
m
H= 125 GeV 1.0±0.1 1.0±0.1 0.37±0.05
m
H= 150 GeV 3.0±0.4 3.4±0.5 1.4±0.2
m
H= 190 GeV 5.1±0.6 7.4±1.0 2.8±0.4
m
H= 400 GeV 2.3±0.3 3.8±0.5 1.6±0.2
Table 8: The numbers of expected signal and background events together with the number of observed events, in a window of ±5 GeV around the hypothesized Higgs boson mass for the 5.8 fb
−1at √
s = 8 TeV and the 4.8 fb
−1at √
s = 7 TeV datasets as well as for their combination.
√ s = 8 TeV √
s = 7 TeV √
s = 8 TeV and √
s = 7 TeV 4µ
m
Hexp. signal exp. bkg obs exp. signal exp. bkg obs exp. signal exp. bkg obs 120 0.68±0.09 0.61± 0.04 2 0.48±0.06 0.46± 0.03 2 1.16± 0.15 1.07± 0.07 4 125 1.25±0.17 0.74± 0.05 4 0.84±0.11 0.56± 0.03 2 2.09± 0.28 1.30± 0.08 6 130 1.88±0.25 0.81± 0.05 2 1.38±0.18 0.63± 0.03 1 3.26± 0.43 1.44± 0.08 3
2e2µ/2µ2e
m
Hexp. signal exp. bkg obs exp. signal exp. bkg obs exp. signal exp. bkg obs 120 0.81±0.12 1.15± 0.17 2 0.48±0.07 0.78± 0.10 1 1.29± 0.19 1.93± 0.18 3 125 1.45±0.20 1.30± 0.19 3 0.83±0.11 0.89± 0.11 2 2.28± 0.31 2.19± 0.21 5 130 2.24±0.32 1.34± 0.20 2 1.27±0.17 0.94± 0.11 1 3.51± 0.49 2.28± 0.21 3
4e
m
Hexp. signal exp. bkg obs exp. signal exp. bkg obs exp. signal exp. bkg obs 120 0.35±0.05 0.79±0.15 1 0.15±0.02 0.60±0.12 1 0.50±0.07 1.39±0.19 2 125 0.61±0.09 0.90±0.17 2 0.28±0.04 0.69±0.13 0 0.89±0.13 1.59±0.22 2 130 0.91±0.15 0.96±0.17 1 0.42±0.06 0.74±0.14 0 1.33±0.21 1.70±0.22 1
[GeV]
m4l
200 400 600
Events/10 GeV
0 2 4 6 8 10 12 14 16 18 20 22
Ldt = 5.8 fb-1
∫
s = 8 TeV→4l ZZ(*)
→ H
Data (*)
Background ZZ t Background Z+jets, t
=125 GeV) Signal (mH
=190 GeV) Signal (mH
=360 GeV) Signal (mH
Syst.Unc.
Preliminary ATLAS
(a)
[GeV]
m4l
200 400 600
Events/10 GeV
0 2 4 6 8 10 12 14 16 18 20 22
Ldt = 4.8 fb-1
∫
s = 7 TeV→4l ZZ(*)
→ H
Data (*)
Background ZZ t Background Z+jets, t
=125 GeV) Signal (mH
=190 GeV) Signal (mH
=360 GeV) Signal (mH
Syst.Unc.
Preliminary ATLAS
(b)