ATLAS-CONF-2012-074 06July2012
ATLAS NOTE
ATLAS-CONF-2012-074
July 3, 2012
Search for a supersymmetric partner of the top quark in final states with jets and missing transverse momentum at √
s = 7 TeV with the ATLAS detector
The ATLAS Collaboration
Abstract
A search for direct pair production of supersymmetric top squarks (˜
t1) is presented, assuming the ˜
t1decays into a top quark and the lightest supersymmetric particle or LSP ( ˜
χ01), and that both top quarks decay with purely hadronic final states. A total of 16 (4) events are observed compared to a predicted Standard Model background of 13.5
+−3.73.6(4.4
+−1.71.3) events in two signal regions based on
RLdt =
4.7 fb
−1of
ppcollision data taken at
√s =
7 TeV.
An exclusion region in the ˜
t1versus ˜
χ01mass plane is evaluated; 370
< mt˜1 <465 GeV is excluded for
mχ˜01 ∼
0 GeV while
mt˜1 =445 GeV is excluded for
mχ˜01 ≤
50 GeV.
c
Copyright 2012 CERN for the benefit of the ATLAS Collaboration.
Reproduction of this article or parts of it is allowed as specified in the CC-BY-3.0 license.
The Standard Model (SM) is an extremely successful but incomplete model of particle interactions.
Supersymmetry (SUSY) [1–9] provides an elegant solution to cancel the quadratic mass divergences that would accompany a SM Higgs boson by introducing supersymmetric partners of all SM particles, such as a scalar partner of the top quark (˜ t). Like t¯ t, direct ˜ t˜ t is produced primarily through gluon fusion at the Large Hadron Collider (LHC). The production cross section depends mostly on the mass of the top partner and has minimal dependence on other SUSY parameters [10–12]. The LHC enables searches for direct stop production at higher mass scales than previous accelerators [13–27]. The viability of SUSY as a scenario to stabilize the Higgs potential and to be consistent with electroweak naturalness [28, 29]
will be tested by the search for ˜ t below the TeV scale.
In this note, we present a search for direct ˜ t˜ t production assuming ˜ t
1→t χ ˜
01→bW χ ˜
01where ˜ t
1is the lightest ˜ t eigenstate and ˜ χ
01represents the lightest supersymmetric particle (LSP) in R-parity conserving models [30–34]. We consider events where both W bosons decay hadronically, yielding a final state with six high transverse momentum ( p
T) jets from the all-hadronic t¯ t final state and large missing transverse momentum (E
missT) from the LSPs. The kinematics of both top quarks, therefore, are fully specified by the visible decay products. Additionally, SM backgrounds from all-hadronic t¯ t are suppressed as there is no significant intrinsic E
Tmissexcept from semi-leptonic c- and b-quark decays. The dominant background consists of leptonic t¯ t that contains a W
→`ν decay where the lepton (`) is either lost or mis-identified as a jet and which have large E
Tmissfrom the neutrino.
The data sample was acquired during 2011 in LHC pp collisions at a center-of-mass energy of 7 TeV with the ATLAS detector [35] which consists of tracking detectors surrounded by a 2 T superconduct- ing solenoid, calorimeters, and a muon spectrometer in a toroidal magnetic field. The high-granularity calorimeter system, with acceptance covering
|η|< 4.9
1, is composed of liquid argon with lead, copper or tungsten absorbers and scintillator tiles with steel absorbers. This data set, composed of events with a high-p
Tjet and large E
missTas selected by the trigger system, corresponds to an integrated luminosity of 4.7 fb
−1with a relative uncertainty of 3.9% [36, 37].
Jets are constructed from three-dimensional clusters of calorimeter cells using the anti-k
talgorithm with a distance parameter of 0.4 [38, 39]. Jet energies are corrected [40] for detector inhomogeneities, the non-compensating nature of the calorimeter, and the impact of multiple overlapping pp interactions.
These corrections are derived from test beam, cosmic ray, and pp collision data, and from a detailed Geant4 [41] detector simulation [42]. Jets containing a b-hadron are identified with an algorithm (MV1) exploiting both impact parameter and secondary vertex information [43, 44]. A factor correcting for the slight di
fferences in the b-tagging e
fficiency between data and the Geant4 simulation is applied to each jet in the simulation. The b-jets are restricted to the fiducial region of the tracker,
|η|< 2.5. Non- t¯ t backgrounds are minimized by requiring either
≥1 b-jets with a selection corresponding to a 60%
e
fficiency with a low < 0.2% mis-identification rate (tight), or
≥2 b-jets each with 75% e
fficiency but a higher
≈1.7% mis-identification rate per b-jet (loose).
The E
missTis the magnitude of
pmissT, the negative vector sum of the p
Tof calorimeter clusters, cal- ibrated according to their associated reconstructed object (e.g., jets and electrons), and of the p
Tof muons above 10 GeV within
|η|< 2.4. Events containing fake E
missTinduced by jets associated with calorimeter noise or non-collision backgrounds [45], or by cosmic-ray muons or poorly reconstructed muons [46, 47], are removed from consideration. Large
pmissTcolinear with a high- p
Tjet could indicate a significant fluctuation in the reconstructed jet energy or the presence of a semi-leptonic c- or b-quark de- cay. Therefore, the difference in azimuthal angle (∆ φ) between the
pmissTand any of the three highest-p
Tjets in the event,
∆φ(p
missT, jet), is required to be > π/5 radians. Fake E
Tmissis also suppressed by requiring that the
∆φ between the above computed
pmissTand one calculated with the tracking system, using tracks
1ATLAS uses a right-handed coordinate system with its origin at the nominal interaction point in the center of the detector and thez-axis along the beam pipe. Cylindrical coordinates (r, φ) are used in the transverse plane,φbeing the azimuthal angle around the beam pipe. The pseudorapidity is defined in terms of the polar angleθasη=−ln tan(θ/2).
[GeV]
mjjj
0 200 400 600
Events / 20 GeV
20 40 60 80 100
ATLAS Preliminary
=7 TeV s
-1, L dt = 4.7 fb
∫
t t Single Top V (V) + jets
+ V t t
MC Stat Error ) = (400,1) GeV
1 χ∼0 t,m (m~
Data 2011
[GeV]
mjjj
0 200 400 600
Events / 20 GeV
10-1
1 10 102
ATLASPreliminary
=7 TeV s
-1, L dt = 4.7 fb
∫
t t Single Top V (V) + jets
+ V t t
MC Stat Error ) = (400,1) GeV
1 χ∼0 t,m (m~
Data 2011
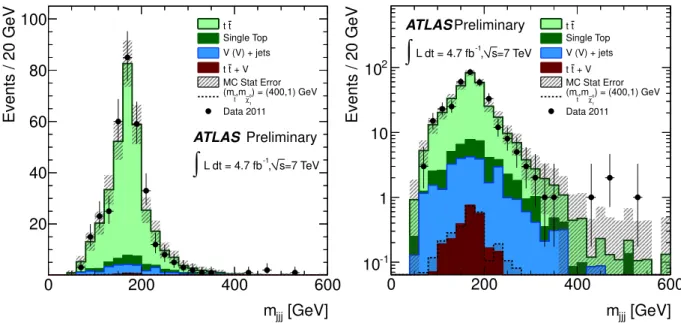
Figure 1: Three-jet invariant mass distribution of the hadronic top-quark candidate in the control region constructed from `
+jets events shown on the left with a linear scale and on the right with a logarithmic scale. Data are indicated by points; shaded histograms represent contributions from several SM sources (t¯ t scaled by 0.66). The hatched error bars indicate the total statistical uncertainty on the expected background. The distribution for the m
˜t1 =400 GeV, m
χ˜01 =
1 GeV signal expectation is overlaid.
having p
T> 0.5 GeV, is < π/3 radians.
Events are required to have at least one jet with p
T> 130 GeV in
|η|< 2.8 and E
Tmiss> 150 GeV to ensure full e
fficiency of the trigger. At least five other jets having p
T> 30 GeV and
|η|< 2.8 must be present. In addition to the jet and E
Tmissrequirements, events containing “loose” electrons [48, 49]
with p
T> 20 GeV and
|η|< 2.47 that do not overlap with any jet within an annulus of 0.2 <
∆R < 0.4, where
∆R
= p(
∆η)
2+(
∆φ)
2, are rejected. Similarly, events with muons [46, 50] having p
T> 10 GeV and
|η|< 2.4 that are separated by
∆R > 0.4 from the nearest jet are rejected. A jet with 1
−4 tracks and
∆
φ(p
missT, jet) < π/5 indicates a likely W
→τν decay. Events with τ-like jets that have transverse mass m
T = q2p
TE
Tmiss(1
−cos
∆φ) < 100 GeV are rejected.
The presence of high-p
Ttop quarks that decay through t
→bW
→b j j in the ˜ t
1t ˜
1final state is exploited to further reduce SM backgrounds by only considering events with reconstructed three-jet invariant masses consistent with the top-quark mass (m
t). A clustering technique resolves the combina- torics associated with high-multiplicity jet events. The three closest jets in the η
−φ plane are combined together to form one triplet; a second triplet is formed from the remaining jets by repeating the proce- dure. The resulting three-jet mass (m
jjj) spectrum is shown in Fig. 1 for the control region constructed from `
+jets events (defined below). There is a clear peak associated with the hadronically-decaying top quarks above a small non-t¯ t background; a requirement of 80 < m
jjj< 270 GeV is therefore placed on each reconstructed triplet in the event. The t
→bW
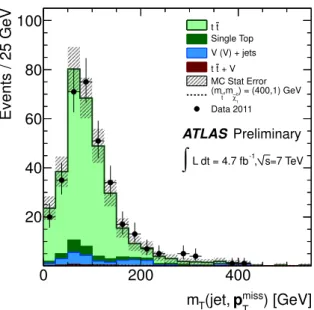
→b`ν decay is also exploited to further reduce the dominant `
+jets t¯ t background, as the m
Tdistribution of the
pmissTwith the b-jet (m
jetT) has an endpoint at m
t(Fig. 2). When there are
≥2 loose b-jets, the m
jetTfor the b-jet closest to the
pmissTis required to be
> 175 GeV. The m
jetTof the four highest-p
Tjets is required to be > 175 GeV in the case of only one tight b-jet.
Two signal regions (SR) are defined including the above kinematic and mass requirements. The
first, which requires E
missT> 150 GeV (SRA), is optimized for low m
t˜1, while the second, requiring
) [GeV]
miss
pT
(jet, mT
0 200 400
Events / 25 GeV
20 40 60 80 100
ATLAS Preliminary
=7 TeV s
-1, L dt = 4.7 fb
∫
t t Single Top V (V) + jets
+ V t t
MC Stat Error ) = (400,1) GeV
1
χ∼0
,m
~t
(m Data 2011
Figure 2: The distribution of m
jetTin the control region. Data are indicated by points; shaded histograms represent contributions from several SM sources (t¯ t scaled by 0.66). The hatched error bars indicate the total statistical uncertainty on the expected background. The distribution for the m
t˜1 =400 GeV, m
χ˜01 =
1 GeV signal expectation is overlaid.
E
missT> 260 GeV (SRB), is used for higher m
t˜1. Using these signal regions, the search is most sensitive to ˜ t
1t ˜
1production with 350
.m
t˜1 .500 GeV and m
χ˜01
m
t˜1. Signal events are simulated using Herwig++ [51] with the MRST2007LO* [52] parton-distribution functions (PDF) generated with the ˜ t
1and ˜ χ
01masses at fixed values in a grid of 50 GeV. The branching fraction of ˜ t
1 →t χ ˜
01is set to 100%
2. Signal cross sections are calculated to next-to-leading order in the strong coupling constant, including the resummation of soft gluon emission at next-to-leading-logarithmic accuracy (NLO
+NLL) [10–12]. The nominal production cross section and uncertainty are taken from an envelope of cross section predictions using different PDF sets and factorization and renormalization scales, as described in Ref. [53]. The ˜ t
1t ˜
1cross section for m
t˜1 =400 GeV is σ
t˜1˜t1 =0.21
±0.03 pb.
In the signal region, the dominant source of SM background is t¯ t
→τ
+jets events where theτ lepton is reconstructed as a jet. Additional, smaller, backgrounds include other t¯ t
→`
+jets final states,t¯ t
+V where V represents a W or Z boson, single top quark production, V
+jets, and VV
+jets. The t¯ t events are produced with ALPGEN [54] using the CTEQ6L1 PDF [55] and interfaced to HERWIG [56, 57] for particle production and JIMMY [58] for the underlying event model. Additional t¯ t samples generated with MC@NLO [59, 60] and AcerMC [61], interfaced to HERWIG and JIMMY, are used to estimate event generator systematic uncertainties. Samples of t¯ t
+V are produced with MadGraph [62] interfaced with PYTHIA [57, 63, 64]. Single top events are generated with MC@NLO [65, 66] and AcerMC. The associated production of W and Z bosons and light and heavy-flavor jets is simulated using ALPGEN;
diboson production is simulated with SHERPA [67].
All samples are passed through the Geant4 simulation of the ATLAS detector, and are reconstructed in the same manner as the data. The simulation includes the e
ffect of multiple pp interactions and is weighted to reproduce the observed distribution of the number of interactions per bunch crossing.
SM event samples are normalized to the results of higher-order calculations using the cross sections
2All simulations of top-quark related processes assume a top-quark mass of 172.5 GeV.
) [GeV]
miss
pT
candidate, τ
T( m
0 20 40 60 80 100
Events / 10 GeV
5 10 15 20 25
30 ATLAS Preliminary
=7 TeV s
-1, L dt = 4.7 fb
∫
t t Single Top V (V) + jets
+ V t t
Bkg Syst Error ) = (400,1) GeV
1 χ∼0 t,m (m~
Data 2011
Figure 3: Distribution of the m
Tof τ-like jets with the selection described in the text. Data are indi- cated by points; shaded histograms represent contributions from several SM sources (t¯ t scaled by 0.66).
The hatched error bars indicate a 37% systematic uncertainty on the total expected background. The distribution for the m
˜t1 =400 GeV, m
χ˜01 =
1 GeV signal expectation is overlaid.
cited in Ref. [68] except for the t¯ t background. This sample is renormalized by a factor that scales the t¯ t expectation to agree with the observed data in a control region (CR) of phase space with little expected signal. The CR is constructed from events containing one muon or one “tight” electron [48]
with p
T> 30 GeV consistent with originating from a W-boson decay (40 < m
`T< 120 GeV) and
≥5 jets, where m
`Tis the transverse mass between the electron or muon and the E
missT. The lepton must be isolated such that the scalar p
Tsum of tracks within a cone of
∆R < 0.2 around the lepton, excluding the track of the lepton, is < 1.8 GeV for the muon or is < 10% of the electron p
T, respectively. The jet, b-jet, and E
missTrequirements remain the same as the standard signal selection, however, some topological constraints are relaxed (∆ φ(p
missT, jet) > π/10 radians and m
jjj< 600 GeV) and others removed (m
jetT) to gain statistics.
The t¯ t purity in the control region is > 80%; the expected signal contamination is < 3%. The lepton is treated as a jet of the same energy and momentum, mimicking the e
ffect of the τ lepton. E
ffects of the additional E
Tmissfrom the τ neutrino are smaller than the statistical uncertainties. The scale factor needed to bring the
≥6 jet `
+jets ALPGENt¯ t events into agreement with the data after recalculating all quantities except E
missTis 0.66
±0.05; the uncertainty quoted here is statistical only. This scale factor is used in Figs. 1
−4. The normalization is validated with an orthogonal t¯ t-dominated sample created from SRA by inverting the τ-like jet rejection criteria; the requirement on m
jetTis removed to increase statistics. The m
Tof τ-like jets is shown in Fig. 3 where the t¯ t sample has been normalized as described above. Expectations from the simulation agree with the data within uncertainties. Contributions from QCD multi-jet production and from all-hadronic t¯ t are estimated using a data-driven technique based on smearing jets in a low E
Tmissdata sample using response functions derived from control regions dominated by multi-jet events [69]. Only 0.2
±0.2 such events remain in SRA after the full event selection.
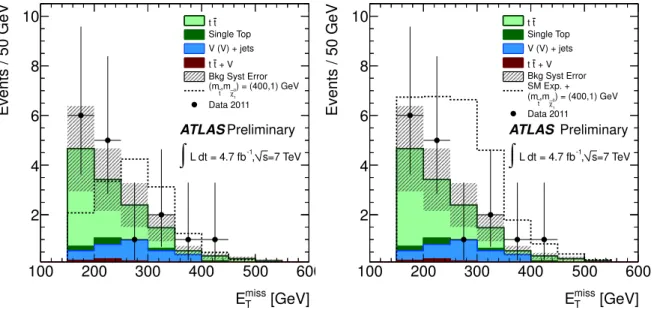
The E
missTdistribution is shown in Fig. 4 for data overlaid on the SM backgrounds along with expec- tations of ˜ t
1t ˜
1production with m
t˜1 =400 and m
χ˜01 =
1 GeV in SRA. Numbers of events and combined
statistical and systematic uncertainties, for both SRA and SRB, are tabulated in Table 1. Uncertainties
in the event generators, including the impact of initial- and final-state radiation, are the dominant source
[GeV]
miss
ET
100 200 300 400 500 600
Events / 50 GeV
2 4 6 8 10
ATLASPreliminary
=7 TeV s
-1, L dt = 4.7 fb
∫
t t Single Top V (V) + jets
+ V t t
Bkg Syst Error ) = (400,1) GeV
1
χ∼0
,m
~t
(m Data 2011
[GeV]
miss
ET
100 200 300 400 500 600
Events / 50 GeV
2 4 6 8 10
ATLAS Preliminary
=7 TeV s
-1, L dt = 4.7 fb
∫
t t Single Top V (V) + jets
+ V t t
Bkg Syst Error ) = (400,1) GeV
1
χ∼0
,m
~t
(m SM Exp. +
Data 2011
Figure 4: The distribution of E
missTin data compared to the SM expectation for signal region A. The hatched error bars indicate a 37% systematic uncertainty on the total expected background. The expected signal distribution for m
˜t1 =400 GeV, m
χ˜01 =
1 GeV is overlaid on the left and stacked on the right. The SM background distributions exclude the 0.2
±0.2 events of all-hadronic t¯ t and QCD multi-jets estimated from data.
Table 1: The number of expected events for the SM backgrounds and for an example SUSY signal point, and the observed number of events in data. The 95% CL
supper-limit on the observed (expected) visible cross section is appended below.
SRA SRB
E
Tmiss> 150 GeV > 260 GeV
t¯ t 9.2
±2.7 2.3
±0.6
t¯ t
+W/Z 0.8
±0.2 0.4
±0.1
Single top 0.7
±0.4 0.2
+− 0.30.2Z
+jets1.3
+−1.11.00.9
+− 0.80.7W
+jets 1.2
+−1.41.00.5
±0.4
Diboson 0.1
+−0.20.10.1
+− 0.20.1Multi-jets 0.2
±0.2 0.02
±0.02
Total SM 13.5
+−3.73.64.4
+− 1.71.3SUSY (m
t˜1, m
χ˜01
)
=(400, 1) GeV 14.8
±4.0 8.9
±3.1
Data (observed) 16 4
Visible cross section [fb] 2.9 (2.5) 1.3 (1.3)
0.6 0.8 1 1.2 1.4 1.6 1.8 2 2.2 2.4
[GeV]
~t
200 250 300 350 400 450 500 550 600m [GeV]1 0χ∼m
0 50 100 150 200 250 300 350 400
450 All Hadronic = 7 TeV s
-1, L dt = 4.7 fb
∫
Preliminary ATLAS
B
B B
B B
B B
B B
B
B A
B B A
A
B
A
B A
B B
B
A
A
A
B
B A
A B
A
B
B A
B B
B A
A
B A
A A
B
0
χ1
t+∼
1→
~t production, t1
~ t1
~
Figure 5: A map of m
χ˜01
vs. m
t˜1that illustrates which signal region (SRA or SRB) is used for the limit extraction. The choice of signal region for a given point was chosen based on the best expected limit.
of systematic uncertainty of 28% (23%) in SRA (SRB). Other major sources of uncertainty include 22%
(32%) for the jet energy calibration, 6.5% (6.8%) for jet energy resolution, 5.9% (6.2%) for b-jet identi- fication, and 1.4% (1.5%) for E
missTin SRA (SRB).
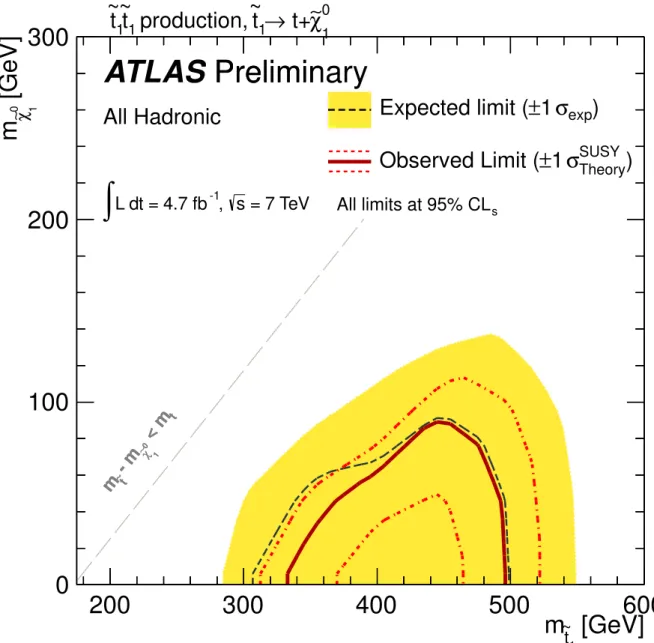
The number of observed events in the data is well matched by the SM background. These results are interpreted as exclusion limits for m
t˜1and m
χ˜01
using a CL
slikelihood ratio combining Poisson probabili- ties for signal and background [70]. Systematic uncertainties are treated as nuisance parameters assuming Gaussian distributions. Uncertainties associated with jets, b-jets, E
missT, and luminosity are fully corre- lated between signal and background; the others are assumed to be uncorrelated. The expected limits for the signal regions are evaluated for each (m
t˜1, m
χ˜01
) grid point; the SR with the best expected sensi- tivity is used for that point as shown in Fig. 5. The expected and observed 95% C.L. exclusion limits are displayed in Fig. 6. Top squark masses between 370 and 465 GeV are excluded for m
χ˜01 ∼
0 GeV while m
t˜1 =445 GeV is excluded for m
χ˜01 ≤
50 GeV. These values are derived from the
−1σobserved limit contour in Fig. 6 to account for theoretical uncertainties on the SUSY cross sections. The 95% CL
supper limit on the number of events in each signal region, divided by the integrated luminosity, yields limits on the observed (expected) visible cross sections of 2.9 (2.5) fb in SRA and 1.3 (1.3) fb in SRB.
In conclusion, we have presented a search for the direct production of ˜ t
1t ˜
1in the all-hadronic t χ ˜
01t ¯ χ ˜
01decay channel, assuming
B(˜t
1 →t χ ˜
01)
=100%. No evidence for ˜ t
1t ˜
1is observed in data and 95% C.L.
limits are set on ˜ t
1t ˜
1production as a function of m
t˜1and m
χ˜0 1.
[GeV]
t1
m
~200 300 400 500 600
[GeV]
10 χ∼m
0 100 200 300
0
χ∼
1→ t+
t
1production, ~ t
1~ t
1~
= 7 TeV s
-1
, L dt = 4.7 fb
∫ All limits at 95% CLs
Preliminary ATLAS
t
< m
1 0χ
∼
- m
tm
~All Hadronic
t
< m
1 0χ
∼
- m
tm
~exp
) σ
± 1 Expected limit (
Theory
) σ
SUSY± 1 Observed Limit (
Preliminary
Figure 6: Expected and observed 95% CL
sexclusion limits in the plane of m
χ˜01
vs. m
t˜1, assuming
B(˜t
1→t χ ˜
01)
=100%. The black dashed line shows the expected limit at 95% C.L. with the yellow band
indicating the 1σ exclusion range due to experimental uncertainties. Observed limits are indicated by
the red curves; the solid contour represents the nominal limit and the dotted lines are obtained by varying
the SUSY cross-section by the theoretical uncertainties. The inner dotted contour indicates the excluded
region.
References
[1] H. Miyazawa, Baryon Number Changing Currents, Prog. Theor. Phys.
36 (6)(1966) 1266.
[2] P. Ramond, Dual Theory for Free Fermions, Phys. Rev.
D3(1971) 2415.
[3] Y. A. Gol’fand and E. P. Likhtman, Extension of the Algebra of Poincare Group Generators and Violation of p Invariance, JETP Lett.
13(1971) 323. [Pisma Zh.Eksp.Teor.Fiz.13:452,1971].
[4] A. Neveu and J. H. Schwarz, Factorizable dual model of pions, Nucl. Phys.
B31(1971) 86.
[5] A. Neveu and J. H. Schwarz, Quark Model of Dual Pions, Phys. Rev.
D4(1971) 1109.
[6] J. Gervais and B. Sakita, Field theory interpretation of supergauges in dual models, Nucl. Phys.
B34
(1971) 632.
[7] D. V. Volkov and V. P. Akulov, Is the Neutrino a Goldstone Particle?, Phys. Lett.
B46(1973) 109.
[8] J. Wess and B. Zumino, A Lagrangian Model Invariant Under Supergauge Transformations, Phys.
Lett.
B49(1974) 52.
[9] J. Wess and B. Zumino, Supergauge Transformations in Four-Dimensions, Nucl. Phys.
B70(1974) 39.
[10] W. Beenakker, M. Kramer, T. Plehn, M. Spira, and P. M. Zerwas, Stop production at hadron colliders, Nucl. Phys.
B515(1998) 3.
[11] W. Beenakker, S. Brensing, M. Kramer, A. Kulesza, E. Laenen, and I. Niessen, Supersymmetric top and bottom squark production at hadron colliders, JHEP
1008(2010) 098.
[12] W. Beenakker, S. Brensing, M. Kramer, A. Kulesza, E. Laenen, et al., Squark and gluino hadroproduction, Int.J.Mod.Phys.
A26(2011) 2637.
[13] L3 Collaboration, P. Achard et al., Search for scalar leptons and scalar quarks at LEP, Phys.Lett.
B580
(2004) 37.
[14] DELPHI Collaboration, J. Abdallah et al., Searches for supersymmetric particles in e
+e- collisions up to 208-GeV and interpretation of the results within the MSSM, Eur.Phys.J.
C31(2003) 421.
[15] OPAL Collaboration, G. Abbiendi et al., Search for scalar top and scalar bottom quarks at LEP, Phys.Lett.
B545(2002) 272.
[16] ALEPH Collaboration, A. Heister et al., Search for scalar quarks in e
+e
−collisions at
√s up to 209-GeV, Phys.Lett.
B537(2002) 5.
[17] D0 Collaboration, V. M. Abazov et al., Search for pair production of the scalar top quark in muon
+tau final states, Phys.Lett.
B710(2012) 578.
[18] D0 Collaboration, V. M. Abazov et al., Search for pair production of the scalar top quark in the electron
+muon final state, Phys.Lett.
B696(2011) 321.
[19] CDF Collaboration, T. Aaltonen et al., Search for Pair Production of Supersymmetric Top Quarks in Dilepton Events from p anti-p Collisions at
√s
=1.96 TeV, Phys.Rev.Lett.
104(2010) 251801.
[20] D0 Collaboration, V. Abazov et al., Search for admixture of scalar top quarks in the t¯ t lepton
+jets final state at
√s
=1.96 TeV , Phys.Lett.
B674(2009) 4.
[21] D0 Collaboration, V. Abazov et al., Search for the lightest scalar top quark in events with two leptons in p p collisions at ¯
√s
=1.96 TeV, Phys.Lett.
B675(2009) 289.
[22] CDF Collaboration, T. Aaltonen et al., Search for Pair Production of Scalar Top Quarks Decaying to a τ Lepton and a b Quark in p p Collisions at sqrts ¯
=1.96 TeV, Phys.Rev.Lett.
101(2008) 071802.
[23] D0 Collaboration, V. Abazov et al., Search for scalar top quarks in the acoplanar charm jets and missing transverse energy final state in p p collisions at ¯
√s
=1.96 TeV, Phys.Lett.
B665(2008) 1.
[24] CDF Collaboration, T. Aaltonen et al., Search for Direct Pair Production of Supersymmetric Top and Supersymmetric Bottom Quarks in p p Collisions at ¯
√s
=1.96 TeV, Phys.Rev.
D76(2007) 072010.
[25] CDF Collaboration, D. Acosta et al., Search for pair production of scalar top quarks in R-parity violating decay modes in p p collisions at ¯
√s
=1.8 TeV, Phys.Rev.Lett.
92(2004) 051803.
[26] ATLAS Collaboration, G. Aad et al., Search for scalar top quark pair production in natural gauge mediated supersymmetry models with the ATLAS detector in pp collisions at
√s
=7 TeV,
arXiv:1204.6736 [hep-ex].[27] ATLAS Collaboration, Search for light scalar top quark pair production in final states with two leptons with the ATLAS detector in
√s
=7 TeV proton–proton collisions, ATLAS-CONF-2012-059, http:
//cdsweb.cern.ch
/record
/1453787.
[28] S. Dimopoulos and G. Giudice, Naturalness constraints in supersymmetric theories with nonuniversal soft terms, Phys. Lett.
B357(1995) 573.
[29] A. G. Cohen, D. Kaplan, and A. Nelson, The More minimal supersymmetric standard model, Phys. Lett.
B388(1996) 588.
[30] P. Fayet, Supersymmetry and Weak, Electromagnetic and Strong Interactions, Phys. Lett.
B64(1976) 159.
[31] P. Fayet, Spontaneously Broken Supersymmetric Theories of Weak, Electromagnetic and Strong Interactions, Phys. Lett.
B69(1977) 489.
[32] G. R. Farrar and P. Fayet, Phenomenology of the Production, Decay, and Detection of New Hadronic States Associated with Supersymmetry, Phys. Lett.
B76(1978) 575.
[33] P. Fayet, Relations Between the Masses of the Superpartners of Leptons and Quarks, the Goldstino Couplings and the Neutral Currents, Phys. Lett.
B84(1979) 416.
[34] S. Dimopoulos and H. Georgi, Softly Broken Supersymmetry and SU(5), Nucl. Phys.
B193(1981) 150.
[35] ATLAS Collaboration, G. Aad et al., The ATLAS Experiment at the CERN Large Hadron Collider, JINST
3(2008) S08003.
[36] ATLAS Collaboration, G. Aad et al., Luminosity Determination in pp Collisions at
√s
=7 TeV
Using the ATLAS Detector at the LHC, Eur. Phys. J.
C71(2011) 1630.
[37] ATLAS Collaboration, Luminosity Determination in pp Collisions at
√s
=7 TeV using the ATLAS Detector in 2011, ATLAS-CONF-2011-116, http:
//cdsweb.cern.ch
/record
/1376384.
[38] M. Cacciari, G. P. Salam, and G. Soyez, The anti-k
tjet clustering algorithm, JHEP
04(2008) 063.
[39] M. Cacciari and G. P. Salam, Dispelling the N
3myth for the k
tjet-finder, Phys. Lett.
B641(2006) 57.
[40] ATLAS Collaboration, G. Aad et al., Jet energy measurement with the ATLAS detector in proton-proton collisions at
√s
=7 TeV, 2011.
arXiv:1112.6426 [hep-ex].[41] GEANT4 Collaboration, S. Agostinelli et al., GEANT4: A simulation toolkit, Nucl. Instrum. Meth.
A506
(2003) 250.
[42] ATLAS Collaboration, G. Aad et al., The ATLAS Simulation Infrastructure, Eur. Phys. J.
C70(2010) 823.
[43] ATLAS Collaboration, Measurement of the b-tag E
fficiency in a Sample of Jets Containing Muons with 5 f b
−1of Data from the ATLAS Detector, ATLAS-CONF-2012-043,
http:
//cdsweb.cern.ch
/record
/1435197.
[44] ATLAS Collaboration, Measurement of the Mistag Rate of b-tagging algorithms with 5 fb
−1of Data Collected by the ATLAS Detector, ATLAS-CONF-2012-040,
http://cdsweb.cern.ch/record/1435194.
[45] ATLAS Collaboration, Selection of jets produced in proton-proton collisions with the ATLAS detector using 2011 data, ATLAS-CONF-2012-020, http:
//cdsweb.cern.ch
/record
/1430034.
[46] ATLAS Collaboration, Muon reconstruction e
fficiency in reprocessed 2010 LHC proton-proton collision data recorded with the ATLAS detector, ATLAS-CONF-2011-063,
https:
//cdsweb.cern.ch
/record
/1345743.
[47] ATLAS Collaboration, G. Aad et al., Studies of the performance of the ATLAS detector using cosmic-ray muons, Eur. Phys. J.
C71(2011) 1593.
[48] ATLAS Collaboration, G. Aad et al., Electron performance measurements with the ATLAS detector using the 2010 LHC proton-proton collision data, Eur.Phys.J.
C72(2012) 1909.
[49] ATLAS Collaboration, Identification e
fficiency measurement for electrons with transverse energy between 7 and 50 GeV, ATLAS-COM-PHYS-2011-1669, https://cdsweb.cern.ch/record/1405412.
[50] ATLAS Collaboration, A measurement of the ATLAS muon reconstruction and trigger e
fficiency using J/ψ decays, ATLAS-CONF-2011-021, https:
//cdsweb.cern.ch
/record
/1336750.
[51] M. Bahr, S. Gieseke, M. Gigg, D. Grellscheid, K. Hamilton, et al., Herwig
++Physics and Manual, Eur. Phys. J.
C58(2008) 639. HERWIG++ v2.4.2.
[52] A. Sherstnev and R. S. Thorne, Parton Distributions for LO Generators, Eur. Phys. J.
C55(2008) 553.
[53] M. Kramer, A. Kulesza, R. van der Leeuw, M. Mangano, S. Padhi, et al., Supersymmetry production cross sections in pp collisions at
√s
=7 TeV,
arXiv:1206.2892 [hep-ph].[54] M. L. Mangano, M. Moretti, F. Piccinini, R. Pittau, and A. D. Polosa, ALPGEN, a generator for
hard multiparton processes in hadronic collisions, JHEP
0307(2003) 001. ALPGEN v2.13.
[55] J. Pumplin, D. Stump, J. Huston, H. Lai, P. M. Nadolsky, et al., New generation of parton distributions with uncertainties from global QCD analysis, JHEP
07(2002) 012.
[56] G. Corcella, I. Knowles, G. Marchesini, S. Moretti, K. Odagiri, et al., HERWIG 6: An Event generator for hadron emission reactions with interfering gluons (including supersymmetric processes), JHEP
0101(2001) 010.
[57] ATLAS Collaboration, New ATLAS event generator tunes to 2010 data, ATLAS-PUB-2011-008, https://cdsweb.cern.ch/record/1340273.
[58] J. Butterworth, J. R. Forshaw, and M. Seymour, Multiparton interactions in photoproduction at HERA, Z. Phys.
C72(1996) 637–646. JIMMY v4.31.
[59] S. Frixione and B. R. Webber, Matching NLO QCD computations and parton shower simulations, JHEP
06(2002) 029.
[60] S. Frixione, P. Nason, and B. R. Webber, Matching NLO QCD and parton showers in heavy flavour production, JHEP
08(2003) 007. MC@NLO v3.41.
[61] B. P. Kersevan and E. Richter-Was, The Monte Carlo event generator AcerMC version 2.0 with interfaces to PYTHIA 6.2 and HERWIG 6.5,
arXiv:hep-ph/0405247 [hep-ph]. ACERMCv3.7.
[62] J. Alwall, P. Demin, S. de Visscher, R. Frederix, M. Herquet, et al., MadGraph
/MadEvent v4: The New Web Generation, JHEP
09(2007) 028.
[63] T. Sjostrand, S. Mrenna, and P. Z. Skands, PYTHIA 6.4 Physics and Manual, JHEP
0605(2006) 026.
[64] ATLAS Collaboration, Further ATLAS tunes of PYTHIA 6 and Pythia 8, ATLAS-PUB-2011-014, https://cdsweb.cern.ch/record/1400677.
[65] S. Frixione, E. Laenen, P. Motylinski, and B. R. Webber, Single-top production in MC@NLO, JHEP
03(2006) 092.
[66] S. Frixione, E. Laenen, P. Motylinski, B. R. Webber, and C. D. White, Single-top hadroproduction in association with a W boson, JHEP
07(2008) 029.
[67] T. Gleisberg, S. Hoeche, F. Krauss, M. Schonherr, S. Schumann, et al., Event generation with SHERPA 1.1, JHEP
0902(2009) 007. version 1.2.3.
[68] ATLAS Collaboration, G. Aad et al., Search for supersymmetry in pp collisions at
√s
=7 TeV in final states with missing transverse momentum and b-jets with the ATLAS detector,
arXiv:1203.6193 [hep-ex].