ATLAS-CONF-2012-076 13/08/2012
ATLAS NOTE
ATLAS-CONF-2012-076
August 12, 2012
Search for direct slepton and gaugino production in final states with two leptons and missing transverse momentum with the ATLAS detector in pp
collisions at √
s = 7 TeV
The ATLAS Collaboration
Abstract
A search for the electroweak pair production of charged sleptons and weak gauginos decaying into final states with two leptons is performed using 4.7 fb
−1of proton-proton collision data at
√s =
7 TeV recorded with the ATLAS experiment at the Large Hadron Collider. No significant excesses are observed with respect to the prediction from Standard Model processes. In the scenario of direct slepton production, if the sleptons decay directly into the lightest neutralino, left-handed slepton masses between 90 and 185 GeV are ex- cluded at 95% confidence level for a 20 GeV neutralino. Chargino masses between 110 and 330 GeV are excluded in the scenario of direct production of wino-like chargino pairs de- caying into the lightest neutralino via an intermediate on-shell charged slepton for a 10 GeV neutralino.
This note was revised on the 12th August to fix errors in Figure 4. In the previous version of this note Figures 4 (b)-(c) were not correctly truncated at 40 GeV, and Figure 4 (d) displayed the diboson component as evaluated with Sherpa, not Herwig. Additionally, a plotting error had resulted in a missing uncertainty band on the last bin of each histogram.
c
Copyright 2012 CERN for the benefit of the ATLAS Collaboration.
Reproduction of this article or parts of it is allowed as specified in the CC-BY-3.0 license.
1 Introduction
Weak scale Supersymmetry (SUSY) [1–9] is an extension to the Standard Model (SM). It postulates for each known boson or fermion the existence of a particle whose spin differs by one-half unit from the SM partner. The introduction of these new particles provides solutions to the hierarchy problem [10–13]
and, if R-parity is conserved [14–18], a dark matter candidate in the form of the lightest supersymmetric particle (LSP). R-parity conservation is assumed in this paper, hence SUSY particles are always produced in pairs. In a large fraction of the SUSY parameter space the LSP is the weakly interacting lightest neutralino, ˜
χ01.
Gluinos ( ˜
g) and squarks ( ˜q) are the SUSY partners of gluons and quarks. Charginos ( ˜χ±i,
i=1, 2) and neutralinos ( ˜
χ0j,
j =1, 2, 3, 4) are the mass eigenstates formed from the linear superposition of the SUSY partners of the Higgs and electroweak gauge bosons: higgsinos, winos and the bino (collectively, gauginos). Sleptons (˜
l±) are the SUSY partners of the charged leptons: selectron, smuon and stau. If the masses of the gluinos and squarks are greater than a few TeV and the weak gauginos and sleptons have masses of a few hundreds of GeV, the direct production of weak gauginos and sleptons may dominate the production of SUSY particles at the Large Hadron Collider (LHC). Such a scenario is possible in the general framework of the phenomenological minimal supersymmetric SM (pMSSM) [19]. Naturalness suggests that third generation sparticles, charginos and neutralinos should have masses of a few hundreds of GeV [20]. Light sleptons are expected in Gauge Mediated [21] and Anomaly Mediated [22] SUSY breaking scenarios. Light sleptons could also play a role in helping SUSY to provide a relic dark matter density consistent with observations [23].
This note presents the first search for direct slepton pair production at the LHC and a dedicated search for direct chargino pair production in final states with two leptons (electrons,
eor muons,
µ).1.1 Direct Slepton and Chargino Pair Production
Sleptons can be produced directly in a process similar to Drell-Yan production [24]. The search in this note targets the direct pair production of left-handed charged sleptons, where each charged slepton ˜
l(selectron or smuon) decays through ˜
l±→l±χ˜
01, yielding a final state with two same flavour (SF) charged leptons. The undetected ˜
χ01gives rise to large missing transverse momentum in the event. Previous experimental searches for direct slepton production [25] assumed gaugino unification. In the present work this assumption is dropped, thereby removing the lower limit on the mass of the ˜
χ01. Direct chargino pair production, where each chargino decays through ˜
χ±1 →l±νχ˜
01leads to a signature similar to that of slepton pair production. The search in this note targets this production channel and subsequent decay, setting limits on the chargino mass, without the assumptions on the mass of the ˜
χ02usually present in tri-lepton searches.
1.2 Other Weak Gaugino Production
In the general framework of the pMSSM, several weak gaugino production channels can lead to final states with two leptons. Production modes such as ˜
χ02χ˜
±i=1,2or ˜
χ02χ˜
0j=2,3,4, with the subsequent decays
χ˜
02 →l±l∓χ˜
01and ˜
χ0j,χ˜
±i →qq¯
0χ˜
01are addressed by a signal region containing two leptons and two jets.
In order to complement existing and future tri-lepton searches a dedicated signal region with two same charge leptons is designed to be sensitive to trilepton final states from ˜
χ02χ˜
±1 →(l
±l∓χ˜
01)
+(l
±ν˜χ01) where one lepton is not identified. All final states yield missing transverse energy due to the presence of two
χ˜
01’s.
Model-independent visible cross-section upper limits are set in each signal region to address the large
variety of possible production and decay modes in the gaugino sector. This search is not sensitive to weak
gaugino decays via on-shell
Z-bosons. Previous limits on weak chargino and neutralino production havebeen placed at LEP [25], the Tevatron [26, 27] and at the LHC [28–30].
2 The ATLAS Detector
The ATLAS experiment [31] is a multi-purpose particle physics detector with a forward-backward sym- metric cylindrical geometry and nearly 4π coverage in solid angle.
1It contains four superconducting magnet systems, which include a thin solenoid surrounding the inner tracking detector (ID), and barrel and endcap toroids supporting a muon spectrometer. The ID consists of a silicon pixel detector, a sil- icon microstrip detector (SCT), and a transition radiation tracker (TRT). In the pseudorapidity region
|η|<
3.2, high-granularity liquid-argon (LAr) electromagnetic (EM) sampling calorimeters are used. An iron-scintillator tile calorimeter provides coverage for hadron detection over
|η| <1.7. The end-cap and forward regions, spanning 1.5
< |η| <4.9, are instrumented with LAr calorimeters for both EM and hadronic measurements. The muon spectrometer surrounds the calorimeters and consists of a system of precision tracking chambers (|η|
<2.7), and detectors for triggering (|η|
<2.4).
3 Monte Carlo
3.1 Standard Model Production
Monte Carlo (MC) simulated event samples are used to develop and validate the analysis procedure and to evaluate the SM backgrounds in the signal region. The dominant backgrounds include fully-leptonic
t¯t, Z/γ∗+jets, single top and dibosons (WW,
WZand
ZZ). Production of top quark pairs is simulatedwith POWHEG [32], using a top quark mass of 172.5 GeV. Samples of
Wto
lνand Z/
γ∗to
ll, producedwith accompanying jets (of both light and heavy flavour), are obtained with ALPGEN [33]. Diboson (WW ,
WZ,ZZ) production is simulated withSHERPA [34] in signal regions requiring jets and with HERWIG [35]
elsewhere. Single top production is modelled with MC@NLO. Fragmentation and hadronisation for the ALPGEN and MC@NLO samples are performed with HERWIG, using JIMMY [36] for the underlying event, and with PYTHIA for the POWHEG sample. Expected diboson yields are normalised using NLO QCD predictions obtained with MCFM [37, 38]. The top-quark contribution is normalised to approximate next- to-next-to-leading order (NNLO) calculations [39]. The inclusive
Wand
Z/γ∗production cross-sections are normalised to the next-to-next-to-leading order (NNLO) cross-sections obtained using FEWZ [40].
MC@NLO [41] samples are used to assess the systematic uncertainties associated with the choice of gen- erator for
t¯tproduction, and AcerMC [42] samples are used to assess the uncertainties associated with initial and final state radiation (ISR/FSR) [43]. ALPGEN, HERWIG and SHERPA samples are used to assess the systematics associated with the choice of generator for diboson production.
3.2 Direct Slepton and Direct Gaugino Production
Four signal regions are designed in this paper, optimised for the discovery of various SUSY models which directly produce sleptons and gauginos. SUSY signal samples are generated in the pMSSM framework at fixed slepton and neutralino masses, and at fixed gaugino mass parameters. The former is used to set limits on the masses of the sleptons in direct slepton pair production, whereas the latter is used to design an analysis sensitive to the variety of direct gaugino production modes already described. Samples are also produced in a simplified model at fixed LSP and chargino masses, which are then used to set limits
1ATLAS uses a right-handed coordinate system with its origin at the nominal interaction point in the centre of the detector and thez-axis along the beam pipe. Cylindrical coordinates (r, φ) are used in the transverse plane,φbeing the azimuthal angle around the beam pipe. The pseudorapidityηis defined in terms of the polar angleθbyη=−ln tan(θ/2).
on the chargino mass, independent of the ˜
χ02mass. In all SUSY models the masses of the squarks, gluinos and third generation supersymmetric partners of the fermions are large (2.5 TeV in the direct slepton production pMSSM models and 2 TeV in the direct gaugino pMSSM and simplified models).
The direct slepton models are based on those which are described in Ref. [44]. Masses of all gauginos apart from the ˜
χ01are set to 2.5 TeV. The sensitivity of the present search to a given model is determined by the slepton production cross-section and by the mass of the ˜
χ01which affects the kinematics of the final state leptons. The mass of the bino-like ˜
χ01is varied by scanning values of gaugino mass parameter
M1in steps of 20 GeV in the range 20-160 GeV. The common selectron and smuon mass is generated in the range 70-190 GeV, scanned in steps of 20 GeV with the constraint
m˜l >mχ˜01 +
30 GeV. The cross- section for direct slepton pair production in these models decreases from 3.9 to 0.05 pb independently of neutralino mass as the slepton mass increases from 70 to 190 GeV.
There are four parameters in the simplified models of direct gaugino production: the masses of ˜
χ01,
ν, ˜˜
`Land the common mass of ˜
χ±1and ˜
χ02. The latter are wino-like and ˜
χ01is bino-like. The ˜
χ±1are pair-produced via the
s-channel exchange of a virtual gauge boson and decay via left-handed sleptons,including ˜
τ, and ˜νof mass
mν˜ = m`˜L=(m
χ˜01 +mχ˜±
1
)/2 with a branching ratio of 50% each. The cross section for ˜
χ±1χ˜
∓1pair production in these models is
∼0.2 pb for ˜
χ±1masses between 200 and 250 GeV.
For lower chargino masses (50
−125 GeV) the cross-section is as high as 3 pb, dropping below 0.2 pb for models with chargino masses of 250 GeV and above.
For the other weak gaugino production channels, a set of pMSSM models with intermediate sleptons in the gaugino decay chain are generated. The right-handed sleptons, with a common mass for all three generations, are inserted half way between the two lightest neutralino masses while left-handed slepton masses are kept beyond reach. The gaugino mass parameters
M1,
M2and
µare varied independently, the ratio of the expectation values of the two Higgs doublets (tanβ) is set to 6. In the pMSSM model the cross sections vary significantly (between 0.5 and 100 pb for
M1 =250, with the highest cross-sections at low
M2and
µ). The present direct gaugino production search is only sensitive to models with intermediatesleptons.
Signal samples for the pMSSM and slepton model points are generated with HERWIG, whereas Herwig++ [45] is used to generate the simplified model points. Signal cross sections are calculated to next-to-leading order in the strong coupling constant (NLO) using PROSPINO2 [46]. The nominal cross section and the uncertainty are taken from an envelope of cross section predictions using different PDF sets and factorisation and renormalisation scales, as described in Ref. [47].
All MC samples are produced using a GEANT4 [48] based detector simulation [49]. The effect of multiple proton-proton collisions from the same or different bunch crossings is incorporated into the simulation by overlaying additional minimum bias events onto hard scatter events using PYTHIA. Simu- lated events are weighted to match the distribution of the mean number of interactions per bunch crossing observed in data.
4 Data and Event Selection
The 7 TeV proton-proton collision data analysed were recorded between March and October 2011. Ap-
plication of beam, detector and data-quality requirements yields a total integrated luminosity of 4.7 fb
−1.
Events are triggered using a combination of single and double lepton triggers. The single electron trig-
gers vary with the data taking period, and the tightest trigger has an efficiency of
∼97% for electronswith
pT>25 GeV. The single muon trigger used for all data taking periods reaches an e
fficiency plateau
of
∼75% (∼90%) in the barrel (end-caps) for muons with pT >20 GeV. All quoted e
fficiencies have
been measured with respect to reconstructed leptons. The double lepton triggers reach similar plateau
e
fficiencies, but at lower
pTthresholds:
>17 GeV for the dielectron trigger, and
>12 GeV for the
dimuon trigger; for the electron-muon trigger the thresholds are 15 and 10 GeV respectively. One or two signal leptons are required to have triggered the event, and be matched to the online triggered leptons:
one lepton, if one is above the appropriate single lepton trigger plateau threshold or two leptons, if there is no such lepton. If one lepton is below the threshold of the double lepton triggers, and the other not above the single lepton threshold, the event is rejected. An exception to this rule is applied in the
µµchannel. In this case when one lepton has
pT >20 GeV and the second
pT >12 GeV, a logical OR of both triggers is used to recover efficiency.
Jet candidates are reconstructed using the anti-k
tjet clustering algorithm [50] with a distance pa- rameter of 0.4. The jet candidates are corrected for the effects of calorimeter non-compensation and inhomogeneities by using
pTand
η-dependent calibration factors based on MC simulations and validatedwith extensive test-beam and collision-data studies [51]. Only jet candidates with transverse momenta
pT >20 GeV and
|η| <4.5 are subsequently retained. Jets likely to have arisen from detector noise or cosmic rays are rejected [51]. Electron candidates are required to have
pT >10 GeV,
|η| <2.47, and pass the “medium” shower shape and track selection criteria of Ref. [52]. Muon candidates are recon- structed using either a full muon spectrometer track matched to an ID track, or a muon spectrometer track matched to an extrapolated ID track. They are then required to have
pT >10 GeV and
|η| <2.4.
They must be reconstructed with su
fficient hits in the pixel, SCT and TRT detectors.
The measurement of the missing transverse momentum two-vector,
pmissT, and its magnitude,
ETmiss, is based on the transverse momenta of all electron and muon candidates, all jets, and all calorimeter clusters with
|η|<4.9 not associated to such objects. The quantity
Emiss,rel.Tis defined as:
Emiss,rel.T =
( ETmiss
if
∆φ`,j ≥π/2
ETmiss×
sin
∆φ`,jif
∆φ`,j < π/2
,(1) where
∆φ`,jis the azimuthal angle between the direction of
pmissTand that of the nearest electron, muon or jet. In a situation where one of the jets’ or the leptons’ momentum is badly reconstructed, such that it is aligned with the direction of
pmissT, only the
EmissTcomponent perpendicular to that object is considered. This is used to significantly reduce mis-measured
EmissTin processes such as
Z/γ∗ → e+e−, µ+µ−[53].
Signal electrons, muons and jets are then selected. Signal electrons are further required to pass the
“tight” [52] quality criteria, which places additional requirements on the ratio of calorimetric energy to track momentum, and the number of high-threshold hits in the TRT. They are also required to be isolated: the
pTsum of tracks above 1 GeV within a cone of size
∆R = p(
∆η)2+(
∆φ)2 <0.2 around each electron candidate (excluding the electron candidate itself) is required to be less than 10% of the electron
pT. Signal muons must also be isolated: the
pTsum of tracks within a cone of size
∆R <0.2 around the muon candidate is required to be less than 1.8 GeV.
Signal jets are subject to the further requirements
pT >30 GeV,
|η| <2.5 and the “jet vertex frac- tion” [54] is reasonably high (0.75). The jet vertex fraction quantifies the fraction of track transverse momentum from the primary vertex, associated to a jet. This variable is used to remove jets that origi- nated from other collisions, and also discards jets without reconstructed tracks.
A
b-tagging algorithm [55], which exploits the long lifetime of weakb- andc-hadron decays inside acandidate jet, is used to identify jets containing a
b-hadron decay. The mean nominalb-tagging efficiency, computed on
t¯tMC events, is 80%, with a misidentification (mis-tag) rate for light-quark/gluon jets of less than 1%. Scale factors (which are
pTand
ηdependent) are applied to all MC samples to correct for small discrepancies in the
b-tagging performance observed in data with respect to simulation.Basic data quality requirements are then applied. Selected events in each signal region (SR) and
control region (CR) must satisfy the following requirements. The primary vertex in the event must have
at least five associated tracks and each event must contain exactly two leptons of opposite sign (OS) or
same sign (SS). Both of these leptons must additionally satisfy the full list of lepton requirements, and
Targeted Process Signal Region Two Lepton Final States
l
˜
±l˜
∓→(l
±χ˜
01)
+(l
∓χ˜
01) SR-m
T2 χ˜
±1χ˜
∓1 →(l
±νχ˜
01)
+(l
∓νχ˜
01) SR-m
T2, SR-OSjveto
χ˜
02χ˜
i →(l
±l∓χ˜
01)
+(q
q¯
0χ˜
01) SR-2jets
Three Lepton Final States
χ
˜
02χ˜
±1 →(l
±l∓χ˜
01)
+(l
±νχ˜
01) SR-OSjveto, SR-SSjveto
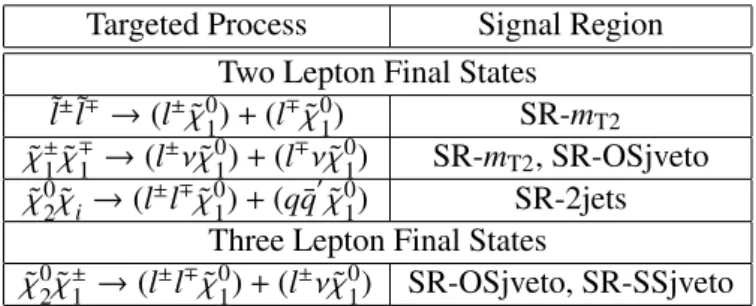
Table 1: Decay modes targeted by each SR, ˜
χidenotes either a chargino or a neutralino. In decays producing three real leptons, one must be mis-reconstructed or fall outside the acceptance of the detector.
the dilepton invariant mass,
mll, must be greater than 20 GeV across all flavour combinations.
5 Signal Regions
In this analysis four SR are defined. The first and main SR (labelled SR-m
T2) exploits the stransverse mass variable,
mT2[56, 57], and provides sensitivity to both ˜
χ±1and ˜
l±pair production. The search for ˜
l±pair production uses only the same flavour channels
e+e−and
µ+µ−, while the ˜
χ±1pair production search also relies on
e±µ∓. Additional sensitivity to ˜
χ±1pair production is provided by the next SR, SR-OSjveto, which selects OS lepton pairs with high
ETmissin events with no signal jets.
The production modes ˜
χ02χ˜
±ior ˜
χ02χ˜
0i, with the subsequent decays ˜
χ02 →l±l∓χ˜
01and ˜
χ0i,χ˜
±i → qq¯
0χ˜
01are targeted by a region called SR-2jets, which selects events with two signal jets and two OS leptons.
In this note the region SR-OSjveto and an equivalent region, SR-SSjveto, which instead selects the events with SS lepton pairs, also target a three lepton final state. The explicit veto in this analysis on a third lepton makes the results in these regions orthogonal to results from direct gaugino searches with three or more leptons [29]. These regions recover events not reconstructed in a search with
≥3 leptons because one of the leptons falls outside the acceptance of the detector and selection criteria. The processes directly targeted by each SR are stated explicitly in Table 1.
The exact requirements on the values to be taken by each variable in each SR were determined by optimising the expected reach using the
Znvariable [58], a measure of significance, in either the neutralino-slepton mass plane of the pMSSM model (SR-m
T2), the neutralino-chargino mass plane of the simplified model (SR-OSjveto and SR-SSjveto) or the
M1−µmass plane of the pMSSM (SR-2jets).
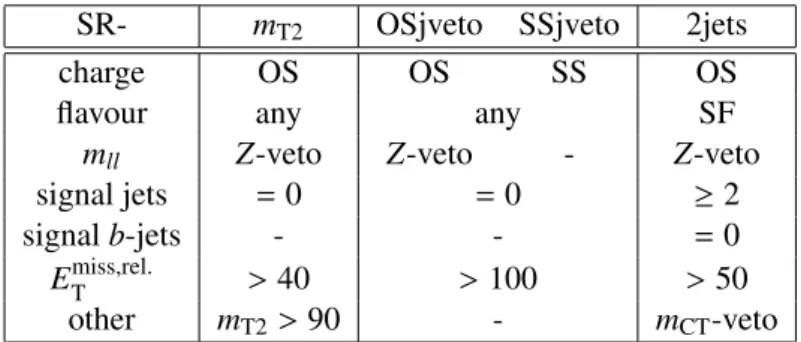
Table 2 summarises the requirements for entering each SR.
5.1 Direct Slepton and Chargino Pair Production
In SR-m
T2the properties of
mT2are exploited to search for ˜
l±l˜
∓and ˜
χ±1χ˜
∓1production followed by decay to final states containing exactly two OS leptons (of di
fferent flavour, DF, or same flavour, SF), no signal jets, and
ETmissfrom the two ˜
χ01. In this SR
t¯tand
WWare dominant backgrounds. For large mass differences between the sleptons (charginos) and the lightest neutralino, the
mT2distribution for signal events extends significantly beyond the distributions for
t¯tand diboson backgrounds.
The optimised value for the lower
mT2requirement is 90 GeV, just above the
W-mass (which is theapproximate end-point of the
WWand
t¯tdistributions). A rejection of events with
mllwithin 10 GeV
of the
Z-mass reduces Z/γ∗backgrounds. For the direct slepton pMSSM models with a 20 GeV neu-
tralino, the product of the kinematic and geometrical acceptance and reconstruction and event selection
efficiencies varies between 0.1 and 4.0% in this SR for slepton masses between 90 and 190 GeV. For
SR-
mT2OSjveto SSjveto 2jets
charge OS OS SS OS
flavour any any SF
mll Z-veto Z-veto
-
Z-vetosignal jets
=0
=0
≥2
signal
b-jets- -
=0
Emiss,rel.T >
40
>100
>50
other
mT2>90 -
mCT-veto
Table 2: Signal regions. OS (SS) denotes two opposite-sign (same-sign) signal leptons, of same (SF) or di
fferent (DF) flavour. The
Z-veto rejects events withmllwithin 10 GeV of the
Z-mass (91.2 GeV). The mCT-veto rejects events kinematically consistent with
t¯t. The values quoted forETmiss,reland
mT2are in units of GeV.
fixed 190 GeV slepton mass, this product increases from 0.2 to 4.0% as the neutralino mass decreases from 140 to 20 GeV. In the simplified models, for ˜
χ±1χ˜
∓1pair production, the product of acceptance and e
fficiency ranges between 1 and 7%, increasing towards higher chargino and lower neutralino masses.
In SR-OSjveto a different approach to reducing the backgrounds is taken. The explicit jet veto in SR-OSjveto suppresses the
t¯tbackground. The dominant
Zbackground is suppressed by rejecting events with
mllwithin 10 GeV of the
Z-mass. The final requirement, onEmiss,rel.T, further increases sensitivity to the signals which are associated with much higher
EmissTthan the SM backgrounds. In the simplified models, for ˜
χ±1χ˜
∓1pair production, the product of acceptance and e
fficiency ranges between 1 and 8%, increasing towards higher chargino and lower neutralino masses.
5.2 Other Weak Gaugino Production
In the production channel and decay ˜
χ02χ˜
i →(l
±l∓χ˜
01)
+(q
q¯
0χ˜
01) the resulting OS two lepton final state has significant
EmissTand at least two signal jets. The region SR-2jets is thus sensitive to these decays.
In SR-2jets, top background is reduced using a “top-tag” veto. The top-tagging requirement is imposed through the use of the contransverse mass variable
mCT[59]. This observable can be calculated from the four-momenta of the selected signal jets and leptons:
m2CT
(v
1, v2)
=[E
T(v
1)
+ET(v
2)]
2−
pT
(v
1)
−pT(v
2)
2,(2) where
vican be a lepton (l), jet (
j) or a lepton-jet combination. Transverse momentum vectors aredefined by
pTand transverse energies
ETare defined as
ET = qp2T+m2
. The quantities
mCT(
j, j), mCT(l,
l) andmCT(
jl,jl) are bounded from above by analytical functions of the top quark andWboson masses. A top-tagged event must have at least two jets with
pT>20 GeV, and the scalar sum of the
pTof at least one combination of two signal jets and the two signal leptons in the event must exceed 100 GeV.
Furthermore, top-tagged events are required to possess
mCTvalues calculated from combinations of signal jets and leptons consistent with the expected bounds from
t¯tevents as described in Ref. [60].
Further top rejection is achieved using a
b-jet veto. Zbackgrounds are reduced using the
Z-veto, andsensitivity increased by searching at high-E
miss,rel.T.
In the regions targeting fully leptonic ˜
χ02χ˜
±1decays (SR-OSjveto and SR-SSjveto), a veto on events
containing a signal jet reduces hadronic backgrounds, and high
Emiss,rel.Tincreases the sensitivity to SUSY
decays. The final state leptons can be of either OS or SS. In the absence of significant expected
Zbackground in the SS SR, no
Z-veto is applied.top
WW Z+X mll Z-veto Z-veto Z-windowsignal jets
≥2
=0 =0,
≥2,
≥0
signal b-jets
≥1
=0 ≥0,
=0,
≥0
Emiss,rel.T >100, 50, 40 70-100
>100, 50, 40
other - - -,
mCT-veto, -
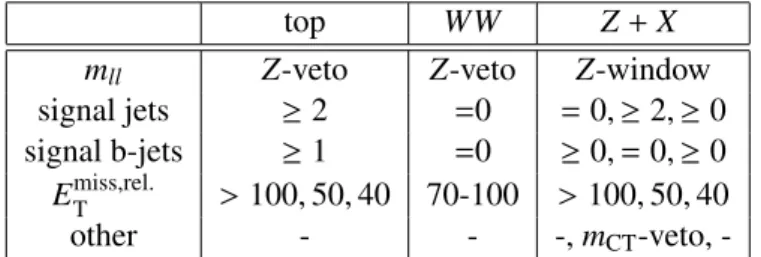
Table 3: Requirements for entering each CR for top,
WWand
Z+Xbackground estimation in the OS SR. These are used to estimate the top background in all OS SR,
WWin SR-OSjveto and
Z+Xin all SF channels of the OS SR. When each OS SR requires differing CR definitions, the conditions are given as a comma separated list (SR-OSjveto, SR-2jets, SR-m
T2). The
Z-veto is a rejection of events withmllwithin 10 GeV of the
Z-mass (91.2 GeV), whereas theZ-window defines the reverse. In theWWcontrol region the
b-jets considered are those with pT >20 GeV. The values quoted for
ETmiss,relare in units of GeV.
6 Background Evaluation
6.1 Backgrounds in SR-m
T2In this note, SR-m
T2is used to search for ˜
l±pair production and provides the best sensitivity to ˜
χ±1pair production. The main backgrounds in this region are: fully-leptonic
t¯tand single top,
Z/γ∗+jets and dibosons (WW ,
WZand
ZZ).Fully-leptonic
t¯tis comparable in size to the
WWbackground in all flavour channels.
Z/γ∗+jets,WZand
ZZprocesses (collectively,
Z+X) are a small proportion of events in the DF channel, but comparablein size to the
WWand
t¯tbackgrounds in the SF channels. The remainder of the SM background is accounted for by fake lepton backgrounds. The methods used to evaluate these backgrounds in SR-m
T2are described in the following sections.
6.1.1 Top
The combined contribution from
t¯tand
Wt-channel single top events in each channel is evaluated bynormalising MC to data in an appropriate CR. Events in the CR (Table 3) must contain at least two signal jets, one of which must be
b-tagged, and pass the requirement thatEmiss,rel.Tmust be greater than 40 GeV.
The corresponding CR is dominated by top events. The contamination from non-top events is less than 4%. The number of top events in the SR (N
topSR) is estimated from the number of data events in the CR (N
topCR), after the subtraction of non-top backgrounds, using a transfer factor
T:
NXSR= NXCR× T ×
S
T.(3) The factor,
T, the ratio of top events in the SR to the CR is derived using MC.
T =
NXSR NXCR
MC
.
(4)
The factor S
Tcorrects for possible differences in jet-veto efficiency between data and MC. Good agreement is observed in separate samples of
t¯tand
Z/γ∗+jets events and so this factor is taken to beequal to 1, with an uncertainty of 6%.
The transfer factor is evaluated before the
mT2requirement is applied in the SR. Limited statistics do
not allow the factor to be evaluated after this requirement without introducing significant uncertainty (by
design this is the tail of the
mT2distribution for
t¯t). The efficiency of this requirement is then evaluatedusing MC for a looser selection (which is assumed not to change the
mT2shape) and used to obtain the final estimate in SR-m
T2. The efficiency of the
mT2requirement is found to be
∼0.02 in each channel for top events with an uncertainty of
∼50%. The uncertainty is largely dominated by MC statistical uncertainty, generator uncertainties and jet and lepton scales and resolutions.
The evaluated
t¯tcomponents in each channel are consistent with pure MC estimates normalised to cross-sections to within 1σ. There is also consistent agreement at this level between data and MC in the CR. Negligible contamination from the SUSY signal models generated, in the region of the expected reach, is predicted.
6.1.2 Z+X
The
Z/γ∗+jets background in the SF channels is also estimated by normalising MC to data in a suitable CR. This is important in order to handle appropriately possible detector imperfections a
ffecting
EmissTmis-measurement. This technique also estimates the
ZWand
ZZcomponents, providing a combined estimate of the total
Z+Xbackground in the SF channels.
In the DF channel the
Z/γ∗+jets contribution is significantly smaller and arises mainly from
Z/γ∗→ ττdecays. This and the diboson components of the
Z+Xbackground in the DF channel are estimated using MC.
The CR (Table 3) used to estimate the
Z+Xbackground in the SF channels is defined to be identical to the SR but with the
Z-veto reversed. The normalisation is evaluated before themT2requirement, and the e
fficiency of the
mT2requirement measured separately and applied. The population of data events inside the CR not produced by
Z+Xprocesses is estimated using data
eµevents inside the
Z-window, correctingfor the differences between electron and muon reconstruction efficiencies. This subtraction removes less than 2% of the events in the CR. This procedure also subtracts contributions from
Z/γ∗→ττ+jets events which must be estimated using MC simulation. The MC
mT2requirement e
fficiency for
Z+Xevents is taken to be 0.004 (0.003) for
e+e−(µ
+µ−) events with
∼50% uncertainty.
The resulting estimates in the SF channels are consistent with MC at the 1σ level. No significant signal contamination is expected for the SUSY model points considered in the region of sensitivity for the searches reported in this note.
6.1.3 WW
The
WWbackground is evaluated using MC normalised to cross-section and luminosity. The predictions from a variety of generators (see Section 3) were compared before application of the
mT2requirement (to maximise statistics for comparison), in order to assess the theoretical uncertainty on this estimate.
The
mT2distribution in data agrees well with that in MC, and the
Emiss,rel.Tregion under consideration (> 40 GeV) is close to the bulk of the
WWsample.
6.1.4 Fake leptons
In this note the term “fake leptons” refers to both misidentified jets and real leptons that arise from decays
or conversions. The numbers of fake lepton events are estimated using the “matrix method” [61]. First,
fake leptons are identified as those satisfying a loose set of identification requirements corresponding to
medium-level identification requirements and no isolation. The real e
fficiency
ris calculated using data
as the fraction of these loose leptons passing the signal lepton identification and isolation requirements in
events lying within 5 GeV of the
Z-mass. The fake efficiency fis calculated separately for misidentified
jets or decays and conversions. The fake e
fficiency for misidentified jets or decays is calculated using
MC events with
Emiss,rel.Tbetween 40 and 100 GeV. The fake e
fficiency for conversions is estimated using
di-muon events in data with
mllwithin 10 GeV of the
Z-mass, Emiss,rel.T <50 GeV and at least one loose electron with
mT <40 GeV (the conversion candidate). The overall
fused is then the weighted (according to the relative proportions of each component present in the SR) average of these two fake efficiencies. Then, in the SR the observed numbers of events in data with two loose leptons, two signal leptons, or one of each are counted. The number of events containing fake leptons in each SR is finally obtained by acting on these observed counts with a 4
×4 matrix with terms containing
fand
rwhich relates real-real, real-fake, fake-real and fake-fake lepton event counts to tight-tight, tight-loose, loose- tight and loose-loose counts.
6.2 Backgrounds in SR-OSjveto, SR-SSjveto and SR-2jets
The same techniques are used to estimate the backgrounds in each remaining SR, with two exceptions which are detailed in this section. Table 3 details any changes to CR definitions used.
1. Due to the high
Emiss,rel.Trequirement (> 100 GeV) in SR-OSjveto,
WWis estimated using MC normalised to data in a CR. The CR used for its estimate is defined using the same requirements as the SR but with slightly lower
Emiss,rel.T(for orthogonality with the SR) and an additional
b-jetveto to suppress
t¯t(Table 3). This CR is subject to a 24% contamination from top events, which is subtracted using MC.
2. In SR-SSjveto, the leptons have the same charge, resulting in a generally different background composition, and the presence of an additional component: “charge-flip”. The background com- ponents in this region are: fake leptons (estimated using the described matrix method), dibosons (estimated using MC) and charge-flip. Charge-flip background arises when an electron in an event undergoes hard bremsstrahlung with subsequent photon conversion. The probability of an electron undergoing a flip is measured from
Zevents in data using a likelihood technique [62], and in MC.
This probability, evaluated as a function of electron rapidity and
pT, is applied to
t¯t→e±l∓,
Z+jetsand diboson MC events to evaluate the number of
e±e±and
e±µ±events resulting from the charge- flip mechanism. The probability of misidentifying the charge of a muon is negligible. The possible double counting of charge-flip events in the matrix method for SR-SSjveto is not significant.
7 Systematic Uncertainties
In this analysis systematic uncertainties arise on the estimates of the background in the signal regions, as well as on the estimate of the SUSY signal itself. The primary sources of systematic uncertainty are the jet energy scale (JES) calibration, the jet energy resolution (JER) uncertainty [51], theory and MC modelling uncertainties, and uncertainties on the object reconstruction and identification. Additional statistical uncertainties arise from limited numbers of MC and data events in the CR and SR, and a 3.9%
luminosity uncertainty [63, 64] for normalising MC to cross-sections.
The JES has been determined from a combination of test beam, simulation and in-situ measurements from 2011 pp collision data. Uncertainties on the lepton identification, momentum/energy scale and resolution are estimated from samples of
Z → l+l−,
J/ψ → l+l−and
W± → l±νdecays [65, 66]. The uncertainties on the jet and lepton energies are propagated to
ETmiss,rel.; an additional uncertainty on
EmissTarising from energy deposits not associated to any reconstructed objects is also included. Uncertainties on the
b-tagging efficiency are derived from data samples containing muons associated to jets [67] and the method described in Ref. [68]. Included are uncertainties in the mis-tag rate from charm [69], and light flavour tagging [70].
Theory and MC modelling uncertainties are evaluated for
t¯tusing the prescriptions described in
Ref. [71] (choice of generator, and ISR
/FSR). For dibosons they are considered by varying the choice of
generator. Theoretical uncertainties on the
Z/γ∗+jets background from varying the PDF and renormali-sation scales are also included.
When evaluating the fake lepton component in each region the dominant uncertainties arise from variations in the choice of CR, the dependency of the efficiencies on
ETmiss,rel., differences between effi- ciencies obtained using OS and SS events and uncertainties in the relative normalisations of the di
fferent components.
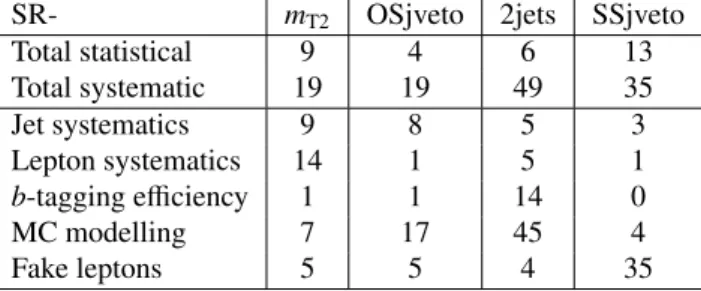
The relative sizes of these sources of systematic uncertainty are detailed in Table 4. In SR-m
T2jet and lepton energy scales and resolutions are the most significant uncertainties. In SR-OSjveto and SR-2jets, where
t¯tand
WWare the most significant SM backgrounds (accounting for approximately 80-85% of the SM contribution), the uncertainties in the MC modelling dominate. In SR-SSjveto, because of the significant fake component, the error on the fake estimate from the sources described becomes the only significant source of uncertainty.
SR- mT2 OSjveto 2jets SSjveto
Total statistical 9 4 6 13
Total systematic 19 19 49 35
Jet systematics 9 8 5 3
Lepton systematics 14 1 5 1
b-tagging efficiency 1 1 14 0
MC modelling 7 17 45 4
Fake leptons 5 5 4 35
Table 4: Systematic uncertainties (%) on the background estimates in each SR for all flavours combined.
The total statistical uncertainty includes limited MC statistics in the CR and SR. Jet systematics include:
JES, JER and
EmissTcluster and pile-up uncertainties. Lepton systematics include: all lepton scales and resolutions, reconstruction and trigger efficiencies. MC modelling uncertainties include choice of generator, ISR
/FSR and modelling of the
Z/γ∗+jets line-shape.
In the SUSY mass planes, the theoretical uncertainty on each of the signal cross-sections is in- cluded. These arise from considering the cross-section envelope defined using the 68% C.L. ranges of the CTEQ6.6 and MSTW 2008 NLO PDF sets, and independent variations of the factorisation and renor- malisation scales (see Section 3). Further uncertainties on the numbers of predicted signal events arise from the various experimental uncertainties.
8 Results and Interpretation
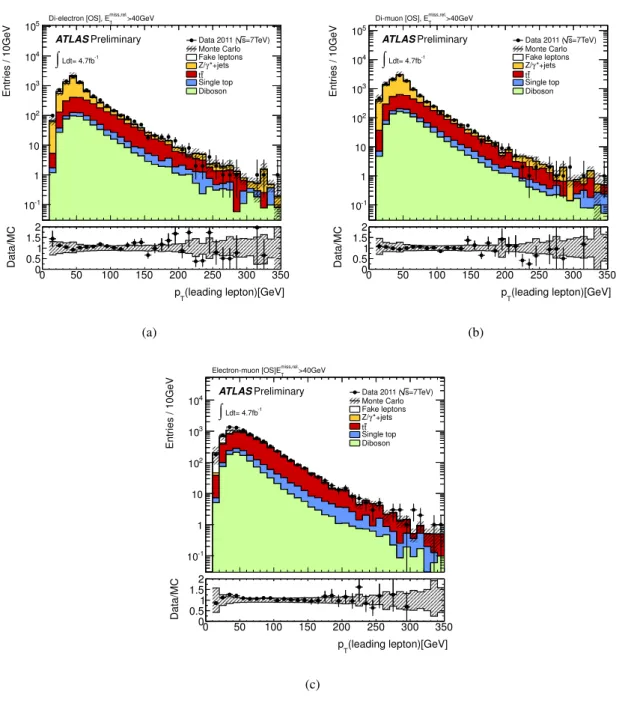
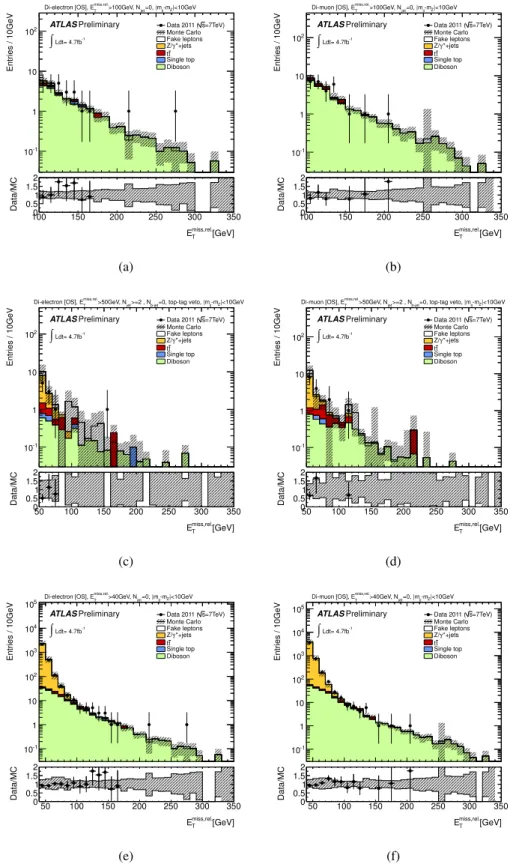
Figures 1 to 3 illustrate data and MC (but with the fake lepton component evaluated using the matrix method) in the various CR. The hashed region illustrates the size of the experimental uncertainties.
Figure 4 illustrates the level of agreement in each SR. For each SR two illustrative model points are also presented.
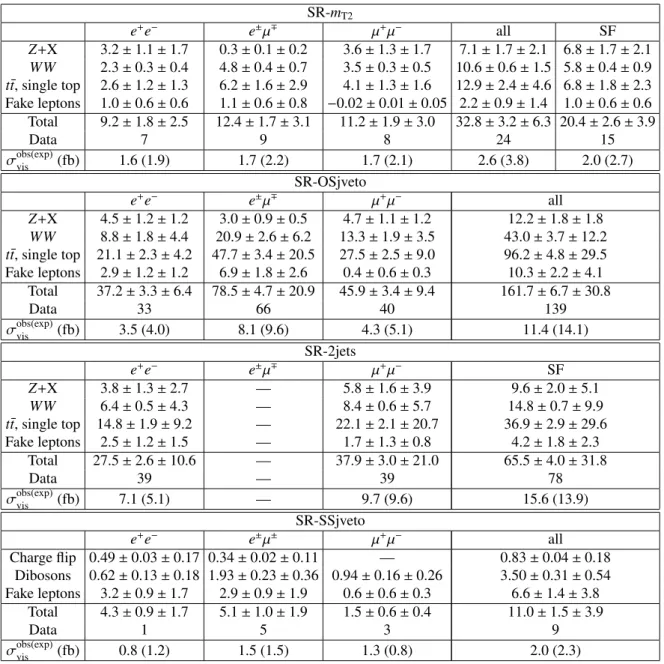
Table 5 compares the observations in data in each flavour channel and in each SR with the evaluated background contributions. Good agreement is observed across all channels and in each SR. The absence of evidence for SUSY weak production allows limits to be set on the visible cross-section for non-SM physics in each SR,
σvis = σ×ε×A, for which this analysis has acceptance Aand e
fficiency
ε. Theseare calculated using the modified frequentist CL
sprescription [72] by comparing the number of observed events in data with the SM expectation using the profile likelihood ratio as test statistic. All systematic uncertainties and their correlations are taken into account via nuisance parameters.
The direct slepton pair production 95% exclusion region is shown in Figure 5 (a) in the neutralino-
slepton mass plane, using the results of SR-m
T2in the SF channel. Shown are the 95% CL
sexpected
0 50 100150200250300350
Entries / 10GeV
10-1
1 10 102
103
104
105
=7TeV) s Data 2011 ( Monte Carlo Fake leptons
*+jets γ Z/
t t Single top Diboson
ATLASPreliminary
Ldt= 4.7fb-1
∫
>40GeV
T miss,rel.
Di-electron [OS], E
(leading lepton)[GeV]
pT
0 50 100 150 200 250 300 350
Data/MC 00.5
1 1.5 2
(a)
0 50 100150200250300350
Entries / 10GeV
10-1
1 10 102
103
104
105
=7TeV) s Data 2011 ( Monte Carlo Fake leptons
*+jets γ Z/
t t Single top Diboson
ATLASPreliminary
Ldt= 4.7fb-1
∫
>40GeV
T miss,rel.
Di-muon [OS], E
(leading lepton)[GeV]
pT
0 50 100 150 200 250 300 350
Data/MC 00.5
1 1.5 2
(b)
0 50 100 150 200 250 300 350
Entries / 10GeV
10-1
1 10 102
103
104
=7TeV) s Data 2011 ( Monte Carlo Fake leptons
*+jets γ Z/
t t Single top Diboson
ATLASPreliminary
Ldt= 4.7fb-1
∫
>40GeV
T miss,rel.
Electron-muon [OS]E
(leading lepton)[GeV]
pT
0 50 100 150 200 250 300 350
Data/MC 0
0.51 1.5 2
(c)
Figure 1: The leading lepton
pTdistributions in the
e+e−(a),
µ+µ−(b) and
e±µ∓(c) channels after the
application of the
Emiss,rel.T >40 GeV cut. The hatched bands indicate the experimental uncertainties
on the background expectations. All components are from MC except for that which is labelled “Fake
leptons”. The bottom panels show the ratio of the data to the expected background (points) and the
systematic uncertainty on the background (shaded area).
0 20 40 60 80 100 120 140
Entries / 5GeV
10-1
1 10 102
103
104
ATLASPreliminary Ldt= 4.7fb-1
∫
>40GeV
T miss,rel.
|>10GeV,E -mZ
>0,|mll b-jet j=2,N Di-electron [OS], N
=7TeV) s Data 2011 ( Monte Carlo Fake leptons
t t Single top Diboson
[GeV]
mT2
0 20 40 60 80 100 120 140
Data/MC
0 0.51 1.5 2
(a)
0 20 40 60 80 100 120 140
Entries / 5GeV
1 10 102
103
104
ATLAS Preliminary Ldt= 4.7fb-1
∫
>40GeV
T miss,rel.
|>10GeV,E -mZ
>0,|mll b-jet j=2,N Electron-muon [OS], N
=7TeV) s Data 2011 ( Monte Carlo Fake leptons
t t Single top Diboson
[GeV]
mT2
0 20 40 60 80 100 120 140
Data/MC
0 0.51 1.5 2
(b)
0 20 40 60 80 100 120 140
Entries / 5GeV
10-1
1 10 102
103
104
ATLAS Preliminary Ldt= 4.7fb-1
∫
>40GeV
T miss,rel.
|>10GeV,E -mZ
>0,|mll b-jet j=2,N Di-muon [OS], N
=7TeV) s Data 2011 ( Monte Carlo Fake leptons
t t Single top Diboson
[GeV]
mT2
0 20 40 60 80 100 120 140
Data/MC 00.5
1 1.5 2
(c)
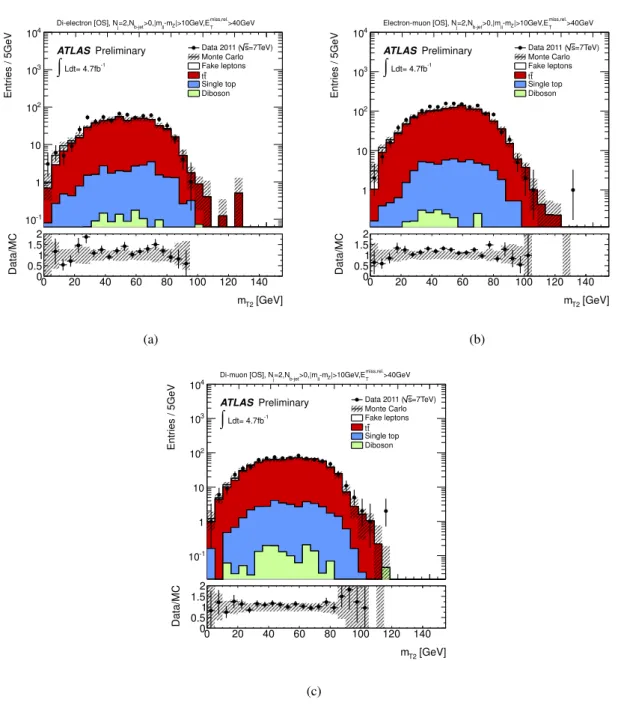
Figure 2: The
mT2distribution in the
e+e−(a),
e±µ∓(b) and
µ+µ−(c) channels top control region for
SR-m
T2. The hatched bands indicate the experimental uncertainties on the background expectations. All
components are from MC except for that which is labelled “Fake leptons”. The bottom panels show the
ratio of the data to the expected background (points) and the systematic uncertainty on the background
(shaded area).
100 150 200 250 300 350
Entries / 10GeV
10-1
1 10
102 Data 2011 (s=7TeV)
Monte Carlo Fake leptons
*+jets γ Z/
t t Single top Diboson ATLASPreliminary
Ldt= 4.7fb-1
∫
|<10GeV -mZ
=0, |mll
>100GeV, Njet T miss,rel.
Di-electron [OS], E
[GeV]
T miss,rel.
E
100 150 200 250 300 350
Data/MC 00.5
1 1.5 2
(a)
100 150 200 250 300 350
Entries / 10GeV
10-1
1 10 102
=7TeV) s Data 2011 ( Monte Carlo Fake leptons
*+jets γ Z/
t t Single top Diboson ATLASPreliminary
Ldt= 4.7fb-1
∫
|<10GeV -mZ
=0, |mll
>100GeV, Njet T miss,rel.
Di-muon [OS], E
[GeV]
T miss,rel.
E
100 150 200 250 300 350
Data/MC 00.5
1 1.5 2
(b)
50 100 150 200 250 300 350
Entries / 10GeV
10-1
1 10 102
=7TeV) s Data 2011 ( Monte Carlo Fake leptons
*+jets γ Z/
t t Single top Diboson ATLASPreliminary
Ldt= 4.7fb-1
∫
|<10GeV -mZ
=0, top-tag veto, |mll b-jet
>=2 , N
>50GeV, Njet T miss,rel.
Di-electron [OS], E
[GeV]
T miss,rel.
E
50 100 150 200 250 300 350
Data/MC 00.5
1 1.5 2
(c)
50 100 150 200 250 300 350
Entries / 10GeV
10-1
1 10 102
=7TeV) s Data 2011 ( Monte Carlo Fake leptons
*+jets γ Z/
t t Single top Diboson ATLASPreliminary
Ldt= 4.7fb-1
∫
|<10GeV -mZ
=0, top-tag veto, |mll b-jet
>=2 , N
>50GeV, Njet T miss,rel.
Di-muon [OS], E
[GeV]
T miss,rel.
E
50 100 150 200 250 300 350
Data/MC 00.5
1 1.5 2
(d)
50 100 150 200 250 300 350
Entries / 10GeV
10-1
1 10 102
103
104
105
=7TeV) s Data 2011 ( Monte Carlo Fake leptons
*+jets γ Z/
t t Single top Diboson ATLASPreliminary
Ldt= 4.7fb-1
∫
|<10GeV -mZ
=0, |mll
>40GeV, Njet T miss,rel.
Di-electron [OS], E
[GeV]
T miss,rel.
E
50 100 150 200 250 300 350
Data/MC 0
0.51 1.5 2
(e)
50 100 150 200 250 300 350
Entries / 10GeV
10-1
1 10 102
103
104
105 Data 2011 (s=7TeV)
Monte Carlo Fake leptons
*+jets γ Z/
t t Single top Diboson ATLASPreliminary
Ldt= 4.7fb-1
∫
|<10GeV -mZ
=0, |mll
>40GeV, Njet T miss,rel.
Di-muon [OS], E
[GeV]
T miss,rel.
E
50 100 150 200 250 300 350
Data/MC 0
0.51 1.5 2
(f)