ATLAS-CONF-2012-077 06July2012
ATLAS NOTE
ATLAS-CONF-2012-077
July 3, 2012
Search for direct production of charginos and neutralinos in events with three leptons and missing transverse momentum in √
s = 7 TeV pp collisions with the ATLAS detector
The ATLAS Collaboration
Abstract
A search for the direct production of charginos and neutralinos in final states with three electrons or muons and missing transverse momentum is presented. The analysis is based on 4.7 fb
−1of
√s =7 TeV proton-proton collision data delivered by the Large Hadron Col- lider and recorded with the ATLAS detector. Observations are consistent with Standard Model expectations in three signal regions that are either depleted or enriched in
Z-bosondecays. Upper limits at 95% confidence level are set in R-parity conserving phenomeno- logical minimal supersymmetric models and in simplified models, significantly extending previous results.
c Copyright 2012 CERN for the benefit of the ATLAS Collaboration.
Reproduction of this article or parts of it is allowed as specified in the CC-BY-3.0 license.
1 Introduction
Supersymmetry (SUSY) [1–9] postulates the existence of SUSY particles, or “sparticles”, with spin differing by one-half unit with respect to that of their Standard Model (SM) partner. If R-parity [10–14] is conserved, the lightest SUSY particle (LSP) is stable and sparticles can only be pair-produced and decay into final states with SM particles and LSPs. Charginos ( ˜
χ±i,
i=1, 2) and neutralinos ( ˜
χ0j,
j=1, 2, 3, 4) are the mass eigenstates formed from the linear superposition of the SUSY partners of the Higgs and electroweak gauge bosons. These are the Higgsinos, and the winos, zino, and bino, collectively known as gauginos. Naturalness requires ˜
χ±iand ˜
χ0j(and third generation sparticles) to have masses in the hundreds of GeV range [15]. In scenarios where squark and gluino masses are larger than a few TeV, the direct production of gauginos may be the dominant SUSY process at the Large Hadron Collider (LHC).
Charginos can decay into leptonic final states via sneutrinos (˜
νℓ±), sleptons ( ˜
ℓν) orWbosons (W
χ˜
01), while unstable neutralinos can decay via sleptons (ℓ
ℓ˜
±) or
Zbosons (Z
χ˜
01).
This document presents a search with the ATLAS detector for the direct production of charginos and neutralinos decaying to a final state with three leptons (electrons or muons) and missing transverse momentum, the latter originating from the two undetected LSPs and the neutrinos. The analysis is based on 4.7 fb
−1of proton-proton collision data delivered by the LHC at a center-of-mass energy
√s=
7 TeV between March and October 2011. The search described here significantly extends the current mass limits on charginos and neutralinos set by ATLAS [16, 17] and CMS [18]. Similar searches have been conducted at Tevatron [19, 20] and LEP [21], where a model independent limit of 103.5 GeV was set at 95% confidence limit (CL) on the mass of promptly decaying charginos.
2 Detector Description
ATLAS [22] is a multipurpose particle detector with forward-backward symmetric cylindrical geometry.
It includes an inner tracker (ID) immersed in a 2 T magnetic field providing precision tracking of charged particles for pseudorapidities
|η|<2.5 [23]. Calorimeter systems with either liquid argon or scintillating tiles as the active media provide energy measurements over the range
|η|<4.9. The muon detectors are positioned outside the calorimeters and are contained in an air-core toroidal magnetic field produced by super conducting magnets with field integrals varying from 1 to 8 T
·m. They provide trigger and high-precision tracking capabilities for
|η|<2.4 and
|η|<2.7, respectively.
3 New Physics Scenarios
In this analysis, observations are interpreted in the phenomenological minimal supersymmetric SM (pMSSM [24]) and in simplified models [25]. Additional interpretations of the results in the context of minimal universal extra dimensions (mUED [26]) and general gauge mediated SUSY (GGM [27, 28]) models are provided in Appendix A.
In the pMSSM the mixing for the ˜
χ±iand ˜
χ0jdepends on the gaugino masses
M1and
M2, the Higgs mass parameter
µ, and tanβ, the ratio of the expectation values of the two Higgs doublets. The dominantgauginos production leading to three-lepton final states is ˜
χ±1χ˜
02production via the s-channel exchange of a virtual gauge boson. Other ˜
χ±iχ˜
0jprocesses contribute to a maximum of 20% to three-lepton final states depending on the values of the mass parameters. The right-handed sleptons (including third-generation sleptons) are assumed to be degenerate and have a mass
mℓ˜R=(m
χ˜02 +mχ˜0
1
)/2, set via the right-handed
SUSY-breaking slepton mass parameter at the electro-weak scale. In these scenarios, decays to sleptons
are favored. The parameter tan
βis set to 6, yielding comparable branching ratios into each slepton
2 TeV. The trilinear couplings are all set to zero, except for the stop sector, which is designed to achieve maximum mixing and thus a large Higgs mass.
In simplified models, the masses of the relevant particles ( ˜
χ±1, ˜
χ02, ˜
χ01, ˜
ν, ˜ℓL) are the only free param- eters. The charginos and heavy neutralinos are set to be wino-like and mass degenerate, and the lightest neutralino is set to be bino-like. The ˜
χ±1and ˜
χ02are pair-produced and decay via left-handed sleptons, including staus, and sneutrinos of mass
m˜ν=mℓ˜L=(m
χ˜01+mχ˜±
1
)/2) with a branching ratio of 50% each.
4 Monte Carlo simulation
Several Monte Carlo (MC) generators are used to simulate SM processes and new physics signals rel- evant for this analysis.
SHERPA[29] is used to simulate diboson processes
WZand
ZZ. These includeall diagrams leading to three leptons and one neutrino, and to four leptons respectively, including in- ternal conversions (virtual photons converting into lepton pairs).
HERWIG[30] is used for
WW, while MadGraph[31] is used for the
ttW,¯
ttWW,¯
ttZ,¯
Wγand
Zγprocesses.
MC@NLO[32] is chosen for the simulation of single and pair production of top quarks, and
ALPGEN[33] is used to simulate
W/Z+jets.Expected diboson yields are normalized using next-to-leading order (NLO) QCD predictions obtained with
MCFM[34, 35]. The top-quark pair-production contribution is normalized to approximate next-to- next-to-leading order calculations (NNLO) [36] and the
ttW¯ (W)/Z contributions are normalized to NLO results in agreement with the latest calculation within the quoted systematic uncertainties [37, 38]. The
Wγand
Zγsamples are normalized to the LO cross-sections from the
MadGraphgenerator and an un- certainty is assigned to account for the difference between LO and NLO. The QCD NNLO
FEWZ[39, 40]
cross-sections are used for normalization of the inclusive
Z+light-flavor jets. The ratio of the NNLO toLO cross-section is used to rescale the
Z+heavy-flavor jets LO cross-sections.The choice of the parton distribution functions (PDFs) depends on the generator. The
CTEQ6L1[41]
PDFs are used with
MadGraphand
ALPGEN, and the CT10[42] PDFs with
MC@NLOand
SHERPA. The MRTSmcalPDF set [43] is used for
HERWIG.The pMSSM samples are produced with
HERWIGand the simplified model samples with
HERWIG++[44].
The yields of the SUSY samples are normalized to the NLO cross-sections obtained from
PROSPINO[45]
using the PDF set
CTEQ6.6with the renormalization/factorization scales set to the average of the relevant gaugino masses.
Fragmentation and hadronization for the
ALPGENand
MC@NLO(MadGraph) samples are performed with
HERWIG(PYTHIA [46]), while for
SHERPA, this is performed internally. For all MC samples, thepropagation of particles through the ATLAS detector is modeled using
GEANT4[47, 48]. The effect of multiple proton-proton collisions in a bunch crossing is incorporated into the simulation by overlaying additional minimum bias events onto hard scatter events using
PYTHIA. Simulated events are weightedto match the distribution of the mean number of interactions per bunch crossing observed in data.
5 Event Reconstruction and Preselection
The data sample was collected with an inclusive selection of a single-muon trigger (
pµT>18 GeV), asingle-electron trigger (E
eT>20 or 22 GeV, depending on the instantaneous luminosity), a di-muon trigger(
pµT>10 GeV), a di-electron trigger (ETe>12 GeV), and a e-µtrigger (E
Te>10 GeV and pµT>6 GeV, onlyused for 75% of data collected). For single lepton triggers at least one lepton is requested to have
pT(E
T)
above 20 GeV (25 GeV) for muons (electrons); for di-lepton triggers at least two leptons are requested to
have
pT(µ, µ)>12,12 GeV,
ET(e,
e)>17,17 GeV orET(e),
pT(µ)>15,10 GeV. The
pT(E
T) thresholds are
are chosen such that the overall trigger efficiency is high, typically in excess of 90%, and independent of
the transverse momentum of the triggerable objects within uncertainties.
Events recorded during normal running conditions are analyzed if the primary vertex has five or more tracks associated to it. The primary vertex of an event is identified as the vertex with the highest
ΣpTof associated tracks. Events containing jets failing the quality criteria described in Ref. [49] are rejected to suppress both SM and beam-induced background. Events containing muons candidates having transverse impact parameter with respect to the primary vertex
|d0|>0.2 mm or longitudinal impact parameter with respect to the primary vertex
|z0|>1 mm are rejected to suppress cosmic muon background.
Electrons must satisfy
tightidentification criteria [50] and fulfill
|η|<2.47 and
ET>10 GeV, where
|η|and
ETare determined from the calibrated clustered energy deposits in the electromagnetic calorimeter and the matched ID track respectively. Muons are reconstructed by combining tracks in the ID and tracks in the muon spectrometer [51]. Reconstructed muons are considered as candidates if they have transverse momentum
pT>10 GeV and
|η|<2.4.
“Tagged” leptons are electrons and muons, well separated from each other and from candidate jets.
“Signal leptons” are tagged leptons for which the scalar sum of the transverse momenta of tracks within a cone
∆R≡ p(∆φ)
2+(∆η)
2 <0.2 around the lepton candidate, and excluding the lepton candidate track itself, is less than 10% of the
ETfor electrons and less than 1.8 GeV for muons. Tracks selected for the electron and muon isolation requirement defined above have
pT>1 GeV and are associated to the primary vertex of the event. To suppress leptons originating from secondary vertices, the distance of closest approach of the lepton track to the primary vertex, normalized to its uncertainty is requested to be small,
|d0|/σ(d0)
<6(3) for electrons (muons).
Jets are reconstructed with the anti-k
talgorithm [52] with a radius parameter of
R=0.4 using clus- tered energy deposits calibrated at the electromagnetic scale. The jet energy is corrected to account for the non-compensating nature of the calorimeter using correction factors obtained from MC simu- lation and parameterized as a function of the jet
ETand
η[49]. Jets considered in this analysis have
ET>20 GeV,
|η|<2.5 and a fraction of the jet’s track momenta that can be associated with the primary vertex above 0.75. Jets are identified as containing
b-hadron decays, and thus called “b-tagged”, usinga multivariate technique based on quantities such as the impact parameter of the tracks associated to the secondary vertex and the tracks in the jet, consistent with the expected topology of
b-quark decays. The b-tagging algorithm [53] correctly identifies b-quark jets in simulated top decays with an efficiency of60% and misidentifies jets containing light flavor quarks and gluons with a rate of
<1%, for jets with
|η|<
2.5 and jet
ET>20 GeV.
The missing transverse momentum,
EmissT, is the magnitude of the vector sum of the transverse mo- mentum or transverse energy of all
pT>10 GeV muons,
ET>20 GeV electrons,
ET>20 GeV jets, and calibrated calorimeter clusters with
|η|<4.9 not associated to these objects [54].
6 Signal Region Selection
Selected events must contain exactly three signal leptons. As leptonic decays of ˜
χ0jyield same-flavor opposite-sign (SFOS) lepton pairs, the presence of at least one such pair is required. The invariant mass of any SFOS lepton pair must be above 20 GeV to suppress background from low mass resonances and the missing transverse momentum must satisfy
EmissT >75 GeV.
Three signal regions are then defined: two “Z-depleted” regions (SR1a and SR1b), with no SFOS pairs having invariant mass within 10 GeV of the nominal
Z-boson mass; and a “Z-enriched” one (SR2),where at least one SFOS pair has an invariant mass within 10 GeV of the
Z-boson mass. Events inSR1a and SR1b are further required to contain no
b-tagged jets to suppress contributions from b-jet-rich backgrounds, where a fake lepton could originate from a heavy-flavor decay. SR1b is designed to increase sensitivity to new physics with large mass splittings by requiring all three leptons to have
pT >30 GeV. In both SR1b and SR2, the transverse mass
mT, using the
Emissand the lepton not forming the
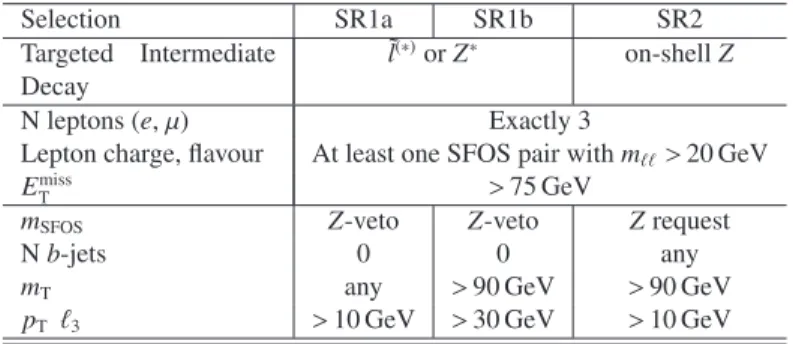
Table 1: The selection requirements for the three signal regions. The
Z-veto (request) rejects (selects)events with
mSFOSwithin 10 GeV of the
Z-mass (91.2 GeV). ThemTis calculated from the
ETmissand the lepton not forming the best
Zcandidate.
Selection SR1a SR1b SR2
Targeted Intermediate Decay
l˜(∗)orZ∗ on-shellZ
N leptons (e,µ) Exactly 3
Lepton charge, flavour At least one SFOS pair withmℓℓ>20 GeV
ETmiss >75 GeV
mSFOS Z-veto Z-veto Zrequest
Nb-jets 0 0 any
mT any >90 GeV >90 GeV
pT ℓ3 >10 GeV >30 GeV >10 GeV
from
WZ. The SR1a/b regions target neutralino decays via intermediate sleptons or via off-shellZ-bosonswhile SR2 targets decays via an on-shell
Z-boson. Table 1 summarizes the selection requirements for thethree signal regions.
7 Standard Model Background Estimation
7.1 Reducible Background Processes
Several SM processes contribute to the background in the signal regions. A “reducible” process has at least one “fake” object, that is either a lepton from a semileptonic decay of a heavy-flavor quark or an electron from an isolated photon conversion. The contribution from misidentified light-flavor quark or gluon jets is negligible in the signal regions. The reducible background includes single- and pair- production of top-quark and
WWor
W/Zproduced in association with jets or photons. The dominant component is the production of top quarks, with a contribution of 1% or less from
Z+jets. The reduciblebackground is estimated using a “matrix method” similar to that described in Ref. [55].
In this implementation of the matrix method, the signal lepton with the highest
pTor
ETis taken to be real, which is a valid assumption in 99% of the cases, based on MC studies. The number of observed events with one or two fakes is then extracted from a system of linear equations relating the number of events with two additional signal or tagged candidates to the number of events with two additional candidates that are either real or fake. The coefficients of the linear equations are functions of the real lepton identification efficiencies and of the fake object misidentification probabilities.
The identification efficiency is measured in data using lepton candidates from
Z → ℓℓdecays.
Misidentification probabilities for each relevant fake type (heavy flavor, conversion) and for each re- ducible background process are obtained using simulated events with one signal and two tagged leptons.
These misidentification probabilities are then corrected using the ratio (fake scale factor) of the misiden-
tification probability in data and that in MC simulation obtained in dedicated control samples. For heavy
flavor fakes, the correction factor is measured in a
bb¯ dominated control sample. This is defined by
selecting events with only one
b-tagged jet (containing a muon) and a tagged lepton, for which the fakerate is measured. The non-b
b¯ background includes top pair production and
Wproduced in association
with a
b-quark. AnETmissrequirement of less than 40 GeV suppresses both the
t¯tand the
Wcontami-
nation, while requesting
mT<40 GeV reduces the
Wbackground. The remaining (small) background is
subtracted from data using MC predictions. The fake scale factor for the conversion candidates is deter-
mined in a sample of photons radiated from a muon in
Z→µµdecays. These are selected by requesting
Mµµeto lie within 10 GeV of the nominal
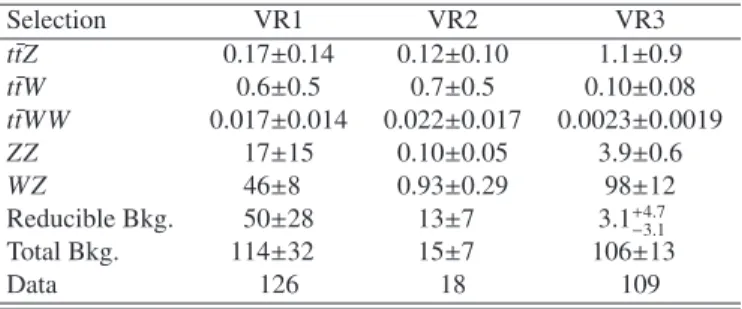
Z-boson mass value. A weighted average misidentificationTable 2: Expected numbers of events from SM backgrounds (Bkg.) and observed numbers of events in data, for 4.7 fb
−1, in validation regions VR1, VR2 and VR3. Both statistical and systematic uncertainties are included.
Selection VR1 VR2 VR3
t¯tZ 0.17±0.14 0.12±0.10 1.1±0.9 ttW¯ 0.6±0.5 0.7±0.5 0.10±0.08 t¯tWW 0.017±0.014 0.022±0.017 0.0023±0.0019 ZZ 17±15 0.10±0.05 3.9±0.6
WZ 46±8 0.93±0.29 98±12
Reducible Bkg. 50±28 13±7 3.1+4.7
−3.1
Total Bkg. 114±32 15±7 106±13
Data 126 18 109
probability is then calculated by weighting the corrected type- and process-dependent misidentification probabilities according to the relative contributions in a given region.
7.2 Irreducible Background Processes
A background process is considered “irreducible” if it leads to events with three real and isolated leptons, referred to as “real” leptons below. These include diboson (WZ and
ZZ) andttW/Z¯ production, where the gauge boson may be produced off-mass-shell. The
ZZand
ttW/Z¯ contribution is determined using the corresponding MC samples, for which lepton and jet selection efficiencies are corrected to account for differences with respect to data.
The largest irreducible background,
WZ, is determined using a semi-data-driven approach. TheWZbackground is fit to data in a control region including events with exactly three leptons, one SFOS lepton pair, a
Zcandidate,
EmissT <50 GeV, a
b-veto, andmT(W)
>40 GeV. The
WZpurity after all above cuts in the control region is
∼80%. Non-WZ backgrounds, both irreducible and reducible, are determined based on MC or by using the matrix method and subtracted. A
WZnormalization factor 1.25
±0.12 is obtained in the control region under a background-only hypothesis and used to estimate the
WZin the validation regions. To obtain the model-independent 95% CL upper limit on the new physics cross- section, a fit is performed simultaneously in the
WZcontrol region and in the signal region, with floating
WZnormalization factor and a non-negative new physics signal in the signal region only. This allows the propagation of the uncertainties on the normalization factor. When setting limits on specific new physics scenarios, the potential signal contamination in the
WZcontrol region is accounted for in the simultaneous fit.
8 Background Model Validation
The background predictions have been tested in various validation regions. A Drell-Yan and
WZdomi- nated region (VR1) includes events with three signal leptons, at least one SFOS lepton pair, 30<
ETmiss<75 GeV, and satisfying a
Z-boson veto. A reducible background dominated region (VR2, where toppair-production and decay to two real and one fake lepton is the main contribution) is built by requiring
three signal leptons,
EmissT >50 GeV and by veto-ing SFOS lepton pairs. Finally, a
WZdominated region
(VR3) is defined by selecting events with three signal leptons, at least one a SFOS lepton pair, a
Zcan-
didate, and 50<
ETmiss<75 GeV. The data and predictions are in agreement within the quoted statistical
and systematic uncertainties as shown in Table 2 and distributions are presented in Appendix A.
9 Systematic uncertainties
Several sources of systematic uncertainty are considered in the signal, control and validation regions.
The systematic uncertainties affecting the MC based estimates (the yield of the irreducible background, the cross-section weighted misidentification probabilities, the signal yield) include the theoretical cross section uncertainties due to renormalisation and factorisation scale and PDFs, the acceptance uncertainty due to PDFs, the uncertainty due to the choice of MC generator, jet energy scale, jet energy resolution, lepton energy scale, lepton energy resolution, lepton efficiency,
b-tagging efficiency and mistag proba-bility, and the uncertainty on the luminosity. In SR1a, the total uncertainty on the irreducible background is 24%. This is dominated by the uncertainty on the efficiency of the signal regions’ selection for the
WZgenerator, determined by comparing the nominal yield with that obtained with the
HERWIGgenerator and found to be 20%. The next largest uncertainties are the uncertainty on the cross sections (9%) and that due the MC generator uncertainty (1%) of the non-WZ background. The MC generator uncertainty partially accounts for the cross section uncertainty, leading to a slight overestimate of the overall uncer- tainty. All the remaining uncertainties on the irreducible background in this signal region range between 0.5–5%. The total uncertainty on the irreducible background in SR1b is slightly larger, at 25%, due to the limited number of simulated events. In SR2, the uncertainties on the irreducible background are 24%, with increased contributions from the jet energy scale and resolution and cross-section uncertainties.
The uncertainty on the reducible background includes the MC uncertainty on the weights for the misidentification probabilities from the sources listed above (up to 10%) and the uncertainty due to the dependence of the misidentification probability on
EmissT(0.6–15%). Also included in the uncertainty on the reducible background is the uncertainty on the fake scale factors (10–34%), and that due to the limited number of data events with three tagged leptons, of which at least one is a signal lepton (19–130%). The latter uncertainty is highest in SR2 where the reducible background is very low.
The total uncertainties on the signal yields are between 10–20%, where the largest contribution is from the uncertainty on the cross-sections at
∼7%. Signal cross sections are calculated to NLO in the strong coupling constant using
PROSPINO. An envelope of cross section predictions is defined using the68% C.L. ranges of the
CTEQ6.6[56] (including the
αSuncertainty) and
MSTW[57] PDF sets, together with variations of the factorisation and renormalisation scales by factors of two or one half. The nominal cross section value is taken to be the midpoint of the envelope and the uncertainty assigned is half the full width of the envelope, closely following the PDF4LHC recommendations [58].
In all of the above, the value used for the uncertainty on the luminosity is 3.9% [59, 60]. Correlations of systematic uncertainties between processes and regions are accounted for.
10 Results and Interpretation
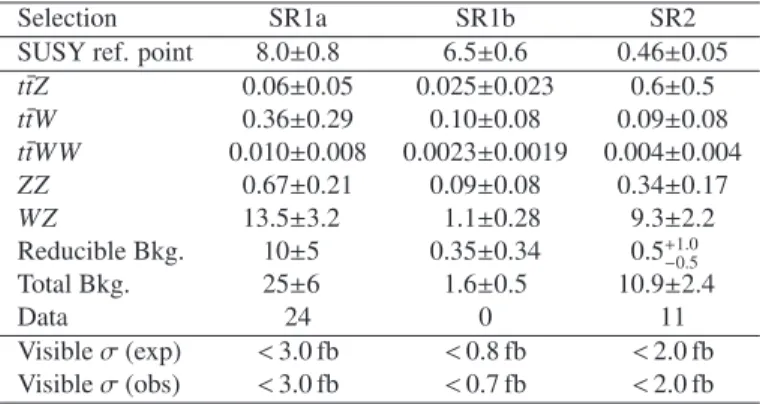
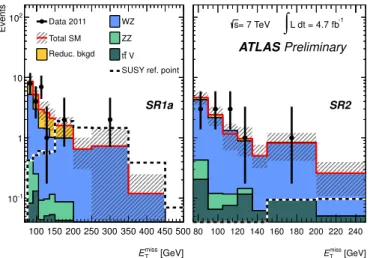
The numbers of observed events and the prediction for SM backgrounds in SR1a, SR1b and SR2 are reported in Table 3. Distributions of the
EmissTin SR1a and SR2 are presented in Fig. 1. Additional distributions are shown in Appendix A.
No significant excess of events is found in any of the three signal regions. Upper limits on the visible cross section, defined by the product of production cross section times acceptance times efficiency, of 3.0 fb in SR1a, 0.7 fb in SR1b and 2.0 fb in SR2 are placed at 95% CL with the modified frequentist CL
sprescription [61]. All systematic uncertainties and their correlations are taken into account via nuisance parameters in a profile likelihood fit [62]. The corresponding expected limits are 3.0 fb, 0.8 fb and 2.0 fb, respectively.
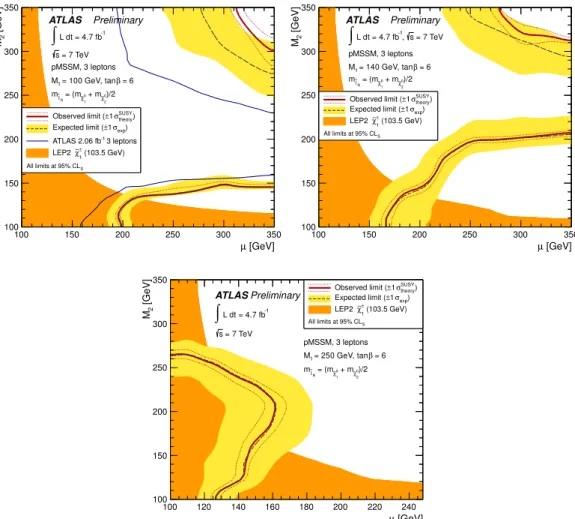
SR1a and SR1b provide the best sensitivity for the pMSSM scenarios, and the interpretations are
shown in Fig. 2. In particular, SR1a (SR1b) target scenarios with small (large) mass splitting between
the heavy gauginos and the LSP. The limits are calculated using - model point by model point - the signal
Table 3: Expected numbers of events from SM backgrounds (Bkg.) and observed numbers of events in data, for 4.7 fb
−1, in signal regions SR1a, SR1b and SR2. The yield for one of the simplified model scenarios, “SUSY ref. point”, (m
χ˜±1,mχ˜0
2,mℓ˜L,mχ˜0
1=
425, 425, 250, 75 GeV) is also presented. Both statistical and systematic uncertainties are included. Upper limits on the observed and expected visible production cross-section at 95% CL are also shown.
Selection SR1a SR1b SR2
SUSY ref. point 8.0±0.8 6.5±0.6 0.46±0.05 t¯tZ 0.06±0.05 0.025±0.023 0.6±0.5 ttW¯ 0.36±0.29 0.10±0.08 0.09±0.08 t¯tWW 0.010±0.008 0.0023±0.0019 0.004±0.004 ZZ 0.67±0.21 0.09±0.08 0.34±0.17 WZ 13.5±3.2 1.1±0.28 9.3±2.2 Reducible Bkg. 10±5 0.35±0.34 0.5+1.0
−0.5
Total Bkg. 25±6 1.6±0.5 10.9±2.4
Data 24 0 11
Visibleσ(exp) <3.0 fb <0.8 fb <2.0 fb Visibleσ(obs) <3.0 fb <0.7 fb <2.0 fb
region providing the best expected limit. The uncertainties on the signal cross-section are not included in the limit calculation but their impact on the observed limit is shown. A large difference between expected and observed limits is seen in the upper right corner of the
M1=100 GeV slice of the pMSSM scenarios in Fig. 2, where SR1b has the best sensitivity. Lower
M1values lead to sizable mass splittings between ˜
χ±1and ˜
χ01and therefore to large acceptances. The production cross-section decreases as
M2and
µincrease, leading to a less stringent limit for high values of the two parameters. The search does not have sensitivity in the region at low
M2and high
µdue to the small mass splitting between the ˜
χ02and the ˜
χ01. The value of tan
βdoes not have a significant impact on
σ(pp →χ˜
±i χ˜
0j)
×BR( ˜χ±iχ˜
0j → ℓℓℓχ˜
01), which varies by
∼10% if tan
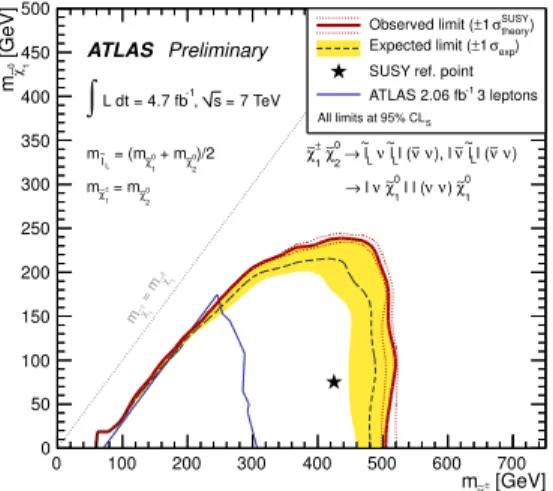
βis raised from 6 to 10. SR1b provides the best sensitivity to the simplified models for which the interpretation is shown in Fig. 3. In the simplified models considered, degenerate
˜
χ±1
and ˜
χ02masses up to 500 GeV are excluded for large mass differences from the ˜
χ01.
Results in SR1a are also interpreted in the mUED model, where small mass differences are expected, and results in SR2 are interpreted in a
Z-rich GGM scenario (Appendix A).11 Summary
Results from a search for direct production of charginos and neutralinos in the final state with three leptons (electrons or muons) and missing transverse momentum are reported. The analysis is based on 4.7 fb
−1of proton-proton collision data delivered by the LHC at
√s=7 TeV. No significant excess of
events is found in data. The null result is interpreted in pMSSM and simplified models. For the simplified
models considered in this paper, degenerate ˜
χ±1and ˜
χ02masses up to 500 GeV are excluded for large mass
differences from the ˜
χ01. Additional interpretations in mUED and GGM models are also provided.
[GeV]
miss
ET
100 150 200 250 300 350 400 450 500
Events
10-1
1 10
102 Data 2011 Total SM Reduc. bkgd
WZ ZZ
V t t
SUSY ref. point
SR1a
[GeV]
miss
ET
80 100 120 140 160 180 200 220 240
SR2
= 7 TeV
s
∫
L dt = 4.7 fb-1ATLASPreliminary
Figure 1:
EmissTdistributions for events in signal regions SR1a (left) and SR2 (right). The uncer- tainty band includes both statistical and systematic uncertainty, while the uncertainties on the data points are statistical only. The yield for one of the simplified model scenarios, “SUSY ref. point”, (m
χ˜±1,mχ˜0
2,mℓ˜L,mχ˜0
1=
425, 425, 250, 75 GeV) is also shown for illustration purposes. For this SUSY ref.
point, 8.0
±0.8 events are expected in SR1a, 6.5
±0.6 in SR1b and 0.46
±0.05 in SR2. The expected yield
for the SUSY ref. point is small in SR2 as this scenario is not rich in on-shell
Zbosons.
[GeV]
µ
100 150 200 250 300 350
[GeV]2M
100 150 200 250 300 350
ATLAS Preliminary L dt = 4.7 fb-1
∫
= 7 TeV s
β = 6 = 100 GeV, tan M1
pMSSM, 3 leptons
)/2
0 χ2
+ m∼ 0 χ1
m∼ = ( l R
m~
theory) σSUSY
±1 Observed limit (
exp) σ
±1 Expected limit (
3 leptons ATLAS 2.06 fb-1
(103.5 GeV)
±
χ∼1
LEP2 All limits at 95% CLS
[GeV]
µ
100 150 200 250 300 350
[GeV]2M
100 150 200 250 300 350
ATLAS Preliminary = 7 TeV s -1, L dt = 4.7 fb
∫
β = 6 = 140 GeV, tan M1
pMSSM, 3 leptons
)/2
0 χ2
+ m∼ 0 χ1
m∼ = ( l R
m~
theory) σSUSY
±1 Observed limit (
exp) σ
±1 Expected limit (
(103.5 GeV)
±
χ∼1
LEP2 All limits at 95% CLS
[GeV]
µ
100 120 140 160 180 200 220 240
[GeV]2M
100 150 200 250 300 350
ATLASPreliminary L dt = 4.7 fb-1
∫
= 7 TeV s
β = 6 = 250 GeV, tan M1
pMSSM, 3 leptons
)/2
0 2 χ∼ + m
0 1 χ∼ m = ( l R
m~
theory) σSUSY
±1 Observed limit (
exp) σ
±1 Expected limit (
(103.5 GeV)
±
χ∼1
LEP2 All limits at 95% CLS
Figure 2: Observed and expected 95% CL limit contours for chargino and neutralino production in the
pMSSM for
M1=100 GeV (top left),
M1=140 GeV (top right) and
M1=250 GeV (bottom). The regions
with low values of
M2and
µare the excluded ones for all values of
M1=100 GeV. The expected and
observed limits are calculated without signal cross-section uncertainty taken into account. The yellow
band is the
±1σ experimental uncertainty on the expected limit. The red dashed band is the
±1σ signal
theory uncertainty on the observed limit. Linear interpolation is used to account for the discreteness
of the signal grids. The exclusion contours are optimized by applying in each signal grid point the CL
values from the most sensitive signal region (lowest expected CL) for
M1=100 GeV and 140 GeV. Signal
region SR1a is used for
M1=250 GeV.
[GeV]
1 χ±
m∼
0 100 200 300 400 500 600 700
[GeV] 10χ∼m
0 50 100 150 200 250 300 350 400 450 500
1 0χ
∼
= m
1
±χ
m∼
ATLAS Preliminary = 7 TeV s -1, L dt = 4.7 fb
∫
ν) ν∼
Ll (
~l ν∼
), l ν ν∼
Ll (
~l Lν
~l 0→ χ∼2
± χ∼1
0 χ∼1 ν) ν l l ( 0 χ∼1 ν
→ l
0 2
∼χ = m
± χ1
m∼
)/2
0 χ2
+ m∼ 0 χ1
m∼ = ( l L
m~
theory) σSUSY
±1 Observed limit (
exp) σ
±1 Expected limit ( SUSY ref. point
3 leptons ATLAS 2.06 fb-1 All limits at 95% CLS
Figure 3: Observed and expected 95% CL limit contours for chargino and neutralino production in the
simplified model scenario. The expected and observed limits are calculated without taking the signal
cross-section uncertainty into account. The yellow band is the
±1σ experimental uncertainty on the
expected limit. The red dashed band is the
±1σ signal theory uncertainty on the observed limit. Linear
interpolation is used to account for the discreteness of the signal grids.
A Appendix: Additional Material
) [GeV]
γ1
(≈ R-1
300 400 500 600 700 800
RΛ
5 10 15 20 25 30 35 40
ATLAS Preliminary = 7 TeV s -1, L dt = 4.7 fb
∫
mUED, 3 leptons
theory) σmUED
±1 Observed limit (
exp) σ
±1 Expected limit ( All limits at 95% CLS
Figure 4: Observed and expected 95% CL limit contours for the minimal universal extra dimensions (mUED) model [26]. In the mUED model, one extra dimension is introduced that is compactified on a
S1/Z2orbifold with a characteristic lenght scale R and it is an effective theory valid up to a cutoff scale,
Λ. The SM fields are allowed to propagate in the extra spatial dimension resulting in a Kaluza-Klein(KK) tower of excited SM particles. Conservation of momentum in the extra dimension gives rise to a conserved KK-number and leads to a phenomenology analogous to R-parity conserving SUSY: KK- particles are pair-produced and the lightest KK particle (typically the photon
γ∗) is stable and neutral. The production of KK-particles is dominated by pair production of KK-quarks and KK-gluons that decay via excited KK-Ws and KK-Zs to multilepton final states with
γ∗producing significant missing transverse momentum. The mUED signal samples are produced with, and normalized to the prediction from, the LO HERWIG++ generator. SR1a provides the best sensitivity to the mUED model, which tends to have soft leptons. The expected and observed limits are calculated without taking the signal cross-section uncertainty into account. The yellow band is the
±1σ experimental uncertainty on the expected limit.
The red dashed band is the
±1σ signal theory uncertainty on the observed limit. Linear interpolation is
used to account for the discreteness of the signal grids. The results from this search exclude 1/R values
below 775 GeV for large values of
ΛR, significantly extending current limits [63].[GeV]
H~
m 100 200 300 400 500 600 700 800 900 1000 [GeV]g~m
300 400 500 600 700 800 900 1000
= NLSP
~g
ATLASPreliminary
=7 TeV s
-1, L dt = 4.7 fb
∫
NLSP H~
β=1.5 tan
=1 TeV
=m2
m1
=0.1mm τNLSP
c
theory) σSUSY
±1 Observed limit (
exp) σ
±1 Expected limit (
All limits at 95% CLS
[GeV]
W~
m 100 200 300 400 500 600 700 800 900 1000 [GeV]g~m
300 400 500 600 700 800 900 1000
= NLSP
~g
ATLASPreliminary
=7 TeV s
-1, L dt = 4.7 fb
∫
co-NLSP W~
β=2 tan
=1.5 TeV
=µ m1
=0.1mm τNLSP
c
theory) σSUSY
±1 Observed limit (
exp) σ
±1 Expected limit (
All limits at 95% CLS
Figure 5: Observed and expected 95% CL limit contours for general gauge mediated SUSY models (GGM) [27, 28] with higgsino next-to-lightest SUSY particle (NLSP) (left) and wino co-NLSP (right).
The GGM lightest SUSY particle is always a light gravitino ( ˜
G). In GGM higgsino scenarios with a masshierarchy
µ≪m1,2, the NLSP is the ˜
Hdecaying via
γG˜ or
ZG. The parameters are set to˜
m1=m2=1 TeV,
tan
β=1.5, and
cτNLS P=0.1 mm. The
µterm is required to be positive, but is within the bounds required
for a ˜
HNLSP. In the GGM wino scenarios with
m2 ≪µ,m1, the wino-like ˜
χ±1and ˜
χ01are degenerate in
mass and act as co-NLSP. The co-NLSPs then decay into
γG,˜
ZG, and˜
W±G. The chosen parameters˜
are
m1=µ=1.5 TeV, tan
β=2 and
cτNLS P=0.1 mm. The mass
m2is varied as required to produce the
wino co-NLSP. The GGM signal samples are produced with
PYTHIAand the sample yields normalized to
the NLO+NLL cross sections and using the midpoint of the
CTEQ6.6and
MSTW2008PDF sets (see text
for details). SR2 provides the best sensitivity in the
Z-rich GGM models. The expected and observedlimits are calculated without taking the signal cross-section uncertainty into account. The yellow band is
the
±1σ experimental uncertainty on the expected limit. The red dashed band is the
±1σ signal theory
uncertainty on the observed limit. Linear interpolation is used to account for the discreteness of the signal
grids. In GGM higgsino NLSP models, gluinos are excluded with mass up to 600 GeV for low higgsino
masses, strengthening current limits [64]. In GGM wino co-NLSP models, gluinos are excluded with
mass up to 520 GeV for wino masses less than 480 GeV.
) leading lepton [GeV]
µ
pT e( ET
0 50 100 150 200 250 300 350 400 450 500
Events
10-1
1 10 102
Data 2011 Total SM Reduc. bkgd WZ ZZ
V t t
SUSY ref. point
= 7 TeV
s
∫
L dt = 4.7 fb-1 ATLAS Preliminaryleading lepton [GeV]
) 2nd µ
pT e( ET
0 20 40 60 80 100 120 140 160 180 200
Events
10-1
1 10 102
Data 2011 Total SM Reduc. bkgd WZ ZZ
V t t
SUSY ref. point
= 7 TeV
s
∫
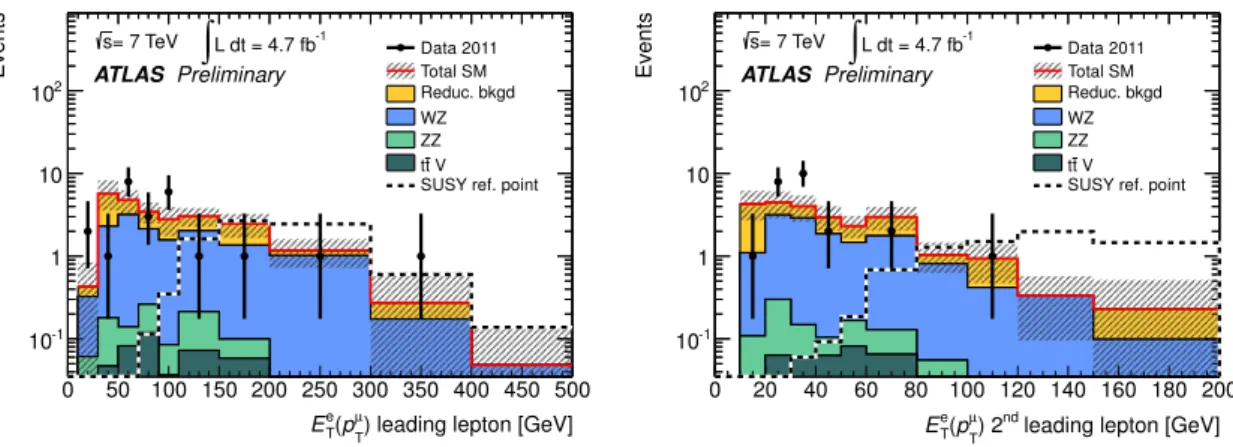
L dt = 4.7 fb-1 ATLAS PreliminaryFigure 6: For events in SR1a, the
pTdistributions of the leading (left) and sub-leading (right) lepton are shown for 2011 data and MC simulation. The grey hatched band represents statistical and systematic uncertainties added in quadrature. The yield for one of the simplified model scenarios, “SUSY ref.
point”, (m
χ˜± 1,mχ˜02,mℓ˜L,mχ˜0
1=
425, 425, 250, 75 GeV) is also shown for illustration purposes. For this SUSY ref. point, 8.0
±0.8 events are expected in SR1a, 6.5
±0.6 in SR1b and 0.46
±0.05 in SR2. The expected yield for the SUSY ref. point is small in SR2 as this scenario is not rich in on-shell
Zbosons.
leading lepton [GeV]
) 3rd µ
pT e( ET
0 20 40 60 80 100 120 140
Events
10-1
1 10 102
Data 2011 Total SM Reduc. bkgd WZ ZZ
V t t
SUSY ref. point
= 7 TeV
s
∫
L dt = 4.7 fb-1 ATLAS Preliminary[GeV]
miss
ET
100 150 200 250 300 350 400 450 500
Events
10-1
1 10 102
Data 2011 Total SM Reduc. bkgd WZ ZZ
V t t
SUSY ref. point
= 7 TeV
s
∫
L dt = 4.7 fb-1 ATLAS PreliminaryFigure 7: For events in SR1a, the
pTdistribution of the third-leading lepton (left) and
EmissTdistribution (right) are shown for 2011 data and MC simulation. The grey hatched band represents statistical and systematic uncertainties added in quadrature. The yield for one of the simplified model scenarios, “SUSY ref. point”, (m
χ˜±1,mχ˜0
2,mℓ˜L,mχ˜0
1=
425, 425, 250, 75 GeV) is also shown for illustration purposes. For this
SUSY ref. point, 8.0
±0.8 events are expected in SR1a, 6.5
±0.6 in SR1b and 0.46
±0.05 in SR2. The
expected yield for the SUSY ref. point is small in SR2 as this scenario is not rich in on-shell
Zbosons.
[GeV]
MSFOS
0 50 100 150 200 250
Events
10-1
1 10 102
Data 2011 Total SM Reduc. bkgd WZ ZZ
V t t
SUSY ref. point
= 7 TeV
s
∫
L dt = 4.7 fb-1 ATLAS PreliminaryNumber of jets
0 2 4 6 8 10
Events
10-1
1 10
102 Data 2011
Total SM Reduc. bkgd WZ ZZ
V t t
SUSY ref. point
= 7 TeV
s
∫
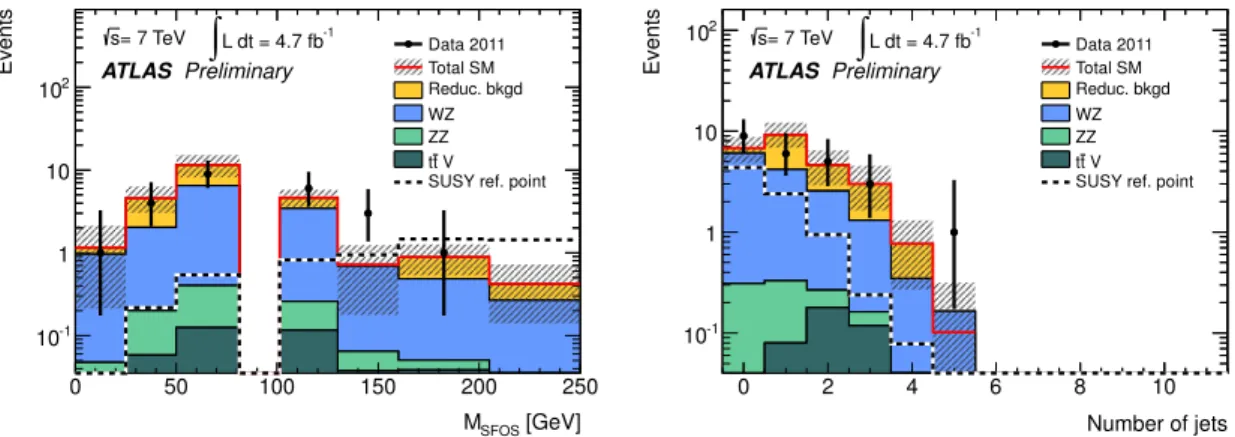
L dt = 4.7 fb-1 ATLAS PreliminaryFigure 8: For events in SR1a, the
mSFOS(left) and jet multiplicity (right) distributions are shown for 2011 data and MC simulation. In events where multiple SFOS lepton pairs are present, the pair with invariant mass closest to the
Zboson mass is plotted. The grey hatched band represents statistical and systematic uncertainties added in quadrature. The yield for one of the simplified model scenarios, “SUSY ref. point”, (m
χ˜±1,mχ˜0
2,mℓ˜L,mχ˜0
1=
425, 425, 250, 75 GeV) is also shown for illustration purposes. For this SUSY ref. point, 8.0
±0.8 events are expected in SR1a, 6.5
±0.6 in SR1b and 0.46
±0.05 in SR2. The expected yield for the SUSY ref. point is small in SR2 as this scenario is not rich in on-shell
Zbosons.
[GeV]
MT
0 50 100 150 200 250 300 350 400 450 500
Events
10-1
1 10
102 Data 2011
Total SM Reduc. bkgd WZ ZZ
V t t
SUSY ref. point
= 7 TeV
s
∫
L dt = 4.7 fb-1 ATLAS PreliminaryFigure 9: For events in SR1a, the
mTdistribution is shown for 2011 data and MC simulation. The
mTis formed using the
EmissTand the lepton not forming the best
Zcandidate. The grey hatched band represents statistical and systematic uncertainties added in quadrature. The yield for one of the simplified model scenarios, “SUSY ref. point”, (m
χ˜±1,mχ˜0
2,mℓ˜L,mχ˜0
1=
425, 425, 250, 75 GeV) is also shown for illustration
purposes. For this SUSY ref. point, 8.0
±0.8 events are expected in SR1a, 6.5
±0.6 in SR1b and 0.46
±0.05
in SR2. The expected yield for the SUSY ref. point is small in SR2 as this scenario is not rich in on-shell
Zbosons.
) leading lepton [GeV]
µ
pT e( ET
0 50 100 150 200 250 300 350 400 450 500
Events
10-1
1 10 102
Data 2011 Total SM Reduc. bkgd WZ ZZ
V t t
SUSY ref. point
= 7 TeV
s
∫
L dt = 4.7 fb-1 ATLAS Preliminaryleading lepton [GeV]
) 2nd µ
pT e( ET
0 20 40 60 80 100 120 140 160 180 200
Events
10-1
1 10
102 Data 2011
Total SM Reduc. bkgd WZ ZZ
V t t
SUSY ref. point
= 7 TeV
s
∫
L dt = 4.7 fb-1 ATLAS PreliminaryFigure 10: For events in SR2, the
pTdistributions of the leading (left) and sub-leading (right) leptons are shown for 2011 data and MC simulation. The grey hatched band represents statistical and systematic uncertainties added in quadrature. The yield for one of the simplified model scenarios, “SUSY ref.
point”, (m
χ˜± 1,mχ˜02,mℓ˜L,mχ˜0
1=
425, 425, 250, 75 GeV) is also shown for illustration purposes. For this SUSY ref. point, 8.0
±0.8 events are expected in SR1a, 6.5
±0.6 in SR1b and 0.46
±0.05 in SR2. The expected yield for the SUSY ref. point is small in SR2 as this scenario is not rich in on-shell
Zbosons.
leading lepton [GeV]
) 3rd µ
pT e( ET
0 20 40 60 80 100 120 140
Events
10-1
1 10 102
Data 2011 Total SM Reduc. bkgd WZ ZZ
V t t
SUSY ref. point
= 7 TeV
s
∫
L dt = 4.7 fb-1 ATLAS Preliminary[GeV]
miss
ET
100 150 200 250 300 350 400 450 500
Events / 10 GeV
10-1
1 10
Data 2011 Total SM Reduc. bkgd WZ ZZ
V t t
SUSY ref. point
= 7 TeV
s
∫
L dt = 4.7 fb-1 ATLAS PreliminaryFigure 11: For events in SR2, the
pTdistribution of the third-leading lepton (left) and the
ETmissdistri- bution (right) are shown for 2011 data and MC simulation. The grey hatched band represents statistical and systematic uncertainties added in quadrature. The yield for one of the simplified model scenarios,
“SUSY ref. point”, (m
χ˜± 1,mχ˜02,mℓ˜L,mχ˜0
1=
425, 425, 250, 75 GeV) is also shown for illustration purposes.
For this SUSY ref. point, 8.0
±0.8 events are expected in SR1a, 6.5
±0.6 in SR1b and 0.46
±0.05 in SR2.
The expected yield for the SUSY ref. point is small in SR2 as this scenario is not rich in on-shell
Zbosons.
Number of jets
0 2 4 6 8 10
Events
10-1
1 10 102
Data 2011 Total SM Reduc. bkgd WZ ZZ
V t t
SUSY ref. point
= 7 TeV
s
∫
L dt = 4.7 fb-1 ATLAS Preliminary[GeV]
MT
0 50 100 150 200 250 300 350 400 450 500
Events
10-1
1 10 102
Data 2011 Total SM Reduc. bkgd WZ ZZ
V t t
SUSY ref. point
= 7 TeV
s
∫
L dt = 4.7 fb-1 ATLAS PreliminaryFigure 12: For events in SR2, the jet multiplicity (left)
mT(right) distributions are shown for 2011 data and MC simulation. The
mTis formed using the
EmissTand the lepton not forming the best
Zcandidate. The grey hatched band represents statistical and systematic uncertainties added in quadrature.
The yield for one of the simplified model scenarios, “SUSY ref. point”, (m
χ˜± 1,mχ˜02,mℓ˜L,mχ˜0
1=
![Figure 4: Observed and expected 95% CL limit contours for the minimal universal extra dimensions (mUED) model [26]](https://thumb-eu.123doks.com/thumbv2/1library_info/4027185.1542186/12.892.311.578.175.431/figure-observed-expected-limit-contours-minimal-universal-dimensions.webp)
![Figure 5: Observed and expected 95% CL limit contours for general gauge mediated SUSY models (GGM) [27, 28] with higgsino next-to-lightest SUSY particle (NLSP) (left) and wino co-NLSP (right).](https://thumb-eu.123doks.com/thumbv2/1library_info/4027185.1542186/13.892.442.716.296.552/figure-observed-expected-contours-mediated-higgsino-lightest-particle.webp)