ATLAS-CONF-2012-027 10March2012
ATLAS NOTE
ATLAS-CONF-2012-027
March 5, 2012
Measurement of the ZZ Production Cross Section in the `
+`
−ν¯ ν channel in Proton-Proton Collisions at √
s = 7 TeV with the ATLAS Detector
The ATLAS Collaboration
Abstract
A measurement of the
ZZproduction cross section in proton-proton collisions at
√ s =7 TeV using data collected by the ATLAS experiment at the Large Hadron Collider is pre-
sented. In a data sample corresponding to an integrated luminosity of 4.7 fb
−1, 78 can-
didate events are observed in the channel with one
Zboson decaying to a pair of elec-
trons or muons and the second one decaying to a pair of neutrinos. After subtracting
the expected background contribution, the signal amounts to 37.3
±4.3(stat.)
±3.7(syst.)
events. The total cross section for on-shell
ZZproduction has been determined to be
σtotZZ =5.4
+−1.21.3(stat.)
+−1.01.4(syst.)
±0.2(lumi.) pb and is in agreement with the Standard Model expec-
tation of 6.5
+0.3−0.2pb calculated at the next-to-leading order in QCD.
1 Introduction
The production of pairs of Z bosons at the Large Hadron Collider (LHC) is of great interest since it provides an excellent opportunity to test the predictions of the electroweak sector of the Standard Model at the TeV energy scale, and it is the irreducible background to the search for the Higgs boson in the H
→ZZ decay channel. In the Standard Model, ZZ production
1proceeds via quark-antiquark t-channel annihilation, with a small (
∼6%) contribution from gluon fusion [1]. Figure 1 shows the leading-order Feynman diagrams for ZZ production from q q ¯ initial states. The ZZZ and ZZγ neutral triple gauge boson couplings (nTGCs) are zero in the Standard Model, hence there is no contribution from s-channel q q ¯ annihilation at tree level.
Figure 1: Tree-level Feynman diagrams for ZZ production through the q q ¯ initial state in hadron colliders.
The s-channel diagram, on the right, contains the ZZZ (ZZγ) neutral triple gauge boson coupling vertex, which is zero in the Standard Model.
ZZ production has been studied in e
+e
−collisions at LEP [2, 3, 4, 5, 6] and in pp collisions at the Tevatron [7, 8, 9, 10]. No deviation of the measured cross section from the Standard Model expectation has been observed, and limits on anomalous nTGCs have been set [6, 7]. Recently, ATLAS has published the first measurement of the ZZ cross section in the `
+`
−`
+`
−channel at the LHC, and improved limits on nTGCs [11].
A measurement of ZZ production in proton-proton collisions at a centre-of-mass energy
√s
=7 TeVis presented in this note. The measurement uses a data sample corresponding to an integrated lumi- nosity of 4.7 fb
−1collected by the ATLAS detector at the LHC in 2011. The cross section for on-shell ZZ production is predicted at next-to-leading order in QCD (NLO) to be 6.5
+−0.20.3pb using the MCFM gen- erator [1] with the MSTW2008 NLO parton density function (PDF) set [12]. Candidate ZZ events are reconstructed in the ZZ
→`
+`
−ν¯ ν decay channel, where ` can be an electron or muon and the neutrinos are observed as missing transverse momentum. The branching fraction for this channel is approximately a factor of six higher than for the channel with both Z bosons decaying to electrons or muons. How- ever, the background is much larger. The main background arises from Z
+jets production, top-quarkproduction (t¯ t and single top) where the t
→W
±b decay is followed by a leptonic W
±boson decay and a semi-leptonic b-quark decay, and from other diboson final states. Production of W
±Z events where both bosons decay leptonically but the charged lepton from the W
±boson decay is not observed in the detector, and W
+W
− →`
+ν`
−ν ¯ events with a pair of same-flavour leptons with an invariant mass near the Z boson mass, also form a significant background.
To reduce systematic uncertainties arising from theoretical uncertainties in the modelling of ZZ pro- duction and decay processes, the cross section within a phase-space that corresponds closely to the experimental selection cuts is measured. This measurement is called the fiducial cross section, and the phase-space is defined in Section 5. The total ZZ cross section in the on-shell approximation is obtained
1Throughout this paperZshould be taken to meanZ/γ∗except for decays to neutrinos.
from the fiducial cross section using the known Z
→`
+`
−and Z
→ν¯ ν branching ratios [13] and a cor- rection factor for the kinematic and geometrical acceptance, calculated using the NLO Standard Model prediction from MC@NLO [14].
This note is organised as follows. Section 2 briefly describes the ATLAS detector, the data sample used in this analysis and the Monte Carlo simulation used to estimate the signal and background expec- tations, as well as the acceptance and efficiency of the selection cuts. The event selection and signal efficiency are discussed in Section 3 and the background estimation in Section 4. The results on the cross section are presented in Section 5 and conclusions are given in Section 6.
2 Detector, Data and Monte Carlo Simulation
The ATLAS detector [15] consists of an inner tracking detector surrounded by a superconducting solenoid which provides a 2 T magnetic field, electromagnetic and hadronic calorimeters and a muon spectrome- ter with a toroidal magnetic field. The inner detector provides precision tracking of charged particles for
|η|
< 2.5. It consists of a silicon pixel detector, a silicon strip detector and a straw tube tracker that also provides transition radiation measurements for electron identification. The calorimeter system covers the pseudorapidity range
|η|< 4.9. It is composed of sampling calorimeters with either liquid argon (LAr) or scintillating tiles as the active media. In the range
|η|< 2.5, the electromagnetic LAr calorimeter is finely segmented and plays an important role in electron identification. The muon spectrometer has separate trigger and high-precision tracking chambers which provide muon identification for
|η|< 2.7.
Throughout this paper, η is the pseudorapidity
2, p
Tis the transverse momentum and the superscript Z indicates the Z boson decaying to charged leptons.
A three-level trigger system selects events to be recorded for offline analysis. The events in this analysis were selected with single-lepton triggers with transverse momentum thresholds of 20 or 22 GeV for electrons and 18 GeV for muons.
This measurement uses a data sample of proton-proton collisions at
√s
=7 TeV recorded between April and October 2011. After data quality requirements, the total integrated luminosity used in the analysis is 4.7 fb
−1. The luminosity uncertainty is 3.9% [16].
The signal acceptance is determined from a detailed Monte Carlo simulation. The NLO generator MC@NLO [14] with the CT10 PDF set [17] is used to model pp
→ZZ
→`
+`
−ν¯ ν events, where ` includes electrons, muons and tau leptons. In this generator, the ZZ bosons are treated as on-shell, with a zero width. Production from gluon-gluon initial states is not included. When calculating the expected number of signal events, the predictions of MC@NLO are scaled up by 6.3% to account for the gluon- gluon contribution [1]. MC@NLO is interfaced to H
erwig[18] to simulate the parton shower and to Jimmy [19] to model the underlying event.
Some background contributions are estimated from the data and are cross-checked with predic- tions from Monte Carlo simulations, while others are estimated directly from simulation. MC@NLO is used to model W
+W
−, t¯ t and single top-quark production, and MadGraph [20]/Pythia [21] and Alp-
gen/J
immy[22] are used for the W
±/Z
+γ final state. W
±Z events are modelled using H
erwig[18]. W
±or Z gauge bosons produced in association with jets are modelled with A
lpgen. Multijet events containing heavy flavour hadrons are modelled with PythiaB [23].
The detector response was simulated [24] with a program based on GEANT4 [25]. Additional in- elastic pp events are included in the simulation, distributed so as to reproduce the number of collisions per bunch-crossing in the data.
2ATLAS uses a right-handed coordinate system with its origin at the nominal interaction point in the centre of the detector and thez-axis along the beam direction. Thex-axis points from the interaction point to the centre of the LHC ring, and the y-axis points upwards. Cylindrical coordinates (r,φ) are used in the transverse plane,φbeing the azimuthal angle around the beam direction. The pseudorapidityηis defined in terms of the polar angleθasη=−ln tan(θ/2).
3 Event Selection
In order to remove non-collision background, events are required to contain at least one vertex formed from at least three associated tracks with p
T> 400 MeV. The vertex with the largest sum of the p
2Tcomputed from the associated tracks is defined as the primary vertex.
Signal events are characterized by a pair of oppositely-charged, high-p
T, isolated electrons or muons and large missing transverse momentum. To ensure that they originate from the primary vertex, lepton candidates are required to have a longitudinal ‘impact parameter’ (distance of closest approach) with respect to the primary vertex less than 1 mm and a transverse impact parameter significance (transverse impact parameter divided by its uncertainty) less than 3 (10) for muons (electrons).
Muons are identified by matching tracks reconstructed in the muon spectrometer to tracks recon- structed in the inner detector. Their momentum is calculated by combining the information from the two subsystems and correcting for the energy lost in the calorimeter. Only muons with p
T> 20 GeV and
|η|< 2.4 are considered. In order to reject muons from the decays of heavy quarks, only isolated muons are selected, by requiring the scalar sum of the transverse momenta (
Σp
T) of other tracks inside a cone of
∆R
=0.3 around the muon to be no more than 15% of the muon p
T. Tracks entering the sum are required to have at least four hits in the silicon detectors and p
T> 1 GeV. In addition, the energy deposited in the calorimeter in a cone of
∆R
=0.3 around the muon, corrected for contributions from additional interactions (pile-up), must be less than 14% of the muon p
T.
Electrons are reconstructed from energy deposits (clusters) in the electromagnetic calorimeter matched to tracks in the inner detector. The ATLAS “medium
++” identification criteria is used [26], which is based on calorimeter shower shape, inner detector track quality, matching between the calorimeter and tracking and the ratio of E/p where E is the energy measured in the calorimeter and p is the momentum measured in the tracker. Electron candidates are required to have a transverse energy (measured in the calorimeter) of at least 20 GeV and a pseudorapidity of
|η|< 2.47. They must be isolated, using similar criteria to those used for muons: the
Σp
Tof other tracks inside a cone of
∆R
=0.3 around the electron track must be less than 13% of the electron p
T, and the energy deposited in the calorimeter in a cone of
∆R
=0.3 around the electron, corrected for contributions from pile-up, must be less than 14% of the electron p
T. Electron candidates within
∆R
=0.1 of any selected muon are rejected, and if two electron candidates are within
∆R
=0.1 of each other the one with the lower p
Tis rejected.
The anti-k
talgorithm [27] with distance parameter R
=0.4 is used to reconstruct jets from clusters of energy in the calorimeter. Jets are required to have p
T> 25 GeV and
|η|< 4.5, and to have more than 75% of the total transverse momentum carried by tracks which are within
∆R
=0.4 of the jet axis and which are associated with the primary vertex, in order to minimise the impact of jets from pile-up at high luminosity. Jets within
∆R
=0.3 of an electron or muon that passes the requirements above are rejected.
The jets are calibrated using p
T- and η-dependent correction factors [28] based on simulation and data, and validated using test beam and collision data.
Missing transverse momentum, E
missT, is calculated using identified electrons with
|η|< 2.47, muons with
|η|< 2.7 and jets and other calorimeter clusters within
|η|< 4.5. The clusters are calibrated as electromagnetic or hadronic according to cluster topology. A small correction avoids double counting the energy deposited in the calorimeters by muons [29].
Selected events are required to have exactly two opposite-sign same-flavour leptons selected as
above, and to have passed a single-muon or single-electron trigger. The invariant mass of the lepton pair
is required to satisfy
|m`+`−−m
Z|< 15 GeV. To select events where one Z boson decays to a neutrino pair
and reject Z
+jets events with small, genuine missing transverse momentum, the axial-EmissTis required to
be greater than 80 GeV. The axial-E
missTis the missing transverse momentum anti-parallel to the direction
in the transverse plane of the reconstructed Z boson, and is defined as E
Tmiss×cos(∆ φ( E
Tmiss~ , ~ p
T``)). Only
events without any reconstructed jet with p
T> 25 GeV in
|η|< 4.5 are retained, which strongly reduces
[GeV]
mll 20 40 60 80 100 120 140 160 180 200
Events / 2GeV
10-1
1 10 102
103
104
105
106
107
108
109 ATLAS Preliminary
∫Ldt = 4.7 fb-1 = 7 TeV s
Data Z+X W+X
γ* γ/W W Top WZ
WW
→llll ZZ→llνν ZZ
(a) Invariant mass after dilepton requirement.
[GeV]
miss
Axial-ET
0 20 40 60 80 100 120 140
Events / 5GeV
10-1
1 10 102
103
104
105
106
107
108
109 ATLAS Preliminary
∫Ldt = 4.7 fb-1 = 7 TeV s
Data Z+X W+X
γ* γ/W W Top WZ
WW
→llll ZZ→llνν ZZ
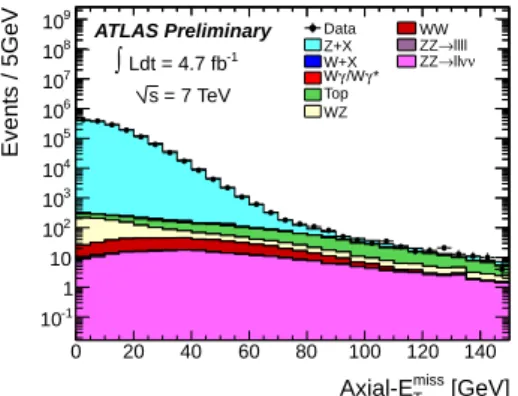
(b) AxialEmissT after the mass window requirement.
NJet
0 1 2 3 4 5 6 7
Events
20 40 60 80 100 120 140 160 180 200 220 240
ATLAS Preliminary
∫Ldt = 4.7 fb-1 = 7 TeV s
Data Z+X W+X
γ* γ/W W Top WZ
WW
→llll ZZ→llνν ZZ
(c) Jet multiplicity after the axial-EmissT cut.
ll
|/pT ll
-pT miss
|ET 0 0.1 0.2 0.3 0.4 0.5 0.6 0.7 0.8 0.9 1
Events / 0.1
10-1
1 10 102
103 ATLAS Preliminary
∫Ldt = 4.7 fb-1 = 7 TeV s
Data Z+X W+X
γ* γ/W W Top WZ
WW
→llll ZZ→llνν ZZ
(d) FractionalpT difference after the jet veto.
Figure 2: Distributions of selection variables after the application of each cut. Data, shown as points, are compared with the Monte Carlo expectations, shown as histograms. The electron channel and muon channel are combined.
the dominant backgrounds from top-quark and Z
+jets production. Finally, the difference between theE
missTand the transverse momentum of the Z boson reconstructed from the lepton pair is required to satisfy
|ETmiss−p
ZT|/pZT< 0.6; this di
fference is termed the ‘fractional p
Tdi
fference’. Figure 2 shows the distributions of each of the kinematic variables discussed above for the combined dilepton sample at the appropriate stage in the application of selection cuts.
For events generated within the fiducial phase-space, the selection e
fficiency of the ZZ candidates is derived from simulation and is corrected with scale factors to account for small differences in efficiencies between data and simulation. The selection e
fficiency includes the e
ffects of the trigger e
fficiency, the lepton identification and reconstruction e
fficiencies and the e
fficiency of the ZZ selection criteria.
The efficiencies of the single-lepton triggers have been determined as a function of lepton p
Tusing large control samples of Z
→`
+`
−events. The trigger e
fficiencies for the two-lepton events passing the o
ffline selections are obtained from simulation and are corrected by scale factors derived from the comparison between data and Monte Carlo of the single-lepton trigger efficiencies. The overall trigger e
fficiency is 99.6
±0.4%.
For lepton reconstruction and identification, the scale factors vary from unity by 0.1%–2% for
muons [30] and 1%–13% for electrons [26] depending on the p
T. The larger discrepancies seen for
electrons a
ffect only the low- p
Tregion, and are due to mis-modelling of lateral shower shapes in simu-
lation. Systematic uncertainties on these scale factors are derived from e
fficiency measurements in the
data. A small smearing is added to the muon p
Tin the simulation [31] so that the Z
→µµ invariant mass
distribution in data is correctly reproduced by the simulation. Similarly, small corrections are applied to the calorimeter energy scale and resolution for electrons.
To reduce the uncertainty arising from the jet veto, a correction factor is derived from single Z-boson data. This correction factor is
Zdata/
ZMC, where
Zdataand
ZMCare the ratios of the number of events with no jet to the number with any number of jets (passing the analysis selection criteria) in data and Monte Carlo, respectively. This correction factor is measured to be 0.953 with uncertainties of 4.4% arising from the difference between the central value calculated with MC@NLO and the value calculated with A
lpgen, and 2.9% from uncertainties in the jet energy scale and resolution.
The expected signal ZZ yields for each channel at different selection steps, normalized to the inte- grated luminosity of 4.7 fb
−1, are listed in Table 1. The overall efficiencies of the reconstruction and se- lection criteria for events generated within the fiducial phase-space are 61.2±0.9±3.7% and 75.8±0.8±3.0%
for eeνν and µµνν, respectively, where the first uncertainty is from Monte Carlo statistics and the second one is systematic in each case. The lower signal expectation in the eeνν channel compared with the µµνν channel reflects the lower electron identification e
fficiency. The dominant systematic uncertainties arise from the jet veto (5.3%) and from the track isolation uncertainty (4.0% in eeνν and 2.1% in µµνν).
Channels eeνν µµνν ``νν
Two leptons 140.5
±1.5 179.6
±1.6 320.1
±2.2
Z mass 138.4
±1.5 167.3
±1.6 305.7
±2.2
Axial E
Tmiss29.4
±0.6 35.4
±0.7 64.8
±0.9
Jet veto 19.8
±0.5 24.0
±0.6 43.8
±0.8
Frac. p
Tdi
ff. 19.3
±0.5
±1.2 23.0
±0.6
±0.9 42.3
±0.8
±1.8
Table 1: Expected numbers of events after each selection step for the ZZ
→`
+`
−ν¯ ν signal, normalized to
L=4.7 fb
−1. The uncertainties shown are from Monte Carlo statistics only, except in the last row where systematic uncertainties are also given.
4 Background Estimation
There are several sources of background to the ZZ
→`
−`
+ν¯ ν events. While the first two of these have a peak in m
``at the Z boson mass, the remaining ones do not:
•
Z
+jets, with mismeasured E
missT. This is the largest background before the axial-E
Tmisscut.
•
W
±Z production in the leptonic decay mode with the charged lepton from the W
±boson decay undetected. W
±Z is the dominant background which is estimated from Monte Carlo.
•
Z
→τ
+τ
−with leptonic τ decays.
•
Top-quark pair production. This is suppressed by the jet veto.
•
W
+W
−production. This background has the same final state as the signal.
•
W
±+jets with a jet misidentified as a lepton or containing a real lepton from heavy flavour hadron decay (‘fake’ lepton), and multi-jet events with two fake leptons
3.
•
W
±γ production with a γ misidentified as an electron. This background is estimated from Monte Carlo.
3From now onW±+jets will refer to both.
Data-driven techniques are used to predict the background contribution from t¯ t, W
±t, W
+W
−, Z
+jetsand W
±+jets, while Monte Carlo is used for W
±Z and W
±γ. After all the cuts, W
±Z is the dominant background, with 9.4
±0.5
±1.5 events expected in the ee channel and 13.3
±0.6
±2.1 events expected in the µµ channel. The W
±Z background is validated using data in a three-lepton control region and a 15%
systematic uncertainty is applied as a result of these comparisons. The W
±γ background only contributes 0.2
±0.1 (0.09
±0.06) events in the ee (µµ) channel.
The background from t¯ t, W
±t, W
+W
−and Z
→ττ processes is estimated from data using events with one electron and one muon selected with
|me±µ∓−m
Z|< 15 GeV. The ratio of µµ : ee : eµ events from these sources is expected to be approximately 1:1:2. The numbers of ee and µµ events is estimated from the observed number of eµ events, after subtracting the small (∼ 3%) contribution expected from other sources, and taking into account of the di
fference in reconstruction and identification e
fficiency between electrons and muons. The total background from these sources is estimated to be 6.5
±1.8
±0.3 (8.2
±2.3
±0.3) events in the ee (µµ) channel. These values are in good agreement with expectations from Monte Carlo simulation.
The background from Z
+jets is estimated using γ
+jets as a template. Semi-leptonic decays of heavy flavour hadrons and mismeasured jet energies in certain regions of the detector are the main sources of Z
+jets and γ
+jets background after the selection cuts. The γ p
Tdistribution is reweighted to match the Z p
Tdistribution which corrects for the di
fferent masses of the two bosons, and sources of true E
missTin the photon selection, such as Zγ
→ν¯ νγ, are subtracted using simulation. The primary sources of systematic uncertainty in this background estimation method arise from the true E
missTsubtraction in the photon selection and the systematic uncertainty in the reweighting procedure. The total Z
+jets background is estimated to be 0.8
±0.4
±0.4 (0.9
±0.3
±0.4) in the ee (µµ) channel, where the first error is statistical and the second systematic. These values are consistent with the expectation from Monte Carlo simulation.
Background from W
±+jets is estimated using a matrix method [32]. Tight and loose lepton selections are defined by using the analysis lepton selections and loosening the isolation and identification require- ments, respectively. A 4
×4 matrix contains factors measured from data and Monte Carlo simulation which correlate the true nature of the lepton (‘real’ or ‘fake’) to the tight and loose lepton selections.
The total number of ‘fake’ leptons is extracted from this matrix and the observed numbers of tight and loose leptons. The systematic uncertainty in the background estimate is determined by calculating the factors correlating the ‘fake’ leptons to the tight and loose selections using an independent method and propagating the difference to the background estimate. Using this method, the background from W
±+jetsis estimated to be 1.1
±0.4
±0.3 (0.19
±0.07
±0.06) in the ee (µµ) channel.
5 Cross section measurement
The numbers of expected and observed events after applying all selection cuts are shown in Table 2. The expected contribution from ZZ
→`
+`
−ν¯ ν where one of the Z bosons decays to τ leptons is negligible.
78 ZZ candidates in data with a background expectation of 40.7
±5.6 and with a significance of 3.9σ are observed.
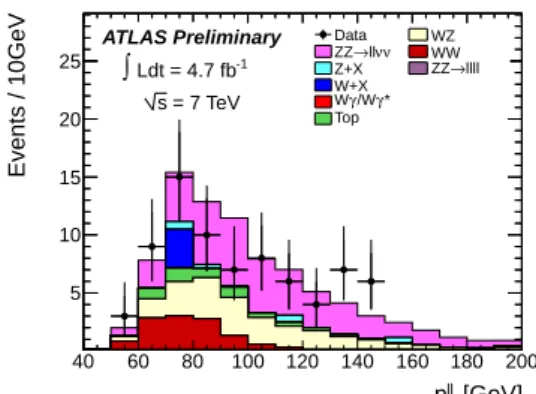
Figure 3 shows the invariant mass, transverse momentum and η distributions of the lepton pair for selected events. The number of jets, E
Tmissand axial-E
missTare also shown, in each case after all selection requirements except that on the variable shown. Figure 4 shows the transverse mass of the ZZ system for the selected events, given by:
m
2T =(E
ZT+E
νTν¯)
2−(~ p
ZT+~ p
ν¯Tν)
2. (1) The distributions observed in data are in agreement with the expectations.
The ZZ fiducial cross section is measured in a phase-space which closely corresponds to the experi-
mental cuts and is defined as follows:
[GeV]
mll
80 85 90 95 100
Events / 4GeV
10 20 30 40 50
60 ATLAS Preliminary
∫Ldt = 4.7 fb-1 = 7 TeV s
Data→llνν ZZ Z+X W+X
γ* γ/W W Top
WZ WW
→llll ZZ
(a) Invariant mass of the lepton pair after all selection requirements.
[GeV]
ll
pT 40 60 80 100 120 140 160 180 200
Events / 10GeV
5 10 15 20 25
ATLAS Preliminary
∫Ldt = 4.7 fb-1 = 7 TeV s
Data→llνν ZZ Z+X W+X
γ* γ/W W Top
WZ WW
→llll ZZ
(b) Transverse momentum of the lepton pair after all selection requirements.
ηll
-3 -2 -1 0 1 2 3
Events / 0.5
5 10 15 20
25 ATLAS Preliminary
∫Ldt = 4.7 fb-1 = 7 TeV s
Data ν ν
→ll ZZ Z+X W+X
γ* γ/W W Top
WZ WW
→llll ZZ
(c) Pseudorapidity of the lepton pair after all selection requirements.
NJet
0 1 2 3 4 5 6 7
Events
20 40 60 80 100 120
ATLAS Preliminary
∫Ldt = 4.7 fb-1 = 7 TeV s
Data ν ν
→ll ZZ Z+X W+X
γ* γ/W W Top
WZ WW
→llll ZZ
(d) Number of jets after all selection requirements, ex- cept for the jet veto.
[GeV]
miss
ET
0 20 40 60 80 100 120 140
Events / 5GeV
10-1
1 10 102
103
104
105
106
107
108
109
ATLAS Preliminary
∫Ldt = 4.7 fb-1 = 7 TeV s
Data→llνν ZZ Z+X W+X
γ* γ/W W Top
WZ WW
→llll ZZ
(e) Missing transverse momentum after all selection requirements, except for the axial-EmissT cut.
[GeV]
miss
Axial-ET
0 20 40 60 80 100 120 140
Events / 5GeV
10-1
1 10 102
103
104
105
106
107
108 ATLAS Preliminary
∫Ldt = 4.7 fb-1 = 7 TeV s
Data→llνν ZZ Z+X W+X
γ* γ/W W Top
WZ WW
→llll ZZ
(f) Axial-EmissT after all selection requirements, except for the axial-EmissT cut.
Figure 3:
Kinematic distributions forZZ candidates summed over both channels. The points represent the ob- served data and the histograms show the predictions from Monte Carlo for the different contributions.Final State e
+e
−ν¯ ν µ
+µ
−ν¯ ν `
+`
−ν¯ ν
Observed 33 45 78
Expected ZZ 19.3
±0.5
±1.2 23.0
±0.6
±0.9 42.3
±0.8
±1.8
Background estimations:
W
±Z (MC) 9.4
±0.5
±1.5 13.3
±0.6
±2.1 22.7
±0.8
±3.5
W
±+γ (MC) 0.20
±0.10
±0.01 0.09
±0.06
±0.01 0.29
±0.12
±0.01 t¯ t, W
±t, W
+W
−and Z
→ττ (data-driven) 6.5
±1.8
±0.3 8.2
±2.3
±0.3 14.7
±4.1
±0.6 Z
+jets (data-driven)0.8
±0.4
±0.4 0.9
±0.3
±0.4 1.7
±0.5
±0.8 W
±+jets (data-driven) 1.1
±0.4
±0.3 0.2
±0.1
±0.1 1.3
±0.4
±0.3 Total Background 18.0
±2.0
±1.6 22.7
±2.4
±2.1 40.7
±4.3
±3.7 Table 2: Summary of observed events, total background contributions and expected signal in the individ- ual and combined channels. The first error is statistical while the second is systematic. The uncertainty on the luminosity is not included.
) [GeV]
miss
(ll+E
Tm
T150 200 250 300 350 400
Events / 20GeV
5 10 15 20 25 30
35 ATLAS Preliminary
∫ Ldt = 4.7 fb
-1= 7 TeV s
Data→llνν ZZ Z+X W+X
γ* γ/W W Top
WZ WW
→llll ZZ
Figure 4: Transverse mass of the ZZ pair. The histograms show the predictions from Monte Carlo for
the di
fferent contributions.
•
ZZ
→`
+`
−ν¯ ν, `
±=e
±, µ
±;
• |m`+`−−
m
Z|< 15 GeV;
• −pν¯Tν×
cos(∆ φ( p ~
Tνν¯, ~ p
TZ)) > 80 GeV;
4•
(|p
νTν¯−p
ZT|)/pZT< 0.6;
•
p
`T> 20 GeV;
• |η`|
< 2.5;
•
No (particle-level) jet with p
T> 25 GeV and
|η|< 4.5. Jets are reconstructed with the anti- k
talgorithm [27] with distance parameter R
=0.4. The jet must not be closer than
∆R
≡ p(∆ η)
2+(∆ φ)
2=0.3 to an electron.
A maximum-likelihood fit is performed to calculate the fiducial cross section on the combination of the two channels. The systematic uncertainties are included in the fitting procedure as nuisance parame- ters. The measured fiducial cross section is:
σ
fidZZ→`+`−ν¯ν =12.2
+3.0−2.8(stat.)
±1.9(syst.)
±0.5(lumi.) fb
where ` refers to either e or µ. The total cross section is determined similarly, but correcting for the Z
→`
+`
−and Z
→ν¯ ν branching fractions and the acceptance of the fiducial cuts. The acceptance of the fiducial cuts, calculated at NLO using the program MC@NLO with the CT10 PDF set, is 0.084
±0.013, where the error arises from PDF uncertainties, QCD scale uncertainty, the difference in acceptance between the gg
→ZZ channel (estimated with
gg2zz[33]) and the q q ¯
→ZZ channel (estimated with MC@NLO) and the difference in acceptance between different generators. The measured value of the total on-shell ZZ cross section is:
σ
totZZ =5.4
+1.3−1.2(stat.)
+1.4−1.0(syst.)
±0.2(lumi.) pb
The result is statistically consistent with the Standard Model total cross section for this process of 6.5
+−0.20.3pb, calculated with MCFM. It is also consistent with the ATLAS ZZ
→`
+`
−`
+`
−result [34], as shown in Figure 5.
6 Conclusion
A first measurement of the ZZ production cross section in the `
+`
−ν¯ ν channel in LHC proton-proton collisions at
√s
=7 TeV has been performed by the ATLAS experiment, using electrons, muons, and missing transverse momentum in the final state. In a dataset with an integrated luminosity of 4.7 fb
−1a total of 78 candidates was observed with a background expectation of 40.7
±4.3(stat.)
±3.7(syst.). The Standard Model expectation for the number of signal events is 42.3
±0.8(stat)±1.8(syst). The fiducial and total cross sections were determined to be
σ
fidZZ→`+`−ν¯ν =12.2
+3.0−2.8(stat.)
±1.9(syst.)
±0.5(lumi.) fb σ
totZZ =5.4
+1.3−1.2(stat.)
+1.4−1.0(syst.)
±0.2(lumi.) pb
The result is consistent with the Standard Model total cross section for this process of 6.5
+−0.20.3pb, and with the ATLAS measurements of the ZZ cross section in the four-lepton channel [11, 34].
4∆φ(p~T ν¯ν, ~pT
Z) is the angle in the transverse plane between the twoZbosons.
[pb]
σ
ZZ3 4 5 6 7 8
ν ν ll
llll
ATLAS Preliminary
∫
L dt = 4.7 fb-1 = 7 TeV sFigure 5: Comparison of total cross sections measured by the ZZ
→`
+`
−`
+`
−[34] and ZZ
→`
+`
−ν¯ ν
analyses with the theory prediction (yellow band).
References
[1] J. M. Campbell, R. K. Ellis and C. Williams, Vector boson pair production at the LHC, JHEP
07(2011) 018.
[2] ALEPH Collaboration, R. Barate et al., Measurement of the e
+e
−→Z Z production cross section at centre-of-mass energies of 183 GeV and 189 GeV, Phys. Lett.
B469(1999) 287.
[3] DELPHI Collaboration, J. Abdallah et al., ZZ production in e
+e
−interactions at
√s
=183 GeV to 209 GeV, Eur. Phys. J.
C30(2003) 447.
[4] L3 Collaboration, M. Acciarri et al., Study of Z Boson Pair Production in e
+e
−collisions at LEP at
√s
=189 GeV, Phys. Lett.
B465(1999) 363.
[5] OPAL Collaboration, G. Abbiendi et al., Study of Z pair production and anomalous couplings in e
+e
−collisions at
√s between 190 GeV and 209 GeV, Eur. Phys. J.
C32(2003) 303.
[6] The LEP Collaborations ALEPH, DELPHI, L3, OPAL, and the LEP Electroweak Working Group, A combination of preliminary electroweak measurements and constraints on the Standard Model,
arXiv:hep-ex/0612034.[7] D0 Collaboration, V. M. Abazov et al., Search for ZZ and Zγ
∗production in p p collisions at ¯
√s
=1.96 TeV and limits on anomalous ZZZ and ZZγ
∗couplings, Phys. Rev. Lett.
100(2008) 131801.
[8] CDF Collaboration, T. Aaltonen et al., Strong Evidence for ZZ Production in pp Collisions at
√s
=


![Figure 5: Comparison of total cross sections measured by the ZZ → ` + ` − ` + ` − [34] and ZZ → ` + ` − ν¯ ν analyses with the theory prediction (yellow band).](https://thumb-eu.123doks.com/thumbv2/1library_info/4025904.1542101/11.892.222.673.399.765/figure-comparison-sections-measured-analyses-theory-prediction-yellow.webp)
